Risk Smart, Grow Fast in TradingIntroduction
Trading has always been seen as a path to quick money, fast success, and even financial freedom. But the truth is that trading is not a get-rich-quick game. For every successful trader who grows fast, there are hundreds who lose money because they ignore the most important foundation of trading: risk management.
“Risk Smart, Grow Fast” is not just a catchy phrase. It’s a principle, a mindset, and a strategy. It means that if you manage your risks wisely, protect your capital, and make decisions with discipline, you can grow faster and more sustainably than if you blindly chase high returns. In fact, smart risk management is the engine that powers growth in trading.
This essay explores the philosophy, strategies, tools, and psychology behind trading with a “Risk Smart, Grow Fast” approach.
Part 1: Why Risk Management Is More Important Than Profit
Most new traders focus on one question: “How much can I make?” The right question, however, is: “How much can I lose if I’m wrong?”
In trading, risk always comes before reward. Here’s why:
Capital Preservation – Without capital, there’s no trading. Losing 50% of your account requires a 100% gain to break even. Protecting your downside ensures you stay in the game.
Compounding Effect – Smaller drawdowns allow compounding to work more efficiently. Even modest profits can grow exponentially when losses are controlled.
Emotional Stability – Large losses trigger fear, stress, and revenge trading. Smart risk control keeps emotions in check, enabling rational decision-making.
Sustainable Growth – Fast growth through reckless risk-taking often ends in collapse. True fast growth comes from controlled risk that compounds over time.
Key Idea: You cannot grow fast unless you manage risk smartly.
Part 2: What Does “Risk Smart” Really Mean?
Being risk smart doesn’t mean avoiding risk altogether. Trading is risk by nature; without risk, there is no reward. Instead, it means taking calculated risks that are aligned with your trading strategy, capital, and goals.
Core principles of being Risk Smart:
Position Sizing – Risking only a small percentage of your capital on each trade (usually 1–2%).
Stop Loss Discipline – Always knowing where you will exit if the trade goes wrong.
Diversification – Not putting all capital into one stock, sector, or instrument.
Risk/Reward Ratio – Ensuring potential reward is at least 2–3 times the risk.
Capital Allocation – Spreading money between short-term trades, long-term investments, and safe reserves.
Think of being risk smart like wearing a seatbelt while driving fast. You may enjoy the thrill of speed, but the seatbelt ensures survival if things go wrong.
Part 3: The Growth Mindset in Trading
While being risk smart focuses on protection, “grow fast” focuses on maximizing opportunities. Growth in trading is not just about profits, but also about knowledge, experience, and adaptability.
Components of the Growth Mindset:
Learning from Losses – Every loss is tuition. Smart traders don’t fear losses; they analyze them to refine strategies.
Adapting to Market Conditions – Markets change; strategies must evolve. What works in a trending market may fail in a choppy one.
Scaling Up Gradually – Growing fast doesn’t mean doubling your risk overnight. It means compounding small consistent gains until you can trade larger with confidence.
Leveraging Technology – Using charting tools, algo trading, backtesting, and data analytics to grow faster than traditional traders.
Mind and Body Discipline – Growth requires sharp focus, emotional control, and physical health. Trading is mental warfare; stamina matters.
Part 4: Balancing Risk and Growth
The challenge is balancing risk smart and grow fast. Too much focus on risk may lead to over-caution, missing opportunities. Too much focus on growth may cause reckless risk-taking.
Here’s how to strike the balance:
Risk Small, Scale Big – Start by risking 1–2% per trade. As your capital grows, absolute profits grow faster.
Compound Gains – Reinvest profits strategically instead of withdrawing all earnings.
Optimize Position Sizing – Adjust size based on volatility, conviction, and account size.
Use Asymmetric Setups – Look for trades where upside is significantly greater than downside.
Review Weekly, Act Daily – Analyze risk exposure weekly while executing growth trades daily.
Part 5: Practical Risk Smart Techniques
The 1% Rule – Never risk more than 1% of account value on a single trade.
Example: With $10,000 capital, maximum risk per trade = $100.
The 2:1 or 3:1 Rule – For every $1 risked, aim to make $2–$3.
Stop Loss & Trailing Stops – Set stop losses for protection and use trailing stops to lock profits as the trade moves in your favor.
Risk Diversification –
Across asset classes (stocks, forex, commodities, crypto).
Across sectors (IT, pharma, banking).
Across time horizons (scalping, swing, long-term).
Hedging with Options – Using protective puts or covered calls to cap downside risk.
Volatility Awareness – Adjusting position size based on market volatility (e.g., smaller trades during high VIX).
Part 6: Strategies to Grow Fast
Trend Following – Capturing large moves in trending markets. “The trend is your friend” until it bends.
Breakout Trading – Entering when price breaks major support/resistance levels with volume confirmation.
Swing Trading – Exploiting short- to medium-term price swings for consistent growth.
Position Trading – Holding positions for weeks/months based on macro or sectoral trends.
Leverage Smartly – Using moderate leverage to accelerate growth, but only when risk is tightly controlled.
Scaling In and Out – Adding to winning trades (pyramiding) and reducing exposure on uncertainty.
Part 7: Psychology of Risk Smart Growth
Trading success is 20% strategy and 80% psychology. To “risk smart, grow fast,” a trader must master their mind.
Discipline Over Impulse – Following the plan, not emotions.
Patience to Wait – Avoiding overtrading. Opportunities will always come.
Resilience to Losses – Viewing losses as part of the game, not personal failure.
Confidence Without Arrogance – Trusting your system but staying humble before markets.
Growth Mindset – Believing that skills improve with practice, not fixed by talent.
Part 8: Case Studies
Case 1: The Reckless Trader
Rahul had ₹5 lakhs and doubled it in 3 months by taking huge leveraged bets on penny stocks. But one wrong move wiped out 80% of his capital. His fast growth collapsed because he was not risk smart.
Case 2: The Risk Smart Trader
Anita had ₹5 lakhs too. She risked only 1% per trade, focused on high R/R setups, and compounded profits. In one year, she grew her account to ₹7.5 lakhs steadily. She didn’t double it overnight, but her growth was sustainable and replicable.
Lesson: Fast reckless growth often leads to collapse. Risk smart growth compounds wealth.
Part 9: Tools for Risk Smart Growth
Trading Journal – Records trades, mistakes, emotions, and improvements.
Risk Calculators – To determine position size before placing a trade.
Charting Platforms – TradingView, MetaTrader, NinjaTrader.
Backtesting Software – To validate strategies before applying real capital.
News & Data Feeds – For staying ahead of market-moving events.
AI & Algo Tools – Automating discipline and minimizing emotional decisions.
Part 10: The Roadmap to “Risk Smart, Grow Fast”
Foundation – Learn basics, risk management, and trading psychology.
System Development – Build and backtest your own trading strategy.
Capital Protection – Apply strict stop losses and position sizing.
Small Scale Trading – Start with small capital or paper trading.
Gradual Scaling – Increase trade size as consistency improves.
Compounding Phase – Reinvest profits to accelerate growth.
Mastery & Automation – Use technology and delegation for efficiency.
Conclusion
“Risk Smart, Grow Fast” is not just a slogan—it’s the essence of long-term trading success. The markets will always remain uncertain, volatile, and risky. But if you respect risk, embrace discipline, and use smart strategies, you can not only survive but thrive.
Fast growth in trading doesn’t come from reckless gambling—it comes from the slow magic of compounding, powered by smart risk management.
In the end, trading is like sailing. The winds of the market are unpredictable, but if you set your sails wisely, control your risks, and ride the waves with patience, you can reach your destination faster than you ever imagined.
Teslamotors
Retail vs Institutional Trading1. Defining Retail and Institutional Trading
1.1 Retail Trading
Retail traders are individual investors who buy and sell financial instruments with their personal money. They typically trade via online brokerage accounts or traditional brokers, using platforms like Zerodha, Robinhood, Charles Schwab, Fidelity, or Interactive Brokers.
Characteristics of retail traders:
Small capital size (from a few hundred dollars to a few lakh/ thousands).
Shorter time horizons, often focusing on short-term gains or personal investment goals.
Use of simplified platforms and basic tools.
Limited access to insider research or advanced market data.
Highly influenced by news, social media, or trends.
1.2 Institutional Trading
Institutional traders are large organizations that trade on behalf of clients, funds, or corporations. Examples include mutual funds, hedge funds, pension funds, insurance companies, sovereign wealth funds, and investment banks.
Characteristics of institutional traders:
Massive capital base, often billions of dollars.
Longer time horizons, though hedge funds may also engage in short-term or high-frequency trading.
Access to advanced research, analytics, and algorithmic trading systems.
Ability to negotiate better fees, spreads, and execution rates.
Often influence market prices due to the sheer size of their trades.
2. Scale of Operations
The most obvious difference between retail and institutional trading is scale.
A retail trader may buy 50 shares of Apple or a few lots of Nifty futures.
An institutional trader might purchase millions of shares or manage portfolios worth tens of billions.
This scale difference creates unique dynamics:
Institutions cannot move in and out of positions easily without affecting prices.
Retail traders, due to their small size, enjoy agility and can enter/exit positions quickly.
3. Tools and Technology
3.1 Retail Traders
Retail traders typically rely on:
Trading apps (e.g., Zerodha Kite, Robinhood, TD Ameritrade).
Technical indicators like moving averages, RSI, MACD.
Basic charting platforms (TradingView, MetaTrader).
Limited access to real-time institutional data.
3.2 Institutional Traders
Institutional traders operate on another level with:
Algorithmic and High-Frequency Trading (HFT) systems.
Proprietary trading models, AI, and machine learning.
Direct market access (DMA) with ultra-low latency.
Bloomberg terminals and advanced risk management dashboards.
Teams of analysts and quants for research.
Thus, while retail trading is often manual and discretionary, institutional trading is increasingly automated and systematic.
4. Market Impact
4.1 Institutional Impact
When an institution places a trade worth hundreds of millions, it can move the market price significantly. For example, if BlackRock decides to buy a large stake in a company, the stock may rise due to sudden demand.
4.2 Retail Impact
Retail traders usually have minimal market-moving power individually. However, when retail traders act collectively—such as the GameStop short squeeze of 2021—they can move markets in dramatic ways.
5. Trading Strategies
5.1 Retail Trading Strategies
Swing trading: Holding for days/weeks.
Day trading: Multiple intraday trades.
Options trading: Buying calls/puts with limited risk.
Trend following: Using technical indicators.
News-based trading: Reacting to announcements.
Retail traders often focus on simplicity and quick gains.
5.2 Institutional Trading Strategies
Quantitative trading: Using complex mathematical models.
High-frequency trading (HFT): Thousands of trades in milliseconds.
Arbitrage: Exploiting price differences across markets.
Long-term value investing: Buying undervalued assets for decades.
Hedging: Managing risk for clients.
Institutions play a more diverse and sophisticated game, balancing risk with return.
6. Advantages and Disadvantages
6.1 Retail Traders – Advantages
Agility: Small size means quick exits.
Independence: Can take risks institutions cannot.
Accessibility: Online trading platforms allow low entry barriers.
Potential for outsized gains: A single bet can multiply wealth.
6.2 Retail Traders – Disadvantages
Lack of information edge.
Higher fees/spreads compared to institutions.
Emotional decision-making (fear & greed).
Susceptible to scams, herd mentality, or misinformation.
6.3 Institutional Traders – Advantages
Access to best research, tools, and liquidity.
Negotiated low transaction costs.
Economies of scale.
Ability to influence companies (activist investing).
6.4 Institutional Traders – Disadvantages
Too large to be nimble—cannot exit quickly.
Market scrutiny from regulators.
Pressure to perform consistently for clients.
Vulnerable to systemic risks (2008 crisis showed big funds collapsing).
7. Psychology of Trading
Retail traders often suffer from emotional biases: fear of missing out (FOMO), panic selling, or chasing hype stocks.
Institutional traders follow more disciplined, rule-based systems with committees and checks to reduce emotional influence.
However, even institutions are not immune to herding behavior—when many funds chase the same trend (dot-com bubble, crypto mania).
8. Regulatory Environment
Retail trading is regulated to protect small investors from fraud and unfair practices.
Institutional trading is regulated to prevent market manipulation, insider trading, and systemic risks.
Regulators such as SEBI (India), SEC (U.S.), FCA (UK) ensure fair play across both sides.
9. Retail vs Institutional in Emerging Markets
In markets like India, Brazil, and Southeast Asia, retail participation has exploded due to:
Mobile apps and digital brokers.
Increased financial literacy.
Rising disposable incomes.
At the same time, institutions (domestic mutual funds, FIIs) dominate long-term flows. The push-pull between retail excitement and institutional discipline often drives volatility.
10. Case Studies
10.1 GameStop Mania (2021)
Retail traders on Reddit’s WallStreetBets drove a short squeeze against hedge funds, showing retail’s collective power.
10.2 2008 Global Financial Crisis
Institutional excesses in mortgage-backed securities triggered a meltdown, proving that large-scale institutional risks can destabilize the entire global economy.
10.3 Indian Markets (2020–2022)
Post-COVID, Indian retail investors surged through platforms like Zerodha and Groww, increasing direct retail ownership of equities. However, FIIs (Foreign Institutional Investors) still dominate net flows.
Conclusion
Retail and institutional traders may seem to be playing the same game, but they operate with very different tools, capital, psychology, and strategies.
Retail trading is marked by agility, independence, and passion, but limited by scale and access.
Institutional trading is marked by power, research, and influence, but limited by bureaucracy and systemic exposure.
Both are crucial pillars of the financial markets. Retail provides liquidity, diversity, and vibrancy, while institutions provide stability, scale, and depth.
Ultimately, the relationship between retail and institutional traders is not adversarial but symbiotic—together, they make markets more efficient, liquid, and reflective of global economic realities.
Trading Master Class With ExpertsBeginner-Friendly Option Trading Strategies
Let us now study some beginner-friendly option trading strategies in detail.
Covered Call Strategy
Best for: Investors who already own shares.
Market Outlook: Neutral to slightly bullish.
How it works:
Buy or hold 100 shares of a company.
Sell (write) a call option on the same stock.
Example:
You own Infosys shares bought at ₹1600.
You sell a call option at strike ₹1700 for ₹30 premium.
Outcomes:
If Infosys stays below ₹1700, you keep the ₹30 premium (profit).
If Infosys rises above ₹1700, you must sell shares at ₹1700. You still make profit because your cost was ₹1600.
Pros:
Generates steady income.
Low risk.
Cons:
Your profit is capped if stock rises sharply.
Educational takeaway: A covered call is like earning rent on a property you own.
Protective Put Strategy
Best for: Investors who want insurance for their portfolio.
Market Outlook: Bullish, but with fear of downside risk.
How it works:
Buy shares of a company.
Buy a put option for protection.
Example:
You buy TCS shares at ₹3600.
You purchase a put option with strike ₹3500 for ₹50.
If TCS falls to ₹3300, your shares lose ₹300. But your put option gains value, limiting your losses.
Pros:
Acts like insurance.
Protects against big losses.
Cons:
Premium cost reduces net return.
Educational takeaway: A protective put is like buying health insurance—you hope not to use it, but it provides safety.

Divergence SecretsIntroduction to Options Trading (Educational Foundation)
Options are one of the most important financial instruments available in modern markets. For a beginner, understanding them may feel overwhelming at first, but with the right approach, they can become a powerful tool for investment, speculation, and risk management.
An option is a financial contract that gives its holder the right (but not the obligation) to buy or sell an asset, such as a stock, at a predetermined price, within a fixed time frame.
There are two major types of options:
Call Option – Provides the right to buy the underlying asset at a fixed price (called the strike price).
Put Option – Provides the right to sell the underlying asset at a fixed price.
For example:
Imagine you believe Infosys stock, currently at ₹1600, will rise soon. Instead of buying the stock directly, you can buy a call option with strike ₹1650. If Infosys rises to ₹1700, your option increases in value, and you earn profit without investing the full cost of shares.
This flexibility is what makes options attractive—but also dangerous if used without proper strategies.
Why Beginners Need Strategies Instead of Random Trades
Options can generate huge profits, but they can also cause significant losses. Many beginners are tempted to “buy cheap options” hoping for quick riches. Unfortunately, statistics show that most lose money in the long run.
The reasons are:
Options lose value with time decay (Theta).
Market moves are unpredictable; random bets rarely succeed.
Beginners underestimate risk exposure.
That’s why structured strategies are necessary. A strategy gives:
Clarity – A defined plan for entry and exit.
Risk management – Limited losses instead of unlimited risk.
Flexibility – Ability to profit in different market conditions (bullish, bearish, sideways, or volatile).
In education terms: A strategy is like a map. Just as students need a study plan to pass exams, traders need strategies to succeed in markets.

Part 1 Support and ResistenceLong Straddle (High Volatility Bet)
Best for: Beginners who expect big move but don’t know direction.
Market Outlook: High volatility (e.g., before results, elections).
How it works:
Buy a call and a put at same strike price.
Example:
Nifty at 22,000.
Buy 22,000 call at ₹150.
Buy 22,000 put at ₹160.
Total cost = ₹310.
If Nifty moves strongly (up or down), one option gives profit. If Nifty stays flat, you lose premium.
✅ Pros: Profit in any direction.
❌ Cons: Expensive, loses money in sideways market.
Long Strangle (Cheaper Volatility Bet)
Similar to straddle but uses different strike prices.
Example: Buy 21,800 put + 22,200 call.
Cheaper than straddle but requires bigger move for profit.
Iron Condor (Sideways Market Strategy)
Best for: Beginners who think market will stay in range.
Market Outlook: Neutral.
How it works:
Sell an out-of-the-money call.
Buy a further out-of-the-money call.
Sell an out-of-the-money put.
Buy a further out-of-the-money put.
This creates a “range” where you earn profit.
✅ Pros: Works best in stable market.
❌ Cons: Complicated, limited profit.

Part 2 Master Candlestick PatternIntroduction to Options Trading (Basics)
Options trading is one of the most exciting areas in the stock market. Unlike buying and selling shares directly, options allow traders to control a stock without owning it fully. This gives leverage (more exposure with less money), but it also carries risks.
An option is a contract that gives you the right (but not the obligation) to buy or sell a stock at a certain price before a certain date.
Call Option: Right to buy at a fixed price (strike price).
Put Option: Right to sell at a fixed price.
For example:
Suppose Reliance stock is ₹2500. You buy a call option with strike price ₹2600 (expiry in one month). If Reliance goes up to ₹2800, your option value rises, and you make profit without investing huge capital.
Options can be used in different ways:
To speculate (bet on direction)
To hedge (protect investments)
To earn income (through writing options)
But for beginners, blindly speculating with options is risky. That’s why strategies are important—they give a structured approach to trading instead of gambling.
Why Beginners Need Strategies Instead of Random Trades
Most new traders jump into options because they see “quick profits.” However, around 80-90% of beginners lose money in options. The main reason is lack of planning.
Here’s why strategies matter:
Risk Control: Options have unlimited loss potential if traded recklessly. Strategies limit risk.
Consistent Approach: Instead of random bets, strategies follow defined rules.
Flexibility: Strategies allow traders to profit in different market conditions (up, down, sideways).
Capital Efficiency: Beginners usually have limited funds; strategies help them maximize capital use.
Example:
Instead of buying a random call option (which can expire worthless), a beginner can use a bull call spread, reducing risk while still having profit potential.

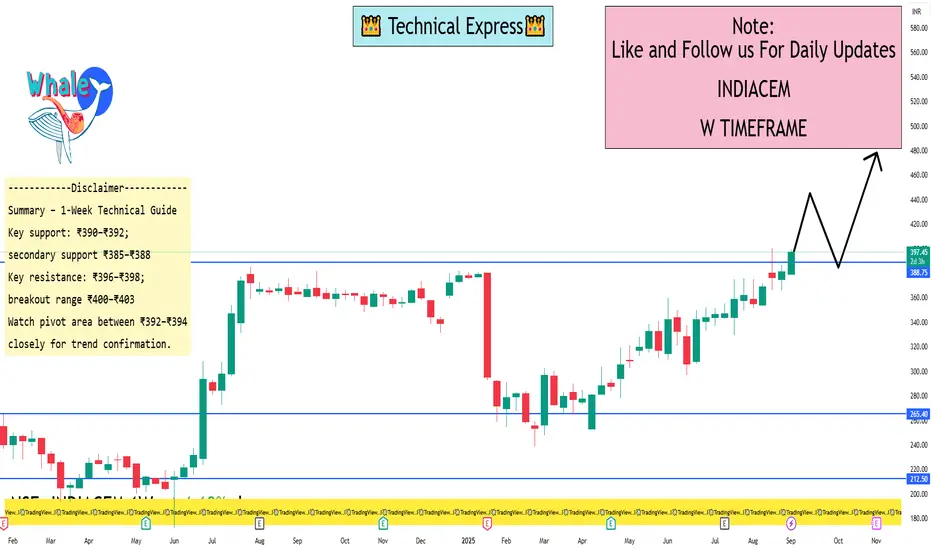
India Cements Ltd. 1 Week ViewCurrent Trend & Technical Overview
On daily analysis, the stock is in a Strong Buy zone, with all moving averages across 5-, 10-, 20-, 50-, 100-, and 200-day periods signaling buy, alongside predominantly bullish indicators such as RSI (~74.9), MACD, ADX, ROC, and more
The stock is trading near its 52-week high (~₹400), with a current range of approximately ₹385–₹398
Analysts maintain a Strong Buy technical stance, though consensus price targets indicate potential downside (~₹282 avg target vs current ~₹397), suggesting valuation may be extended
1-Week Technical Levels
Pivot Points (from Investing.com data):
Classic Pivots (Daily):
S1: ₹390.16
Pivot: ₹392.48
R1: ₹396.61
R2: ₹398.93
R3: ₹403.06
Supports: down to ₹383.71
Fibonacci, Camarilla, and Woodie pivots are closely clustered—suggest key levels between ₹392–₹394 (pivot), with resistance around ₹396–₹398 and support near ₹386–₹390
TradingView Idea (dated August):
Bullish Entry: Daily close above ₹232/₹239, safe entry above ₹269.
Targets: ₹291–₹296 initially; further upside to ₹350–₹354 and ₹409–₹413.
Bearish Risk: Close below ₹223 may expose ₹203 and ₹173
(Note: Those levels are older and far below current prices; still helpful historically.)
Quantitative Trading1. Introduction to Quantitative Trading
Quantitative trading, often called “quant trading”, refers to the use of mathematical models, statistical techniques, and computer algorithms to identify and execute trading opportunities in financial markets. Unlike traditional trading, where decisions may rely heavily on human intuition or fundamental analysis (such as studying company balance sheets or industry trends), quant trading uses data-driven models to make objective, systematic, and automated decisions.
At its core, quantitative trading answers a simple question:
Can we use numbers, patterns, and algorithms to predict price movements and make profitable trades?
Over the past few decades, quant trading has transformed financial markets. Large hedge funds, investment banks, and proprietary trading firms heavily rely on it to generate profits. In fact, some of the world’s most successful funds—such as Renaissance Technologies’ Medallion Fund—are almost entirely quant-driven.
2. The Evolution of Quantitative Trading
2.1 Early Beginnings
Quant trading is not entirely new. Even in the 1970s and 1980s, traders began using computers to run backtests and automate parts of their strategies. The Black-Scholes model (1973), which priced options mathematically, is often considered the birth of modern quant finance.
2.2 Rise of Computers and Data
In the 1990s, as computing power grew and financial markets digitized, quant trading became more widespread. Firms started processing huge amounts of tick-by-tick data to uncover hidden patterns.
2.3 High-Frequency Trading (HFT)
By the 2000s, high-frequency trading exploded. These strategies used ultra-fast algorithms to execute thousands of trades per second, capitalizing on micro-price movements.
2.4 Today’s Era
Now, quant trading has matured into multiple branches—statistical arbitrage, algorithmic execution, machine learning-driven strategies, and hybrid approaches. Artificial Intelligence (AI) and Big Data have added new layers, allowing traders to incorporate alternative data (like social media sentiment, satellite images, or shipping data) into their models.
3. Core Principles of Quantitative Trading
To understand quant trading, we need to break down its building blocks:
3.1 Data
The lifeblood of quant trading is data. Types of data include:
Market Data: Prices, volumes, bid-ask spreads, order books.
Fundamental Data: Earnings reports, balance sheets, macroeconomic indicators.
Alternative Data: Social media sentiment, credit card spending, satellite images, Google search trends.
3.2 Hypothesis and Strategy
Every quant strategy starts with a hypothesis. For example:
Stocks that fall sharply in one day tend to bounce back the next day (mean reversion).
Momentum stocks (those rising consistently) may keep rising for some time.
Statistical relationships exist between two correlated assets, like crude oil and airline stocks.
3.3 Mathematical Models
These hypotheses are turned into models using:
Statistics: Regression analysis, correlation, co-integration.
Probability: Predicting the likelihood of price changes.
Optimization: Determining the best allocation of capital across trades.
Machine Learning: Using algorithms like random forests, neural networks, or reinforcement learning to identify patterns.
3.4 Backtesting
Before risking real money, strategies are tested on historical data. The process checks:
Did the strategy work in the past?
Was it profitable after accounting for transaction costs?
How risky was it? (volatility, drawdowns, maximum loss)
3.5 Execution
Execution is the process of turning a signal into an actual trade. Execution itself can be algorithmic—using smart order routing, VWAP (Volume-Weighted Average Price) algorithms, or iceberg orders (which hide large trades).
3.6 Risk Management
Risk control is central to quant trading. Strategies are designed with limits:
Position Sizing: How much capital to allocate per trade.
Stop-Loss: Automatically cutting losses when prices move against you.
Diversification: Spreading across multiple assets, sectors, or markets.
4. Types of Quantitative Trading Strategies
Quant trading covers a wide spectrum of strategies:
4.1 Statistical Arbitrage
Exploiting price inefficiencies between related securities. Example:
If two historically correlated stocks diverge in price, a quant may short the overperformer and buy the underperformer, expecting reversion.
4.2 Trend Following
Strategies that bet on continuation of price momentum. Example:
Buy when the 50-day moving average crosses above the 200-day moving average.
4.3 Mean Reversion
Based on the belief that prices revert to their average. Example:
If a stock deviates 2 standard deviations from its mean, short it (if above) or buy it (if below).
4.4 High-Frequency Trading (HFT)
Ultra-fast algorithms that trade in microseconds. Types include:
Market Making: Posting continuous buy and sell quotes to profit from bid-ask spreads.
Latency Arbitrage: Exploiting delays in data transmission.
Event-Driven Trading: Reacting instantly to news releases or earnings announcements.
4.5 Machine Learning & AI-Driven
Using algorithms like neural networks or reinforcement learning to detect complex, non-linear relationships in data. Example:
Predicting intraday stock price direction using Twitter sentiment and order book dynamics.
4.6 Quant Macro
Models that trade currencies, bonds, and commodities based on global economic indicators like interest rates, inflation, or GDP growth.
4.7 Options & Derivatives Trading
Quant strategies often involve options due to their complexity. For instance:
Volatility Arbitrage: Exploiting differences between implied and realized volatility.
5. Tools and Technologies in Quant Trading
Quantitative trading is powered by technology. Some common tools include:
Programming Languages: Python, R, C++, Java, MATLAB.
Data Platforms: Bloomberg, Refinitiv, Quandl, Tick Data providers.
Trading Platforms: Interactive Brokers, MetaTrader, FIX protocol systems.
Libraries & Frameworks:
Python: Pandas, NumPy, Scikit-learn, PyTorch, TensorFlow.
R: Quantmod, xts, caret.
Databases: SQL, MongoDB, time-series databases.
Execution Infrastructure: Low-latency connections, co-located servers near exchanges.
6. Advantages of Quantitative Trading
Objectivity: Decisions are based on models, not emotions.
Speed: Algorithms execute trades far faster than humans.
Scalability: One model can trade across hundreds of securities simultaneously.
Backtesting: Strategies can be validated before deployment.
Diversification: Easier to spread across multiple asset classes.
7. Challenges and Risks of Quantitative Trading
Overfitting: A model may look great on past data but fail in real markets.
Market Changes: Patterns may stop working as markets evolve.
Data Quality Issues: Inaccurate or incomplete data leads to wrong signals.
High Competition: Many firms run similar models, reducing profitability.
Execution Costs: Transaction costs, slippage, and latency can eat profits.
Black-Box Risk: Complex models (especially AI) may make trades that are hard to interpret.
8. Risk Management in Quantitative Trading
Risk management is non-negotiable. Techniques include:
Value at Risk (VaR): Measuring the maximum expected loss at a given confidence level.
Stress Testing: Simulating extreme market conditions.
Stop-Losses and Circuit Breakers: Automatic exit rules to prevent catastrophic losses.
Capital Allocation Rules: Ensuring no single trade wipes out the portfolio.
9. Real-World Examples
9.1 Renaissance Technologies
Perhaps the most famous quant firm. Its Medallion Fund reportedly generates over 30–40% annual returns, net of fees, by using secretive statistical models.
9.2 Two Sigma
Another large quant fund that integrates AI, big data, and distributed computing to identify global trading opportunities.
9.3 Citadel Securities
A market-making giant using advanced quantitative models for execution and liquidity provision.
10. Ethical and Regulatory Aspects
Quant trading has sparked debates:
Fairness: Is HFT giving large firms an unfair edge?
Market Stability: Algorithms may trigger flash crashes (e.g., May 2010 Flash Crash).
Transparency: Regulators worry about opaque AI-driven “black-box” strategies.
Regulations: Different countries regulate algorithmic trading differently (e.g., SEBI in India, SEC in the U.S.).
Conclusion
Quantitative trading represents the intersection of finance, mathematics, statistics, and computer science. It replaces gut-feeling decisions with systematic, data-driven approaches, creating a more efficient and liquid marketplace.
However, quant trading is not risk-free. Over-reliance on models, data biases, or sudden market regime shifts can lead to large losses. Successful quant traders balance mathematical rigor with risk management, adaptability, and technological innovation.
As markets evolve, quantitative trading will continue to expand—shaped by AI, machine learning, alternative data, and possibly even quantum computing. The future belongs to those who can combine creativity with computation, turning raw numbers into actionable strategies.
FII and DII: The Backbone of Indian Capital Markets1. Introduction
The Indian stock market is one of the most dynamic and closely watched financial markets in the world. Every day, billions of rupees are traded, with share prices moving up and down in response to domestic and international events. Behind these movements lie the activities of two important groups of investors: Foreign Institutional Investors (FII) and Domestic Institutional Investors (DII).
While retail investors, high-net-worth individuals (HNIs), and proprietary traders also play an important role, FIIs and DIIs often act as the market movers. Their investment decisions not only influence short-term market trends but also shape the long-term growth of the financial ecosystem.
In this write-up, we will cover the concepts of FII and DII, their differences, importance, regulatory framework, market impact, historical trends, pros and cons, and their role in shaping India’s economic future.
2. Understanding FII (Foreign Institutional Investors)
2.1 Definition
Foreign Institutional Investors (FIIs) are investment institutions or entities registered outside India that invest in Indian financial markets. These include:
Pension funds
Hedge funds
Sovereign wealth funds
Insurance companies
Mutual funds
Investment banks
FIIs enter Indian markets with the objective of generating returns, benefiting from India’s growth story, and diversifying their global portfolio.
2.2 Role in the Market
They bring foreign capital into the country.
Improve liquidity by trading in large volumes.
Provide global perspective in terms of valuation and growth potential.
Help Indian markets integrate with the global financial system.
2.3 Types of FIIs
Foreign Portfolio Investors (FPIs): Invest mainly in stocks, bonds, and derivatives without having controlling stakes.
Foreign Direct Investors (FDI entities): Unlike FPIs, they invest for ownership and long-term control (factories, joint ventures, etc.).
Sovereign Wealth Funds (SWFs): Government-owned investment vehicles.
Hedge Funds & Private Equity Funds: High-risk, high-return players.
3. Understanding DII (Domestic Institutional Investors)
3.1 Definition
Domestic Institutional Investors (DIIs) are investment institutions incorporated within India that invest in Indian markets. Examples include:
Indian mutual funds
Insurance companies (LIC, ICICI Prudential, HDFC Life, etc.)
Banks
Pension funds (EPFO, NPS)
Indian financial institutions
3.2 Role in the Market
Provide stability to the market during volatile phases.
Act as a counterbalance to FIIs.
Channelize domestic savings into productive assets.
Support government disinvestment programs (for example, DIIs buying stakes in PSUs).
3.3 Sources of Funds for DIIs
Household savings through SIPs and insurance premiums.
Contributions to provident funds and pension schemes.
Long-term institutional reserves.
4. Difference Between FII and DII
Aspect FII (Foreign Institutional Investors) DII (Domestic Institutional Investors)
Origin Outside India Within India
Nature of Capital Foreign inflows Domestic savings
Impact Short-term market movers, high volatility Provide long-term stability
Currency Risk Subject to forex fluctuations No currency risk
Motivation Purely profit-driven Mix of profit motive & national economic interest
Regulation SEBI + RBI + FEMA regulations SEBI + Indian financial regulators
Market Behavior Highly sensitive to global cues (US Fed policy, crude oil prices, dollar index, etc.) More sensitive to domestic economy (inflation, fiscal policies, RBI policy, etc.)
5. Regulatory Framework
5.1 Regulation of FIIs
Securities and Exchange Board of India (SEBI): Registration and compliance.
Reserve Bank of India (RBI): Foreign exchange rules under FEMA.
Limits on investment: Sectoral caps (e.g., banks, defense, telecom).
5.2 Regulation of DIIs
SEBI: Oversees mutual funds, insurance companies, and pension funds.
IRDAI: Regulates insurance companies.
PFRDA: Governs pension funds.
RBI: Regulates banking institutions.
6. Importance of FIIs in India
Liquidity Provider: FIIs inject huge volumes of foreign capital.
Valuation Benchmarking: Their global comparison of valuation metrics helps align Indian markets with international standards.
Rupee Strength: FII inflows support India’s forex reserves and currency.
Economic Growth: Funds raised by companies through markets are fueled by FIIs.
However, FIIs can also exit quickly, causing sharp falls.
7. Importance of DIIs in India
Counterbalance to FIIs: When FIIs sell, DIIs often buy, preventing market crashes.
Utilization of Household Savings: Converts Indian savings into stock market capital.
Long-term Focus: Unlike FIIs, DIIs are not quick to exit.
Support in Government Policies: DIIs participate in PSU disinvestment.
8. Historical Trends: FII vs DII in Indian Markets
2003–2008: FIIs were dominant, driving the bull run before the global financial crisis.
2008–09 Crisis: FIIs pulled out massively, leading to a crash. DIIs helped stabilize.
2013: "Taper tantrum" – FIIs exited due to US Fed tightening.
2016 Demonetization & GST era: FIIs cautious, DIIs (via mutual fund SIP boom) became strong.
2020 COVID Crash: FIIs sold aggressively, but DIIs bought the dip.
2021–22 Bull Run: Both FIIs and DIIs invested heavily.
2022 Russia-Ukraine War & US Fed hikes: FIIs sold; DIIs supported the market.
9. Market Impact of FIIs and DIIs
Short-term trends: Often dictated by FII activity.
Long-term growth: Driven by DII investments.
Volatility: Sharp swings occur when FII flows are large.
Index levels: FIIs have a heavy influence on NIFTY, Sensex due to large-cap focus.
10. Pros and Cons of FII and DII
Pros of FIIs
Bring foreign capital.
Enhance market efficiency.
Create global visibility for Indian companies.
Cons of FIIs
Can cause volatility.
Sensitive to global events.
Currency depreciation risks.
Pros of DIIs
Provide stability.
Channelize domestic wealth.
Long-term focus.
Cons of DIIs
Limited fund pool compared to FIIs.
Sometimes influenced by government policies.
Conclusion
The interplay between Foreign Institutional Investors (FIIs) and Domestic Institutional Investors (DIIs) is the heartbeat of India’s capital markets. While FIIs provide the oxygen of foreign capital and liquidity, DIIs act as the backbone of resilience and stability. Together, they create a balanced ecosystem where volatility is managed, growth is fueled, and investor confidence is nurtured.
For retail investors, closely tracking FII and DII activity can provide deep insights into market direction. For policymakers, balancing both sources of funds ensures that India’s financial markets remain globally competitive yet domestically stable.
In the future, as India’s economy grows and becomes more integrated with the global financial system, the partnership of FIIs and DIIs will play a decisive role in shaping India’s financial destiny.

Zero-Day Option Trading – A Complete GuideIntroduction
In the ever-evolving world of financial markets, few innovations have captured as much attention in recent years as Zero-Day-to-Expiration (0DTE) options, often called zero-day options. These are options contracts that expire on the same day they are traded. While options have existed for decades, the rise of same-day expirations has changed the dynamics of short-term trading, introducing new opportunities as well as new risks.
For traders seeking quick profits, hedging opportunities, or exposure to rapid intraday movements, zero-day options have become a favored tool. But they also come with significant dangers, often magnified compared to traditional options. Understanding how they work, why they have become so popular, and what strategies traders use is essential for anyone interested in modern derivatives trading.
This article explores zero-day option trading in detail, covering their mechanics, advantages, risks, strategies, psychology, and impact on markets.
1. What Are Zero-Day Options?
Options are derivative contracts that give the buyer the right, but not the obligation, to buy (call option) or sell (put option) an underlying asset at a predetermined price (strike price) before or on expiration. Traditionally, options had expiration cycles that were weekly or monthly.
Zero-Day Options (0DTE): These are options that expire on the same day they are traded. If you buy or sell such an option at 9:30 AM when the market opens, it will expire by the market close that same day.
Origins: Initially, exchanges like the Chicago Board Options Exchange (CBOE) offered weekly options on popular indices like the S&P 500 (SPX). Over time, demand for shorter expirations grew, leading to daily expirations. Today, in major U.S. indices, traders can find options expiring every trading day.
Key Example: The most liquid zero-day options are SPX 0DTE options, which allow traders to speculate or hedge intraday moves of the S&P 500.
In essence, 0DTE options compress what used to be a weeks-long or months-long trade into just a few hours.
2. Why Have Zero-Day Options Become Popular?
Several factors have fueled the explosion of interest in zero-day trading:
Rise of Retail Traders: Platforms like Robinhood and Zerodha have democratized access, allowing small traders to speculate intraday with relatively low capital.
Volatility Opportunities: Daily market fluctuations create many chances for fast profits.
Low Premiums: Because these contracts have almost no time value, their premiums are much cheaper than longer-term options, making them attractive to small traders.
Hedging Flexibility: Institutional players use 0DTE options to hedge positions in real-time without holding long-dated contracts.
Algorithmic Trading: Quant funds and high-frequency traders (HFTs) use 0DTE contracts to profit from micro-movements.
In short, they offer speed, flexibility, and leverage—three qualities traders love.
3. Characteristics of Zero-Day Options
Zero-day options differ from regular options in several ways:
Time Decay (Theta): Extremely rapid. An option may lose 50% of its value within an hour.
Implied Volatility (IV): Priced based on near-term expectations; sudden spikes can dramatically move premiums.
Gamma Risk: Very high. Small moves in the underlying asset lead to disproportionately large changes in option prices.
Liquidity: Typically very high in indices like SPX and Nifty Bank in India, enabling easy entry and exit.
Settlement: Most are cash-settled in indices, reducing delivery risk.
These properties make them both powerful trading tools and dangerous traps.
4. Advantages of Zero-Day Option Trading
High Leverage: Small premium outlay, large exposure.
Quick Turnaround: Ideal for intraday traders who want same-day settlement.
Hedging Capability: Institutions hedge unexpected intraday risks.
Lower Capital Requirement: No need to lock money for weeks.
Multiple Expiration Choices: Ability to tailor trades to exact days of market events (Fed meeting, earnings, etc.).
5. Risks of Zero-Day Option Trading
Despite the allure, 0DTE options are not for the faint-hearted:
Near-Total Premium Loss: Out-of-the-money contracts can expire worthless within hours.
Emotional Stress: Requires rapid decision-making; mistakes are common.
Gamma Squeeze Risk: Sudden moves cause exponential losses for sellers.
Limited Recovery Time: Unlike longer options, there’s no time to wait for reversal.
Overtrading: Easy access and cheap premiums tempt traders into gambling.
This is why professional traders often warn beginners against 0DTE trading unless they fully understand the risks.
6. Strategies in Zero-Day Option Trading
6.1 For Buyers
Directional Bets: Buy calls if bullish, puts if bearish. Best suited when expecting large intraday moves.
Lottery Tickets: Out-of-the-money calls/puts bought cheaply in hope of a big payoff.
6.2 For Sellers
Iron Condors / Spreads: Collect premiums by selling options with defined risk. Effective in low-volatility environments.
Straddles / Strangles: Sell both calls and puts to benefit from time decay, but risky if the market moves sharply.
Scalping with Credit Spreads: Institutions often sell 0DTE spreads to collect small but consistent income.
6.3 Advanced
Gamma Scalping: Adjusting delta exposure dynamically as prices move.
Event Plays: Trading around economic announcements (Fed rate decisions, jobs data, RBI policy in India).
7. Psychology of Zero-Day Trading
Trading 0DTE options is as much about psychology as strategy:
Discipline: Entering and exiting trades quickly.
Risk Control: Position sizing is critical since losses can escalate rapidly.
Avoiding Addiction: The lottery-like thrill can lead to compulsive trading.
Emotional Balance: Traders must accept frequent small losses and avoid revenge trading.
8. Institutional vs. Retail Participation
Retail Traders: Generally buyers, attracted to low-cost “lottery” trades.
Institutions: Primarily sellers or hedgers, using spreads and systematic strategies. They often exploit retail demand.
This asymmetry explains why retail often loses money while institutions profit consistently.
9. Zero-Day Options in India
In India, the NSE (National Stock Exchange) has introduced same-day weekly options expiries for Nifty and Bank Nifty. Every day now has an expiry, mirroring the U.S. trend.
Retail participation has surged due to low premiums.
Brokers have reported record turnover in Bank Nifty 0DTE contracts.
Regulators are closely monitoring systemic risks.
This trend is reshaping intraday derivatives trading in India.
10. Criticism and Concerns
Market Stability Risks: Some analysts argue that widespread 0DTE trading increases volatility.
Retail Losses: Evidence suggests most small traders lose money due to poor risk management.
Speculative Nature: Critics compare it to gambling, given how quickly money can be lost.
Despite these concerns, exchanges continue to expand offerings due to high demand.
Conclusion
Zero-day option trading is one of the most exciting yet dangerous developments in modern financial markets. It has transformed options into ultra-short-term instruments, blending elements of speculation, hedging, and high-frequency trading. For disciplined traders who understand risk, 0DTE options offer powerful opportunities. For undisciplined traders, they can be financial landmines.
In summary:
They offer speed, leverage, and flexibility.
They come with extreme risks, especially for retail traders.
Their rise is reshaping both U.S. and Indian derivatives markets.
Ultimately, success in zero-day options lies in combining knowledge, strategy, and psychology—while never forgetting the golden rule of trading: preserve capital first, seek profits second.
Heritage Foods Ltd 1 Day ViewIntraday Price Levels
Moneycontrol reports:
Open: ₹470.00
High: ₹487.00
Low: ₹467.00
Previous Close: ₹470.00
Reuters indicates:
Range: ₹467.00 – ₹479.30
Previous Close: ₹470.05
Investing.com (Historical Data) shows for September 2, 2025:
Open: ₹470.00
High: ₹481.85
Low: ₹468.00
Close: ₹480.25 (~+2.18%)
Financial Express (Sector Snapshot):
Price: ₹481.00
Day Change: +₹10.95 (+2.33%)
What Does This Tell Us?
Overall Trend: Heritage Foods opened at ₹470 and traded higher throughout the day.
Intraday High: Between ₹479 to ₹487, depending on the source.
Intraday Low: Narrow, ranging from ₹467 to ₹468.
Close / Mid Range Level: Around ₹480–₹481, indicating a bullish closing range.
Volatility Range: Intraday movement spanned up to 20 points (~4%), showing decent trading activity.

Part 2 Master Candlestick PatternOptions in Global Markets
US Market: Options on stocks like Apple, Tesla, S&P500.
Europe: Eurex exchange trades DAX options.
India: NSE is Asia’s largest derivatives market.
Global options markets allow hedging and speculation across geographies.
The Psychology of Options Trading
Fear and greed dominate decisions.
Beginners often chase quick profits.
Professionals focus on probabilities, not predictions.
Patience and discipline are key.
Future of Options Trading
Increasing retail participation in India.
Weekly expiries, more instruments expected.
AI & Algo trading to dominate.
More global integration with India’s markets.

Part 1 Master Candlestick PatternOptions vs Stocks/Futures
Stocks: You own a part of the company.
Futures: Obligation to buy/sell in future.
Options: Right, but not obligation, with flexibility.
Common Mistakes by Beginners
Over-leveraging with big lots.
Only buying cheap OTM options.
Ignoring time decay.
Not using stop-loss.
Blindly copying tips without understanding.
Risk Management in Options
Never risk more than 2–5% of capital in one trade.
Use stop-loss orders.
Avoid holding losing options till expiry.
Use spreads to limit risk.
Keep emotions under control.

Part 2 Ride The Big MovesRisks & Rewards in Options Trading
Unlike stock trading, options have asymmetric risk-reward structures:
Option Buyers: Risk limited to premium paid, but potential profit can be unlimited (for calls) or large (for puts).
Option Sellers (Writers): Profit limited to premium received, but risk can be very high if the market moves sharply.
Hence, option writing is generally done by professional traders with high capital and hedging systems.
Option Trading in India
In India, options trading is regulated by SEBI and conducted on exchanges like NSE and BSE.
Lot Sizes: Options are traded in lots (e.g., Nifty = 50 units, Bank Nifty = 15 units).
Margins: Sellers must deposit margin with brokers to cover risk.
Expiry Cycle: Weekly (indices) and monthly (stocks).
Liquidity: Index options are most liquid (Nifty & Bank Nifty).

Part 2 Master Candlestick PatternKey Participants in the Options Market
The options market has a mix of participants:
Hedgers: Protect themselves from risks (institutions, exporters, investors).
Speculators: Try to profit from price moves (retail & professional traders).
Arbitrageurs: Exploit price inefficiencies between cash and derivatives.
Institutions & Banks: Use options for structured products and risk management.
How Options are Priced
Options are more complex than stocks because they have two value components:
Intrinsic Value = Difference between spot price and strike price (if profitable).
Time Value = Extra premium traders pay for the possibility of future moves.
The pricing is influenced by The Greeks:
Delta: Sensitivity of option price to underlying asset moves.
Theta: Time decay (options lose value as expiry nears).
Vega: Impact of volatility on option price.
Gamma: Rate of change of delta.
Understanding Greeks is essential for advanced option strategies.

Types of Market ParticipantsIntroduction
Financial markets are vast ecosystems where millions of transactions take place daily, involving buyers, sellers, intermediaries, regulators, and institutions. Each participant plays a unique role, and together, they form the lifeblood of the global economy. Just like any well-functioning system, financial markets rely on a diverse group of actors whose motives range from profit-making, hedging risks, raising capital, or ensuring stability and liquidity.
In simple terms, market participants are all the individuals, institutions, and entities that engage in trading financial instruments—stocks, bonds, derivatives, currencies, commodities, and more. Their presence ensures that markets remain liquid, efficient, and capable of transmitting signals about economic health.
Understanding the types of market participants is essential for traders, investors, policymakers, and students of finance. Different participants bring different motivations and strategies: while some seek long-term value, others look for short-term profits; while some provide regulation and order, others bring in liquidity. This dynamic interaction creates both opportunities and risks in markets.
This article provides a comprehensive exploration of the various types of market participants, categorized based on their roles, objectives, and influence.
Broad Categories of Market Participants
Before diving deep, let’s break down the broad categories:
Individual Investors / Retail Participants
Institutional Investors
Market Intermediaries (Brokers, Dealers, Exchanges, etc.)
Hedgers and Arbitrageurs
Speculators and Traders
Regulators and Policymakers
Issuers (Corporates and Governments)
Foreign Investors and Global Participants
High-Frequency Traders and Algorithmic Players
Market Makers and Liquidity Providers
Now, let’s discuss each in detail.
1. Individual Investors (Retail Participants)
Retail investors are individuals investing their personal funds in financial markets. They usually trade smaller amounts compared to institutions, but collectively they represent a massive pool of capital.
Characteristics of Retail Investors:
Use their own money (not pooled funds).
Investment horizon varies (short-term, medium-term, long-term).
Motivated by wealth creation, savings growth, retirement planning.
Increasingly influenced by technology (mobile apps, online trading platforms).
Types of Retail Investors:
Active traders: Regularly buy and sell securities for quick gains.
Passive investors: Prefer long-term investments like index funds or mutual funds.
Speculative retail investors: Engage in options, futures, and cryptocurrencies.
Role in the Market:
Retail investors enhance liquidity, provide diversity of opinion, and influence sentiment-driven movements. However, they are often more vulnerable to volatility and herd behavior.
2. Institutional Investors
Institutional investors are large organizations that invest on behalf of others. They have access to substantial capital, advanced research, and professional expertise.
Types of Institutional Investors:
Mutual Funds: Pool money from many investors to invest in diversified portfolios.
Pension Funds: Manage retirement savings and invest for long-term returns.
Insurance Companies: Invest premiums collected from policyholders to earn returns.
Sovereign Wealth Funds (SWFs): State-owned funds that invest national reserves.
Endowments and Foundations: Manage funds for universities, NGOs, and charities.
Characteristics:
Hold significant influence over markets.
Long-term investment horizon, though some engage in active trading.
Often considered more stable than retail investors.
Role in the Market:
Institutional investors are stabilizers of financial markets due to their deep pockets and diversified holdings. However, their concentrated moves can create big shifts in asset prices.
3. Market Intermediaries
Market intermediaries are the connectors that facilitate transactions. Without them, buyers and sellers would struggle to find each other efficiently.
Types of Intermediaries:
Stockbrokers: Act as agents executing trades on behalf of clients.
Dealers: Trade securities for their own accounts and provide liquidity.
Exchanges: Platforms like NSE, BSE, NYSE, NASDAQ, which match buyers and sellers.
Clearinghouses: Ensure settlement of trades and manage counterparty risk.
Depositories: Safekeep securities in electronic form (e.g., NSDL, CDSL in India).
Investment Banks: Help companies raise capital via IPOs, debt issues, mergers, and acquisitions.
Role in the Market:
Intermediaries ensure market efficiency, transparency, and liquidity. They are essential in maintaining trust and smooth functioning.
4. Hedgers
Hedgers are participants who enter markets primarily to reduce risk exposure. They are not focused on profit-making from price changes but on safeguarding their core business or portfolio.
Examples:
A farmer using futures contracts to lock in crop prices.
An airline hedging against fuel price volatility.
An investor using options to protect a stock portfolio from downturns.
Role in the Market:
Hedgers bring stability by offsetting risks. Their activity increases demand for derivative instruments and makes markets more complete.
5. Speculators and Traders
Speculators take on risk in pursuit of profit. Unlike hedgers, they actively seek to benefit from price fluctuations.
Types of Traders:
Day Traders: Buy and sell securities within the same day.
Swing Traders: Hold positions for days/weeks to capture short-term trends.
Position Traders: Hold longer-term bets based on fundamental analysis.
Options/Futures Traders: Engage in derivatives for leverage and profit opportunities.
Role in the Market:
Speculators add liquidity and price discovery. They take risks that others (hedgers) want to avoid. However, excessive speculation can increase volatility.
6. Arbitrageurs
Arbitrageurs exploit price differences of the same asset in different markets.
Examples:
Buying a stock on NSE while simultaneously selling it on BSE if there’s a price gap.
Using currency arbitrage in Forex markets.
Exploiting futures-spot price differences.
Role in the Market:
Arbitrageurs eliminate pricing inefficiencies, keeping markets aligned and fair. They are critical to maintaining balance.
7. Regulators and Policymakers
Markets cannot function smoothly without oversight. Regulators set the rules, monitor activities, and prevent malpractice.
Examples:
SEBI (India): Securities and Exchange Board of India.
SEC (USA): Securities and Exchange Commission.
RBI (India): Regulates currency and banking markets.
CFTC (USA): Commodity Futures Trading Commission.
Roles of Regulators:
Protect investors.
Ensure transparency and fair play.
Prevent frauds, insider trading, and market manipulation.
Stabilize markets during crises.
8. Issuers (Corporates and Governments)
Issuers are entities that raise capital from markets by issuing securities.
Types:
Corporates: Issue equity (shares) or debt (bonds, debentures) to fund growth.
Governments: Issue bonds and treasury bills to finance expenditure.
Municipalities: Issue municipal bonds for infrastructure projects.
Role in the Market:
Issuers are the suppliers of investment products. Without them, there would be nothing to trade.
9. Foreign Investors and Global Participants
Globalization has turned local markets into international ones.
Types:
Foreign Institutional Investors (FIIs): Large funds investing in emerging markets.
Foreign Portfolio Investors (FPIs): Individuals or institutions buying foreign stocks/bonds.
Multinational Corporations: Investing cross-border for expansion.
Role:
Foreign investors bring in capital, liquidity, and global integration, but also add volatility when they withdraw funds during crises.
10. High-Frequency Traders (HFTs) and Algorithmic Participants
With technology, machines are now major participants.
Characteristics:
Use algorithms and superfast systems.
Trade thousands of times in milliseconds.
Seek to exploit micro-price differences.
Role:
HFTs improve liquidity and tighten bid-ask spreads but raise concerns about flash crashes and systemic risks.
Conclusion
The financial market is not just about numbers and charts—it is about participants with diverse objectives interacting to create opportunities, manage risks, and allocate resources. From retail investors saving for retirement to sovereign wealth funds shaping national strategies, from hedgers protecting against volatility to high-frequency traders running algorithms at lightning speed—each plays a vital role.
A proper understanding of types of market participants gives clarity about how markets work, why they move the way they do, and how risks and rewards are distributed. Just like a symphony requires different instruments, financial markets require this variety of participants to function harmoniously.
Option Trading Advanced Options Strategies
Professional traders use combinations for specific market conditions.
Butterfly Spread
Outlook: Neutral, low volatility.
How it works: Combination of bull and bear spreads with three strikes.
Risk/Reward: Limited both ways.
Calendar Spread
Outlook: Neutral with time decay advantage.
How it works: Sell near-term option, buy longer-term option (same strike).
Benefit: Profit from faster time decay of short option.
Ratio Spread
Outlook: Directional but with twist.
How it works: Buy one option and sell more options of the same type.
Risk: Potentially unlimited.
Reward: Limited to premium collected.
Collar Strategy
Outlook: Hedge with limited upside.
How it works: Own stock, buy protective put, sell covered call.
Use: Lock in gains, reduce downside.
Risk Management in Options Trading
Options carry significant risks if misused. Successful traders emphasize:
Position Sizing: Never risk too much on one trade.
Diversification: Spread across multiple strategies/assets.
Stop-Loss & Adjustments: Exit losing trades early.
Implied Volatility (IV) Awareness: High IV increases premiums; selling strategies may be better.

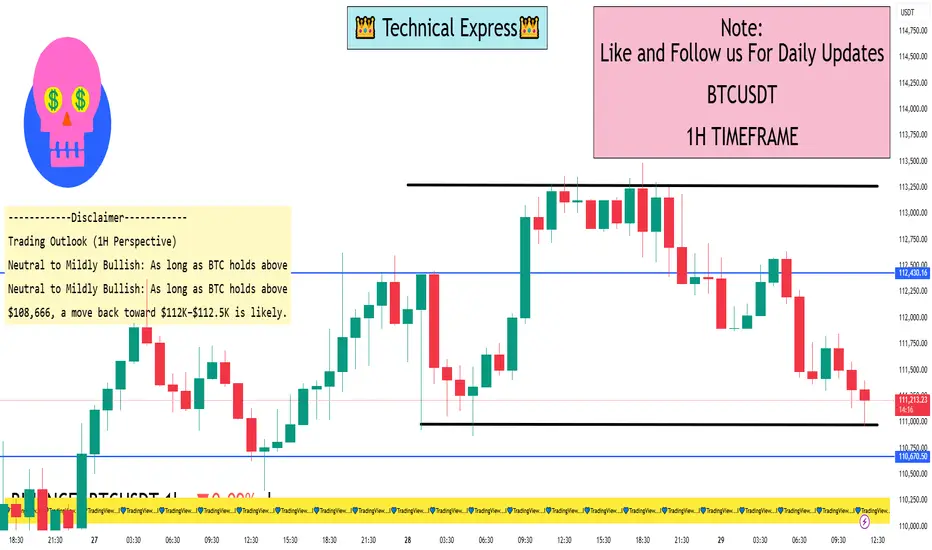
BTC/USDT 1 Hour View1-Hour Technical Snapshot
Key Levels
Support Zones:
~$110,000–$110,600 — viewed as a critical short-term support / demand area. It’s where BTC could stabilize if the current slide continues
~$108,666 — a deeper support level; a break below this risks a pullback toward $101,000, near the 200-day moving average
Resistance Zones:
~$112,000–$112,500 — a key resistance or supply area, with potential selling pressure around this range
~$124,474 — the recent monthly closing high and psychologically significant level; clearing this would be a strong bullish confirmation
Market Sentiment & Setup
Bullish Case: BTC sitting near $111,600 is seen by some analysts as a potential entry zone for a bullish continuation pattern (like a bull flag). A break above $115,544 (20-day SMA) could fuel a push toward $125,000
Bearish Risk: If $108,666 support fails, the risk is for a deeper drop toward $101,000, negating the bullish setup
Other indicator-based technical analysis tools (like TradingView’s technical summary) reflect a neutral bias on 1H charts, while longer-term timeframes lean more bullish
Trading Psychology & DisciplineIntroduction
In the world of financial markets, traders often focus on technical analysis, fundamental research, algorithms, and news-driven events to make decisions. While these tools are essential, there is one element that is frequently underestimated yet plays a much bigger role in success: trading psychology and discipline.
Trading is not just about numbers, charts, or strategies—it is a game of emotions, mindset, and self-control. Even the most sophisticated strategies fail if the trader cannot control fear, greed, and impulsive behavior. On the other hand, an average trading system can become profitable in the hands of a disciplined and emotionally balanced trader.
This discussion will explore the psychological aspects of trading, the emotional challenges, common behavioral biases, and how discipline can transform a trader’s performance. We’ll also look at techniques and practices to build a resilient trading mindset.
1. The Role of Psychology in Trading
Trading psychology refers to the emotions and mental state that influence how traders make decisions in the market. Unlike professions where skills and experience directly translate into results, trading is unique because psychological factors often override logic.
For example:
A trader may have a solid strategy to exit a position at a 10% profit. But when the time comes, greed makes them hold longer, hoping for more, and the market reverses.
Another trader may see a perfect setup but doesn’t enter the trade because of fear after a previous loss.
This illustrates that psychology can either support or sabotage trading success. Research shows that 80–90% of retail traders lose money consistently—not always because of poor strategies, but due to a lack of discipline and emotional control.
2. Key Emotional Challenges in Trading
Let’s examine the major psychological challenges that traders face.
a) Fear
Fear is the most dominant emotion in trading. It manifests in different ways:
Fear of losing money (not taking a trade).
Fear of missing out (FOMO—jumping into a trade too late).
Fear of being wrong (holding on to losing positions).
Fear often leads to hesitation, early exits, or missed opportunities.
b) Greed
Greed drives traders to:
Overstay in profitable trades.
Over-leverage positions.
Overtrade (taking too many trades in a day).
While the market rewards patience, greed often blinds judgment.
c) Hope
Many traders fall into the trap of hope, especially with losing trades. Instead of cutting losses, they keep hoping the market will reverse in their favor. Hope replaces rational decision-making.
d) Revenge Trading
After a loss, traders sometimes feel the need to recover money immediately. This leads to impulsive trades without proper setups—often resulting in bigger losses.
e) Overconfidence
Success can be as dangerous as failure. After a winning streak, traders may become overconfident, take unnecessary risks, or abandon risk management—leading to devastating drawdowns.
3. Behavioral Biases in Trading
Trading psychology overlaps with behavioral finance, where human biases cloud rational thinking. Some common biases include:
Loss Aversion Bias – The pain of loss is psychologically stronger than the pleasure of gain. Traders avoid booking small losses, leading to bigger ones.
Confirmation Bias – Traders look only for information that supports their trade idea, ignoring opposing signals.
Anchoring Bias – Traders anchor to a certain price level (like the price they bought at) and refuse to sell below it.
Herd Mentality – Following the crowd without analysis, often during market bubbles.
Recency Bias – Giving more weight to recent outcomes rather than long-term performance.
These biases affect judgment and lead to poor decision-making.
4. The Importance of Discipline in Trading
If psychology is the foundation, discipline is the structure that holds a trader’s career together. Discipline in trading means sticking to rules, risk management, and strategies regardless of emotions.
A disciplined trader:
Enters trades only when rules align.
Exits trades at predefined stop-loss or target levels.
Maintains position sizing regardless of emotions.
Accepts losses as part of the business.
Avoids impulsive and revenge trading.
Discipline converts trading from gambling into a professional business.
5. The Mindset of a Successful Trader
Professional traders think differently from amateurs. They focus on process over outcome. Their mindset includes:
Probability Thinking
No trade is guaranteed. Each trade is just one outcome in a series of probabilities. Accepting this reduces emotional pressure.
Detachment from Money
Professionals see money as a tool, not an emotional anchor. They measure success in terms of following their plan, not short-term profits.
Adaptability
Markets change constantly. Disciplined traders adapt rather than stubbornly sticking to failing strategies.
Patience
They wait for high-probability setups rather than forcing trades.
Long-term Focus
Success is measured in months and years, not a single trade.
6. Building Trading Discipline
Discipline is not automatic—it requires conscious practice. Here’s how traders can develop it:
a) Create a Trading Plan
A trading plan defines:
Entry and exit rules.
Position sizing.
Risk-reward ratios.
Markets and timeframes to trade.
Maximum daily/weekly losses.
Without a plan, emotions take over.
b) Use Risk Management
Risk per trade should never exceed 1–2% of capital. Stop-loss orders should be predefined. This ensures survival even during losing streaks.
c) Keep a Trading Journal
A journal helps track:
Why you entered a trade.
Emotions felt during the trade.
What went right/wrong.
Over time, patterns emerge, revealing weaknesses in psychology and strategy.
d) Practice Mindfulness
Mindfulness techniques such as meditation, deep breathing, or visualization help traders stay calm during stressful market conditions.
e) Accept Losses as Normal
Even the best traders lose frequently. What matters is keeping losses small and letting winners run. Accepting losses removes emotional baggage.
f) Avoid Overtrading
Set daily/weekly limits on trades. This prevents emotional exhaustion and impulsive decisions.
7. Practical Techniques to Improve Trading Psychology
Here are actionable steps:
Pre-Market Routine – Spend 10–15 minutes visualizing scenarios, checking news, and calming the mind.
Set Daily Goals – Focus on execution (e.g., “Follow my plan”) rather than monetary goals.
Take Breaks – Step away after a loss or win streak to reset emotionally.
Limit Screen Time – Over-monitoring leads to anxiety. Check setups at predefined times.
Simulation/Backtesting – Helps build confidence in a system before using real money.
Accountability Partner – Sharing trades with another trader builds discipline.
8. Case Studies: Trading Psychology in Action
Case 1: The Fearful Trader
A new trader avoids trades after a big loss. Despite seeing good setups, fear paralyzes action. Over time, opportunities are missed, and frustration builds.
Lesson: Risk management and small position sizing reduce fear.
Case 2: The Greedy Trader
Another trader doubles account quickly during a bull run, but refuses to book profits. Overconfidence leads to leverage, and one market crash wipes out everything.
Lesson: Discipline and humility are essential.
Case 3: The Disciplined Trader
A professional trader takes 40% win rate trades but manages risk with 1:3 reward ratios. Despite losing more trades than winning, account grows steadily.
Lesson: Discipline beats emotions.
9. The Role of Technology and Psychology
Modern trading platforms provide tools like:
Automated trading systems – Reduce emotional interference.
Alerts and stop-loss automation – Enforce discipline.
Analytics dashboards – Help track performance.
But even with technology, psychology remains the deciding factor, since traders often override systems when emotions take over.
10. Long-Term Development of Trading Mindset
Trading psychology is not built overnight. It requires years of consistent practice. Key long-term practices include:
Reading trading psychology books (e.g., Trading in the Zone by Mark Douglas).
Engaging in regular self-reflection.
Accepting that markets are uncertain.
Developing resilience to handle both drawdowns and success.
The goal is to become a trader who is calm in chaos, rational under stress, and disciplined under temptation.
Conclusion
Trading psychology and discipline are the invisible forces behind every successful trader. Strategies and indicators provide the “how,” but psychology answers the “why” and “when.”
Fear, greed, and biases sabotage results.
Discipline enforces consistency and professionalism.
A strong trading mindset focuses on probabilities, risk management, and patience.
Ultimately, trading is not a battle with the market—it is a battle with oneself. Mastering psychology and discipline transforms trading from an emotional rollercoaster into a structured, profitable business.
As the saying goes:
“In trading, your mind is your greatest asset—or your biggest enemy. The choice is yours.”

Part 1 Master Candlestick PatternOptions in the Indian Stock Market
In India, options trading is booming, especially in:
Nifty & Bank Nifty (Index options).
Stock Options (Reliance, TCS, HDFC Bank, etc.).
👉 Interesting fact: Over 90% of trading volume in NSE comes from options today.
Expiry days (Thursdays for weekly index options) see massive action, as traders bet on final movements.
The Power of Weekly Options
Earlier, only monthly options were available. Now NSE has weekly expiries for Nifty, Bank Nifty, and even stocks.
Weekly options = cheaper premiums.
Traders use them for intraday or short-term bets.
But time decay is very fast.

Part 2 Ride The Big MovesIntroduction to Options Trading
When people think about the stock market, they usually think about buying and selling shares. But there’s another side of the market that’s both exciting and complex—derivatives trading.
An option is one such derivative. Instead of directly buying a share, you buy a contract that gives you the right (but not the obligation) to buy or sell the share at a certain price within a certain time.
Sounds interesting? Let’s make it simple with an analogy.
👉 Imagine you’re interested in buying a car priced at ₹10 lakh. But you’re not sure if you’ll have the money or if the price will change in the future. The dealer says:
Pay me ₹10,000 now, and I’ll give you the right to buy the car at ₹10 lakh anytime in the next three months.
If car prices rise to ₹11 lakh, you can still buy at ₹10 lakh and save ₹1 lakh.
If prices fall to ₹9 lakh, you can simply let the contract expire and lose only your ₹10,000 advance.
This advance is like the option premium, and the contract is your option.
That’s the essence of options trading—buying rights, not obligations.
Basics of Options
Options are broadly of two types:
Call Option (CE) → Right to buy an asset at a fixed price before expiry.
Put Option (PE) → Right to sell an asset at a fixed price before expiry.
Example:
Call Option: You buy a Reliance 2500 CE (Call Option) at a premium of ₹50.
If Reliance rises to ₹2600, you can still buy it at ₹2500 and gain ₹100 (minus premium).
If Reliance falls to ₹2400, you won’t exercise it and lose only ₹50.
Put Option: You buy a Reliance 2500 PE at a premium of ₹40.
If Reliance falls to ₹2400, you can sell at ₹2500 (gain ₹100).
If Reliance rises to ₹2600, you won’t exercise it and lose only ₹40.
This is why options are considered insurance tools in markets.

F&O Trading & SEBI Regulations1. Introduction
The Indian stock market has seen remarkable growth over the last few decades, and one of the most fascinating areas of this growth has been in derivatives trading. Derivatives are financial instruments that derive their value from an underlying asset, and in India, the most widely traded derivatives are Futures and Options (F&O).
F&O trading allows investors and traders to participate in the price movement of stocks, indices, and commodities without necessarily owning them. It provides opportunities to hedge risks, speculate, and arbitrage.
However, with great power comes great responsibility. The Securities and Exchange Board of India (SEBI)—the market regulator—plays a crucial role in ensuring that F&O trading does not turn into a high-risk gamble for unsuspecting investors. SEBI lays down strict rules and guidelines to maintain market integrity, protect investors, and reduce systemic risks.
This article will give you a comprehensive understanding of F&O trading and SEBI’s regulations governing it.
2. Understanding Derivatives
Before diving into F&O, let’s clarify what derivatives are.
A derivative is a financial contract whose value depends on the performance of an underlying asset. In India, the underlying assets include:
Equity shares (like Reliance, Infosys, HDFC Bank)
Stock indices (like Nifty 50, Bank Nifty)
Commodities (like gold, crude oil)
Currencies (like USD/INR)
Types of derivatives:
Forwards – Customized contracts between two parties, traded over-the-counter (OTC).
Futures – Standardized contracts traded on exchanges like NSE & BSE.
Options – Contracts that give the right, but not the obligation, to buy or sell an asset.
Swaps – Mostly used in currency and interest rate markets.
In India, Futures and Options are the most liquid and popular derivative instruments, especially in the stock market.
3. What is F&O Trading?
3.1 Futures
A Futures contract is an agreement to buy or sell an underlying asset at a predetermined price on a specific date in the future.
Example: If you buy Nifty Futures at 20,000 today, you are betting that Nifty will be above 20,000 on the expiry date.
If Nifty rises to 20,500, you make a profit.
If Nifty falls to 19,500, you incur a loss.
3.2 Options
An Options contract gives the buyer the right but not the obligation to buy or sell the underlying asset at a predetermined price.
Two types of options:
Call Option (CE): Right to buy.
Put Option (PE): Right to sell.
Example:
If you buy Reliance Call Option at ₹2,500 strike, you profit if Reliance moves above ₹2,500.
If you buy Reliance Put Option at ₹2,500 strike, you profit if Reliance falls below ₹2,500.
Options also have premium, strike price, and expiry terms.
3.3 Why do people trade F&O?
Hedging: Protecting investments from adverse price movements.
Speculation: Betting on price movements for profit.
Arbitrage: Exploiting price differences between markets.
Leverage: Controlling large positions with small capital.
4. Growth of F&O Trading in India
The Indian F&O market has grown tremendously since it was introduced in 2000. NSE and BSE both offer equity derivatives, but NSE has emerged as the dominant player.
Key reasons for popularity:
High liquidity in index derivatives like Nifty 50 & Bank Nifty.
Opportunity for intraday traders to capture price swings.
Low margin requirements compared to cash market.
Availability of weekly options.
However, SEBI has also noticed risks—especially from retail investors treating F&O like gambling, leading to heavy losses. Reports show that nearly 9 out of 10 retail traders lose money in F&O trading.
This has pushed SEBI to tighten regulations.
5. SEBI’s Role in Regulating F&O
The Securities and Exchange Board of India (SEBI) is the watchdog of Indian financial markets. Its mission is to:
Protect investor interests.
Promote fair and efficient markets.
Regulate intermediaries and stock exchanges.
Minimize systemic risks.
For F&O trading, SEBI has set strict rules, margins, disclosures, and eligibility criteria.
6. SEBI Regulations on F&O Trading
Let’s explore the major regulations SEBI has imposed:
6.1 Eligibility of Stocks for Derivatives
Not all stocks can be traded in F&O. To qualify:
The stock must have a minimum market capitalization of ₹5,000 crore.
Average daily traded value should be high.
Adequate liquidity must exist.
Price band restrictions and surveillance mechanisms should be applicable.
This ensures that only liquid and stable stocks are allowed in F&O.
6.2 Contract Specifications
SEBI mandates standardization of contracts:
Lot size: Minimum notional value (₹5-10 lakhs).
Expiry: Monthly & weekly expiries.
Strike intervals: Based on stock/index price range.
Tick size: ₹0.05 for equity derivatives.
This standardization prevents manipulation.
6.3 Margin Requirements
Margins are crucial in derivatives as they are leveraged products.
Types of margins:
SPAN Margin – Based on risk of position.
Exposure Margin – Additional buffer.
Premium Margin – For option buyers.
Mark-to-Market (MTM) Margin – Daily settlement of gains/losses.
This ensures that traders have skin in the game and cannot default.
6.4 Risk Mitigation Measures
Daily price bands for stocks in derivatives.
Position limits for clients, members, and FIIs.
Ban periods for stocks crossing OI (Open Interest) limits.
Intraday monitoring of margins and positions.
6.5 Disclosure Requirements
Brokers must give risk disclosure documents before enabling F&O trading.
Investors must sign an agreement acknowledging risks.
Margin details and exposure reports are sent via SMS/email daily.
6.6 Segregation of Clients’ Funds
Brokers must segregate their own funds from clients’ funds. Misuse of client collateral is strictly prohibited.
6.7 Investor Protection & Education
SEBI regularly issues advisories warning retail traders about F&O risks.
Investor education campaigns (e.g., “Options are not lottery tickets”).
Free online resources for risk management.
7. SEBI’s New Regulations (Recent Developments)
In the last few years, SEBI has tightened norms further:
Peak Margin Reporting (2021):
Traders must maintain full margin upfront.
No more leveraging via intraday tricks.
Intraday Leverage Ban (2022):
Brokers cannot offer more than 20% margin funding.
This reduced excessive speculation.
Increased Disclosure of F&O Risks (2023-24):
Exchanges must display warnings showing percentage of retail traders losing money.
Eligibility Tightening (2023):
SEBI proposed reviewing stocks in derivatives regularly. Illiquid stocks may be excluded.
Investor Suitability Check (2024 Proposal):
Only financially literate and risk-capable investors may be allowed in F&O in future.
8. Benefits of SEBI Regulations
Market Stability: Prevents manipulation and speculation bubbles.
Investor Protection: Safeguards retail traders from blind gambling.
Transparency: Standardized contracts and disclosure norms.
Risk Management: Margins and limits reduce systemic collapse.
Trust in Markets: Encourages more participation in regulated environment.
9. Challenges & Criticisms
Despite SEBI’s efforts, challenges remain:
Retail Traders’ Losses: Majority still lose money due to lack of knowledge.
Over-regulation Concerns: Some argue SEBI rules reduce liquidity.
Complexity: F&O remains difficult for beginners despite regulations.
Broker Malpractices: Some brokers mis-sell options strategies to clients.
Speculative Craze: Many traders treat weekly options like gambling.
10. Future of F&O Trading in India
Looking ahead:
F&O will remain the largest contributor to market volumes.
SEBI may bring financial literacy tests before allowing retail traders.
More focus on institutional participation and reducing retail over-exposure.
Increased use of AI-driven surveillance to detect manipulation.
Potential restrictions on weekly options if speculation rises.
Conclusion
Futures and Options trading is an exciting and powerful tool in the financial markets, offering opportunities for hedging, speculation, and arbitrage. But it is also risky, especially for retail investors without proper knowledge and discipline.
The Securities and Exchange Board of India (SEBI) plays a vital role in ensuring that F&O trading remains fair, transparent, and not a casino for retail investors. Its regulations on eligibility, margins, disclosures, and risk management are designed to create a balance between freedom and protection.
As India’s capital markets continue to grow, SEBI’s regulations will evolve further. Traders must remember that regulations are not restrictions but safeguards—helping ensure that markets grow sustainably while protecting investors.
The future of F&O in India is bright, but only if traders approach it with knowledge, discipline, and respect for risk management.

Part 4 Trading Master ClassOptions Premium – How Price is Decided?
The premium (cost of option) depends on:
Intrinsic Value → The real value of option (difference between current price & strike price).
Time Value → More time till expiry = higher premium.
Volatility → If market is volatile, premium is high because chances of big move increase.
Interest Rates & Dividends → Minor effect.
👉 Example:
Reliance = ₹2,600.
Call Option 2,500 Strike = Intrinsic Value = ₹100.
Premium charged = ₹120 (extra ₹20 is time value).
Moneyness of Options
Options are classified as:
In the Money (ITM) → Option already has profit potential.
At the Money (ATM) → Option strike = Current price.
Out of the Money (OTM) → Option has no intrinsic value (only time value).
👉 Example (Stock at ₹500):
Call 480 = ITM.
Call 500 = ATM.
Call 520 = OTM.
