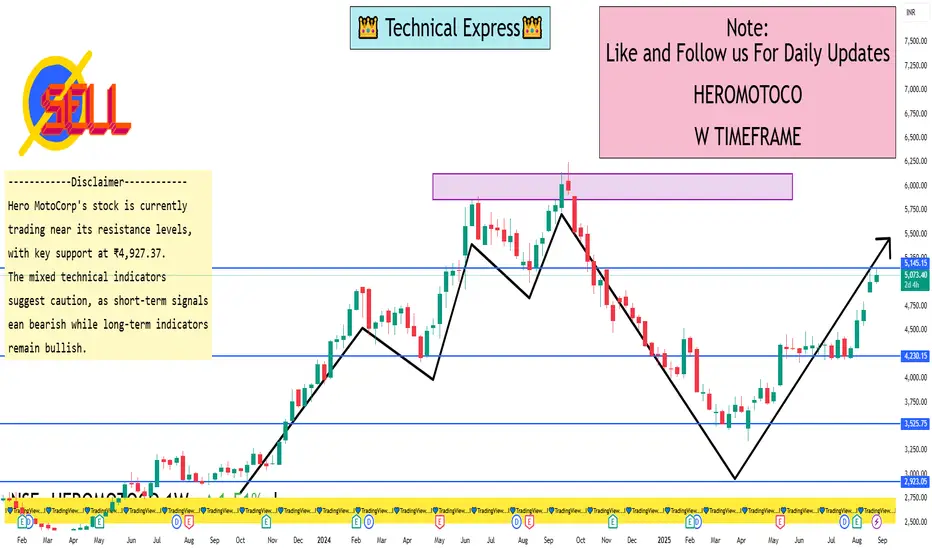
Heromotoco Ltd 1 Week ViewWeekly Support & Resistance Levels
Immediate Support: ₹4,927.37
Primary Support: ₹4,683.00
Immediate Resistance: ₹5,039.60
Primary Resistance: ₹5,216.60
These levels are derived from standard pivot point calculations and can serve as potential zones where the stock might experience buying or selling pressure.
Technical Indicators
Relative Strength Index (RSI): 67.39 – Neutral
MACD: 201.20 – Sell
Stochastic RSI: 89.90 – Sell
Moving Averages:
5-day: ₹5,066.46 – Sell
20-day: ₹4,624.92 – Buy
50-day: ₹4,408.96 – Buy
200-day: ₹4,125.66 – Buy
The overall technical outlook is mixed, with short-term indicators showing a sell signal and longer-term indicators indicating a buy.
Teslamotors
Part 2 Master Candlestick PatternDisadvantages of Options
Complexity for beginners
Time decay risk (premium can vanish)
Unlimited risk for sellers of uncovered options
Requires active monitoring for effective trading
Tips for Successful Options Trading
Understand the underlying asset thoroughly.
Start with basic strategies like long calls, puts, and covered calls.
Use proper risk management and position sizing.
Keep track of Greeks to understand sensitivity.
Avoid over-leveraging.
Monitor market volatility; high volatility can inflate premiums.
Use demo accounts or paper trading for practice.

Part 4 Learn Institutional Trading Advanced Strategies
Straddle: Buy a call and a put at the same strike and expiry to profit from volatility.
Strangle: Buy OTM call and put for cheaper volatility bets.
Spread Strategies: Combine multiple calls or puts to limit risk and reward:
Bull Call Spread: Buy call at lower strike, sell call at higher strike.
Bear Put Spread: Buy put at higher strike, sell put at lower strike.
Iron Condor: Combine calls and puts to profit from low volatility.
Butterfly Spread: Profit from minimal movement around a central strike.
Pricing of Options
Option pricing is influenced by several factors:
Intrinsic Value
The real value if exercised today.
Call option IV = Max(Current Price – Strike, 0)
Put option IV = Max(Strike – Current Price, 0)
Time Value
Extra premium due to time until expiration.
TV = Option Premium – Intrinsic Value

Part 2 Support and ResistanceWhy Trade Options? (Advantages)
Leverage: Small capital controls big positions.
Hedging: Protect stock portfolio from losses.
Flexibility: Profit in bullish, bearish, or sideways markets.
Income: Selling options generates consistent premiums.
Risk Control: Losses can be predefined by structuring trades.
8. Risks of Options Trading
Time Decay (Theta): Options lose value as expiration approaches.
Liquidity Risk: Not all options are actively traded.
Complexity: Strategies can be difficult for beginners.
Unlimited Risk (for sellers): Selling naked calls can wipe out capital.
Over-leverage: Small margin requirements may encourage oversized positions.

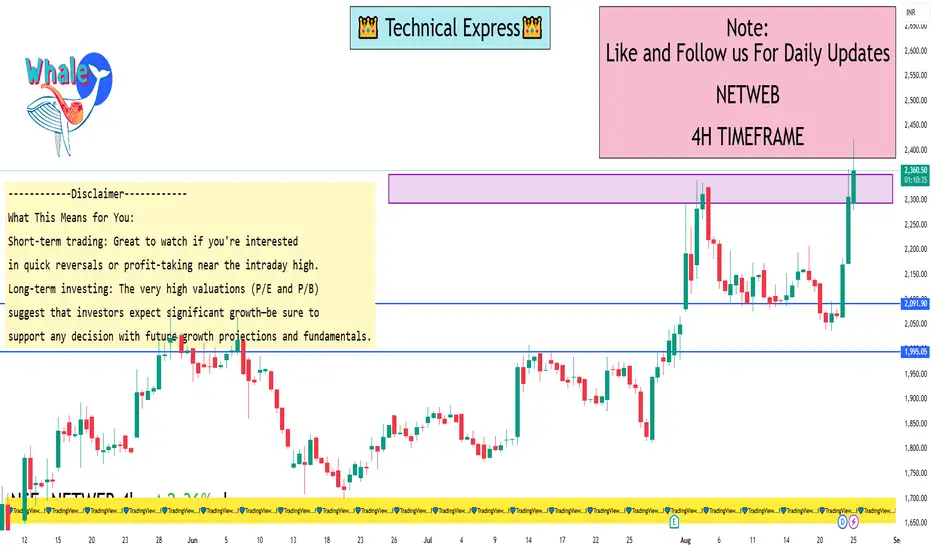
NETWEB Tech India 1 Day ViewIntraday Snapshot as of August 25, 2025:
Current Price: ₹2,353.00
Previous Close: ₹2,322.40
Day’s Range: ₹2,280.60 to ₹2,423.90
Key Refreshers on Today’s Movement:
The stock is trading slightly higher than yesterday’s closing price, signaling a modest intraday gain.
The intra-day high of ₹2,423.90 indicates a strong session, though it hasn't crossed the 52-week high of ₹3,060.
Additional Key Metrics (As of August 25, 2025):
P/E (TTM): ~114.94
P/B Ratio: ~24.8
Indicative of a richly valued stock—priced at a premium compared to industry averages.
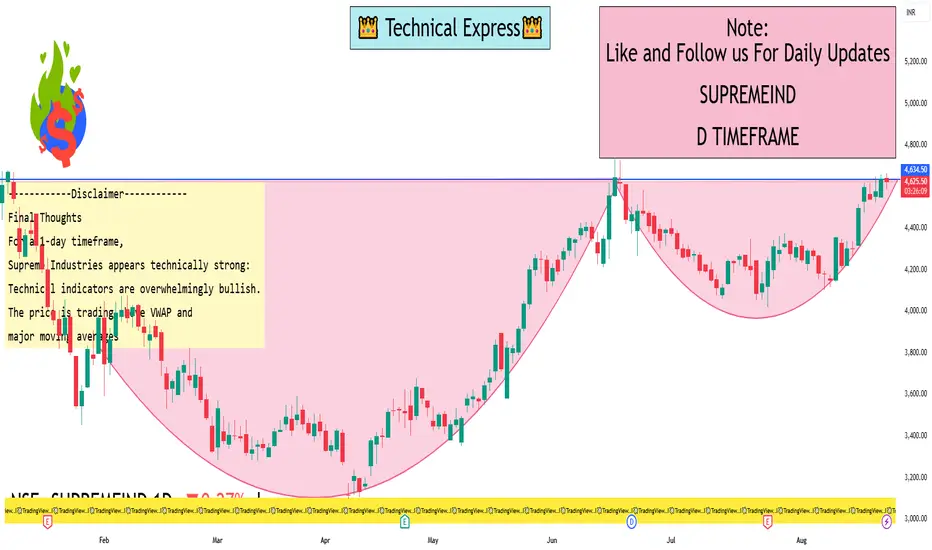
Supreme Industries 1 Day View1-Day Technical Overview
Consensus Ratings
TradingView signals a Buy rating for today, with a Strong Buy for the 1-week timeframe
Investing.com offers a robust Strong Buy across multiple timeframes (30 min, hourly, daily, weekly, and monthly)
Similarly, another Investing.com source reiterates: Strong Buy on both moving averages (12:0 buy:sell) and technical indicators (9:0)
Indicator Highlights (as of Aug 25, 2025)
RSI (14): 68.5 — indicates bullish momentum, nearing overbought territory
MACD, ADX, CCI, ROC, Ultimate Oscillator, Bull/Bear Power: All show Buy signals. Williams %R and StochRSI suggest Overbought
Moving Averages (Simple & Exponential): All tracked periods (5, 10, 20, 50, 100, 200) yield Buy signals
1-Day Price & Market Context
Latest stock price sits around ₹4,652–4,664, with intraday highs near ₹4,664.90 and lows round ₹4,586
VWAP (intraday volume-weighted average price) stands at approximately ₹4,634–4,636, suggesting current trading is slightly above average price levels
How to Read Price ActionIntroduction
Price Action (PA) is the art and science of reading market movement directly from price charts, without over-reliance on lagging indicators. Professional traders, institutional players, and prop firms often emphasize price action because it reflects the pure psychology of buyers and sellers.
Unlike trading based on technical indicators, price action trading relies on raw market data: candlesticks, support & resistance levels, chart structures, and volume context.
Learning to read price action is like learning a new language — once you master it, you can understand what the market is saying at any given moment.
Chapter 1: What is Price Action?
Price Action refers to analyzing the actual price movement of a financial instrument over time.
It does not depend on moving averages, oscillators, or complex indicators.
It studies patterns, trends, support/resistance zones, candlestick formations, and order flow behavior.
The ultimate goal is to understand the story behind each price move: who is in control (buyers or sellers), and where the next move might head.
Key Idea: Price action is the footprint of money. When large institutions buy or sell, they leave traces on the chart — PA traders learn to read these footprints.
Chapter 2: Why Read Price Action?
Clarity – It removes clutter from charts.
Universal Language – Works across all markets (stocks, forex, commodities, crypto).
Flexibility – Adapts to all timeframes, from scalping 1-min charts to investing on weekly charts.
Real-Time Decisions – Price action reacts instantly, unlike lagging indicators.
Psychology-Based – Helps traders understand market sentiment: fear, greed, indecision.
Chapter 3: Core Building Blocks of Price Action
Before diving into strategies, you need to master the foundations:
3.1 Candlesticks
Candlesticks are the backbone of price action. Each candle tells a story:
Open, High, Low, Close (OHLC) show how price moved within that time frame.
Long wicks = rejection.
Long body = strong momentum.
Small body = indecision.
3.2 Market Structure
Higher Highs & Higher Lows (HH, HL) = Uptrend.
Lower Highs & Lower Lows (LH, LL) = Downtrend.
Sideways movement = Consolidation.
3.3 Support and Resistance (S/R)
Support: A price level where buying pressure often appears.
Resistance: A price level where selling pressure often emerges.
These zones are not exact prices, but areas.
3.4 Trendlines & Channels
Connecting swing highs/lows creates visual guides.
Channels highlight when price is moving within a range.
3.5 Volume (Optional but Powerful)
Volume confirms price moves — high volume validates breakouts, while low volume signals weak trends.
Chapter 4: Candlestick Price Action Patterns
4.1 Reversal Patterns
Pin Bar (Hammer, Shooting Star): Signals rejection at support/resistance.
Engulfing Candle: Strong shift in momentum (bullish or bearish).
Morning Star / Evening Star: Trend reversal confirmation.
4.2 Continuation Patterns
Inside Bar: Market is pausing; breakout is likely.
Flag & Pennant: Small correction before continuation.
Marubozu: Strong conviction candle.
4.3 Indecision Patterns
Doji: Balance between buyers and sellers.
Spinning Top: Low conviction, sideways market.
Lesson: Candlestick patterns only matter in the right context (support, resistance, trend zones).
Chapter 5: Understanding Market Phases
Price moves in cycles:
Accumulation Phase: Smart money buys quietly, market moves sideways.
Markup Phase: Strong uptrend begins (higher highs & higher lows).
Distribution Phase: Smart money sells to late buyers, price moves sideways again.
Markdown Phase: Downtrend begins (lower highs & lower lows).
Price action traders learn to spot transitions between phases.
Chapter 6: Reading Trends
Uptrend: Look for buying opportunities on pullbacks.
Downtrend: Look for selling opportunities on retracements.
Range-bound: Focus on support/resistance rejections.
Golden Rule: Trade with the trend until price clearly shows reversal signs.
Chapter 7: Breakouts & Fakeouts
Breakout: Price moves beyond key support/resistance with momentum.
Fakeout (False Break): Price breaks a level but quickly reverses.
Pro Tip: Watch volume + candle close for real confirmation.
Chapter 8: Price Action Trading Strategies
Here are practical strategies traders use:
8.1 Breakout Trading
Identify consolidation → Wait for breakout → Enter with momentum.
Example: Range breakout, Triangle breakout.
8.2 Pullback Trading
Enter in the direction of trend after a retracement.
Example: Price bounces off support in uptrend.
8.3 Reversal Trading
Spot exhaustion patterns (Pin Bars, Engulfing) near major S/R zones.
Requires patience and confirmation.
8.4 Supply and Demand Zones
Supply = institutional sell zones.
Demand = institutional buy zones.
Price often reacts strongly when revisiting these levels.
Chapter 9: The Psychology Behind Price Action
Every candle reflects human psychology:
Long bullish candle: Strong buyer confidence.
Long bearish candle: Panic selling or strong bearish conviction.
Doji: Confusion / indecision.
Breakouts: Fear of missing out (FOMO) + herd mentality.
Price action is a visual representation of trader emotions.
Chapter 10: Common Mistakes in Reading Price Action
Overcomplicating the chart – Too many lines, patterns, or zones.
Ignoring market context – A bullish candle in a downtrend is weak.
Chasing trades – Entering late after breakout.
Forcing patterns – Seeing patterns that don’t exist.
Neglecting risk management – PA gives entries, but stops are crucial.
Conclusion
Reading price action is not about memorizing patterns, but understanding the story behind the charts. It’s about seeing the battle between buyers and sellers and aligning with the winning side.
Once you master candlesticks, support/resistance, trends, and psychology, price action becomes a powerful weapon that can work in any market, on any timeframe.
The path is long, but with discipline, patience, and practice, you can become fluent in the language of price action.
Part 2 Ride The Big Moves Why Trade Options? (Advantages)
Leverage: Small capital controls big positions.
Hedging: Protect stock portfolio from losses.
Flexibility: Profit in bullish, bearish, or sideways markets.
Income: Selling options generates consistent premiums.
Risk Control: Losses can be predefined by structuring trades.
Risks of Options Trading
Time Decay (Theta): Options lose value as expiration approaches.
Liquidity Risk: Not all options are actively traded.
Complexity: Strategies can be difficult for beginners.
Unlimited Risk (for sellers): Selling naked calls can wipe out capital.
Over-leverage: Small margin requirements may encourage oversized positions.

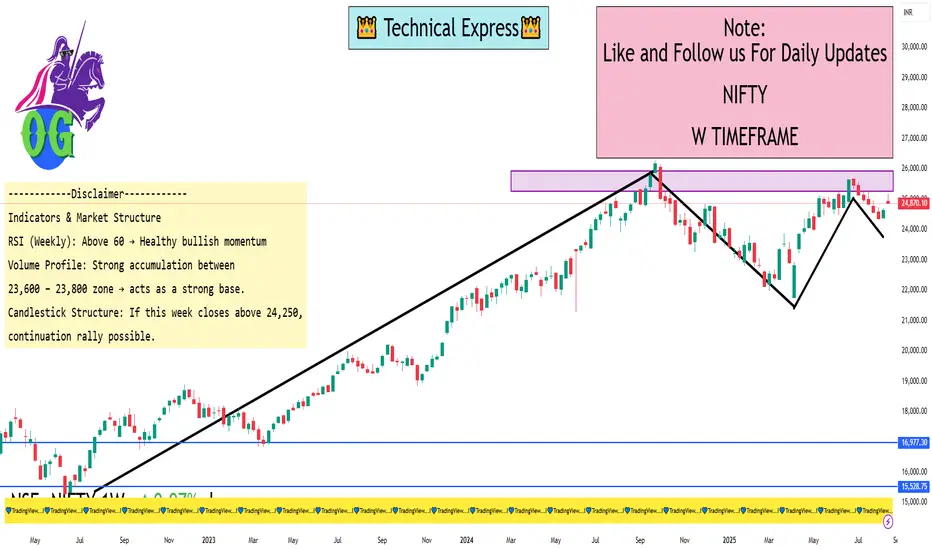
Nifty 1 Week ViewKey Levels (Weekly Time Frame)
Resistance Zones (Upside):
24,250 – 24,300 → Immediate supply zone / resistance
24,500 – 24,600 → Next major resistance (if breakout sustains)
24,850 – 25,000 → Psychological round level + possible profit booking
Support Zones (Downside):
23,950 – 24,000 → Immediate weekly support
23,700 – 23,750 → Strong demand zone (previous breakout level)
23,400 – 23,450 → Deeper support; trend reversal only if broken
Indicators & Market Structure
RSI (Weekly): Above 60 → Healthy bullish momentum, but slightly overbought.
Volume Profile: Strong accumulation between 23,600 – 23,800 zone → acts as a strong base.
Candlestick Structure: If this week closes above 24,250, continuation rally possible. If rejection happens, sideways to mild correction.
BTCUSD 4 Hours View Support Zones & Turning Points
** ~$115,000 Pivot Zone**
A consolidation area around $115,000 (± $600) acts as a short-term support base and momentum gauge.
~$117,430 (4H MA50)
The 50-period moving average on the 4H chart sits near $117,430, serving as a dynamic support level.
Previous ATH zones ($110K–$112K)
These levels have historically flipped as support after bullish retreats.
Resistance & Overhead Supply
$120,000 Psychological Barrier
A major round-number resistance that needs to be overcome for sustained bullish momentum.
$121K–$123K (Current and Previous ATH Range)
These levels remain formidable obstacles, marking the highest recent peaks.
$124,500 Zone
The recent all-time high, now under challenging supply and selling pressure.
Elliott Wave & Retracement Support
~$118,657 (38.2% Fibonacci retracement)
This level aligns with the corrective wave (Wave IV) in the Elliott Wave count, suggesting a solid bounce zone for potential Wave V continuation.

Common Mistakes New Traders Make1. Jumping into Trading Without Education
Many beginners dive into trading after watching a few YouTube videos, following tips from social media, or hearing success stories of others. But trading isn’t about luck — it’s about skill, discipline, and strategy.
Mistake: Believing trading is just buying low and selling high.
Reality: Trading requires understanding technical analysis, risk management, psychology, and market structure.
Example: A new trader hears about a stock that doubled in a week. They buy without research, but by the time they enter, the stock has already peaked. The price crashes, and they lose money.
Solution: Treat trading like a profession. Just as a doctor or engineer studies for years, a trader needs structured learning — books, courses, simulations, and practice before putting real money at risk.
2. Trading Without a Plan
Imagine playing a cricket match without a game plan — chaos is guaranteed. Similarly, trading without a clear plan leads to impulsive decisions.
Mistake: Buying and selling based on emotions or news without rules.
Reality: Successful traders have a written trading plan that defines entries, exits, position size, and risk per trade.
Example: A beginner sees a stock rising sharply and enters. But when it drops, they don’t know whether to cut losses or hold. Confusion results in bigger losses.
Solution: Build a trading plan that answers:
What markets will I trade?
What timeframes will I use?
What setups will I look for?
How much capital will I risk?
When will I exit with profit/loss?
3. Overtrading
New traders often fall into the trap of taking too many trades, thinking more trades mean more profits. In reality, overtrading drains both money and mental energy.
Mistake: Trading every small market move, chasing excitement.
Reality: Professional traders wait patiently for high-probability setups.
Example: A trader makes 15 trades in a single day, paying high brokerage and making impulsive decisions. Even if a few trades win, commissions and losses wipe out gains.
Solution: Quality over quantity. Focus on one or two good setups a day/week instead of chasing every move.
4. Lack of Risk Management
This is perhaps the biggest mistake new traders make. They risk too much on a single trade, hoping for quick riches.
Mistake: Betting 30–50% of capital on one stock/option.
Reality: Risk per trade should usually be 1–2% of total capital.
Example: A trader with ₹1,00,000 puts ₹50,000 into one stock. The stock falls 20%, wiping out ₹10,000 in one trade. After a few such losses, the account is destroyed.
Solution: Use stop-loss orders, risk only small amounts per trade, and accept losses as part of the game.
5. Revenge Trading
After a loss, beginners often feel the need to “make back money quickly.” This emotional reaction leads to revenge trading — entering bigger trades without logic.
Mistake: Trading emotionally after a loss.
Reality: Losses are normal; chasing them increases damage.
Example: A trader loses ₹5,000 in the morning. Angry, they double their position size in the next trade. The market goes against them again, and they lose ₹15,000 more.
Solution: Step away after a loss. Review what went wrong. Never increase position size just to recover money.
6. Lack of Patience
Trading rewards patience, but beginners crave fast profits. They exit winners too early or hold losers too long.
Mistake: Taking profits too soon, cutting winners; holding losers, hoping they turn.
Reality: Let profits run, cut losses quickly.
Example: A stock moves up 2%, and the trader books profit, missing a 10% rally. But when a trade goes down 5%, they refuse to sell, and the loss grows to 20%.
Solution: Trust your trading system. Follow stop-loss and target levels.
7. Following Tips & Rumors
Many new traders blindly follow WhatsApp tips, Twitter posts, or “friend’s advice” without analysis.
Mistake: Relying on others for buy/sell calls.
Reality: Tips may work occasionally but are not reliable long-term.
Example: A trader buys a “hot stock” from a group. The stock spikes briefly but crashes because big players offload positions.
Solution: Do your own research. Build conviction based on analysis, not rumors.
8. Ignoring Trading Psychology
The market is a battle of emotions — fear, greed, hope, and regret. Beginners often underestimate psychology.
Mistake: Thinking trading is 100% about strategy.
Reality: Psychology is often more important than strategy.
Example: Two traders have the same system. One sticks to rules, the other panics and exits early. The disciplined trader profits; the emotional one doesn’t.
Solution: Practice emotional control. Meditation, journaling, and self-awareness help.
9. No Record Keeping
Many beginners don’t track their trades, so they repeat mistakes.
Mistake: Trading without keeping a log.
Reality: A trading journal reveals strengths and weaknesses.
Example: A trader keeps losing in intraday trades but doesn’t realize it because they don’t track results.
Solution: Maintain a trading journal with details: entry, exit, reason for trade, result, and lessons learned.
10. Unrealistic Expectations
Movies, social media, and success stories create a false impression of overnight riches. Beginners expect to double their account in weeks.
Mistake: Believing trading is a shortcut to wealth.
Reality: Trading is a long-term skill, and returns grow with discipline.
Example: A trader starts with ₹50,000 and expects to make ₹10,000 a day. They take huge risks, lose capital, and quit.
Solution: Aim for consistent small profits. Even 2–3% monthly growth compounds into wealth.
11. Poor Money Management
Beginners often don’t allocate capital wisely. They put most money in risky trades, leaving nothing for better opportunities.
Solution: Diversify across trades, keep emergency funds, and never put all money into one asset.
12. Not Understanding Market Conditions
Markets change — trending, ranging, or volatile. Beginners apply the same strategy everywhere.
Example: A breakout strategy may work in trending markets but fail in sideways ones.
Solution: Learn to read market context (volume profile, trend, volatility). Adapt strategies accordingly.
13. Overconfidence After Wins
A few successful trades can make beginners feel invincible. They increase position sizes drastically, only to face big losses.
Solution: Stay humble. Stick to your plan regardless of wins or losses.
14. Fear of Missing Out (FOMO)
FOMO is powerful in trading. Beginners see a stock rallying and jump in late, only to catch the top.
Solution: Accept that missing trades is normal. The market always offers new opportunities.
15. Lack of Continuous Learning
Markets evolve. Strategies that worked last year may fail now. Beginners often stop learning after early success.
Solution: Keep learning — read books, backtest strategies, and follow market news.
16. Mixing Investing with Trading
Beginners often hold losing trades, calling them “long-term investments.” This blurs strategy.
Solution: Separate trading and investing accounts. Stick to timeframes and plans.
17. Ignoring Risk-Reward Ratio
Many beginners take trades where the potential reward is smaller than the risk.
Example: Risking ₹1,000 for a possible profit of ₹200. Even if right most times, losses eventually dominate.
Solution: Take trades with at least 1:2 or 1:3 risk-reward ratio.
18. Not Practicing in Simulation
Jumping into live markets without demo practice is costly.
Solution: Use paper trading or demo accounts first to build skills without losing money.
19. Not Respecting Stop-Loss
Beginners often remove or widen stop-losses, hoping the trade will reverse.
Solution: Treat stop-loss like a safety belt. It protects you from disasters.
20. Quitting Too Soon
Many traders quit after a few losses, never giving themselves a chance to grow.
Solution: Accept that trading mastery takes years. Losses are tuition fees for market education.
Conclusion
Trading is not a sprint but a marathon. Almost every beginner repeats these mistakes: overtrading, poor risk management, revenge trading, following tips, and ignoring psychology. The good news is that mistakes are stepping stones to mastery — if you learn from them.
By approaching trading with education, discipline, patience, and humility, new traders can avoid the traps that wipe out most beginners and build a path toward consistent profits.

Option Trading Option Pricing & The Greeks
Options are not priced randomly. Their value comes from several factors:
Intrinsic Value: The real, tangible value (difference between stock price and strike).
Time Value: Extra premium paid for the possibility of future movement.
Volatility: The higher the uncertainty, the higher the option premium.
Option Greeks – the essential toolkit:
Delta – Measures how much an option’s price changes with a change in stock price. (Think: sensitivity to price).
Gamma – Measures how much Delta itself changes.
Theta – Time decay. Shows how much an option loses value each day as expiration approaches.
Vega – Sensitivity to volatility. Higher volatility = higher option price.
Rho – Sensitivity to interest rates (less relevant for short-term traders).
Understanding Greeks is like knowing the gears of a car—they help control risk.
Option Trading Strategies
Here’s where things get exciting. Options are like Lego blocks—you can combine them in different ways to create powerful strategies.
A. Basic Strategies
Buying Calls – Bullish bet.
Buying Puts – Bearish bet.
Covered Call – Holding a stock and selling calls to earn income.
Protective Put – Owning stock and buying puts to insure against loss.
B. Intermediate Strategies
Straddle – Buy a call + put at same strike, betting on big movement (either direction).
Strangle – Similar to straddle but different strikes, cheaper.
Bull Call Spread – Buy one call, sell a higher strike call. Profits capped but cheaper.
Bear Put Spread – Buy a put, sell lower strike put.
C. Advanced Strategies
Iron Condor – Selling an OTM call spread + OTM put spread, betting on low volatility.
Butterfly Spread – Combining multiple options to profit if stock stays near a target price.
Calendar Spread – Exploiting time decay by selling short-term and buying long-term options.
Each strategy has a risk-reward profile and works best in specific market conditions.

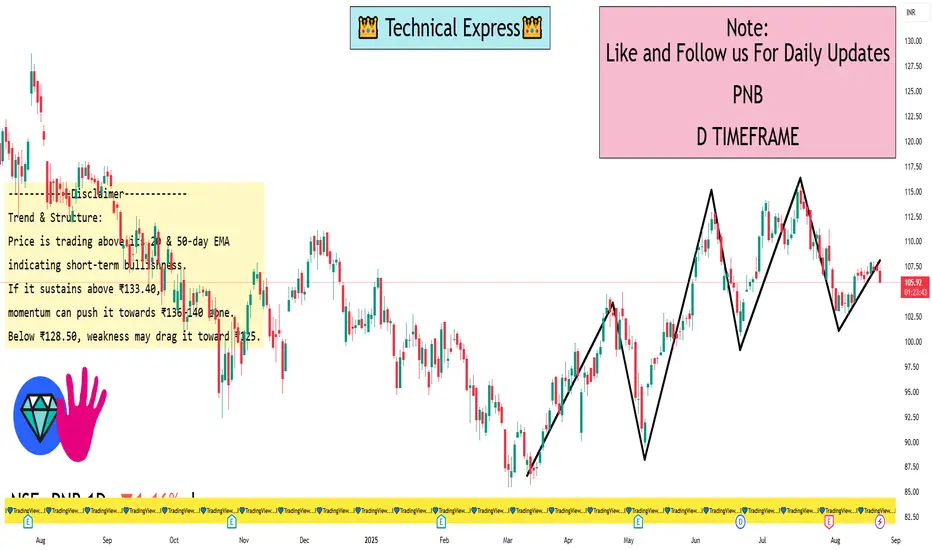
PNB 1 Day ViewSupport Levels:
₹128.50 – Immediate support (recent swing low)
₹125.20 – Strong demand zone
₹121.80 – Major support
Resistance Levels:
₹133.40 – Immediate hurdle
₹136.20 – Strong resistance (recent high area)
₹140.00 – Psychological & breakout level
📈 Trend & Structure:
Price is trading above its 20 & 50-day EMA, indicating short-term bullishness.
If it sustains above ₹133.40, momentum can push it towards ₹136–140 zone.
Below ₹128.50, weakness may drag it toward ₹125.
Day Trading vs Swing Trading: A Deep-Dive ComparisonIntroduction
When it comes to trading in the stock market, there are countless strategies, styles, and approaches that traders adopt. Two of the most popular methods among retail and professional traders are day trading and swing trading. Both strategies aim to generate profits from short-term price fluctuations in stocks, forex, commodities, or cryptocurrencies, but they differ significantly in execution, mindset, risk, and lifestyle requirements.
Choosing between day trading and swing trading is like choosing between sprinting and middle-distance running. Both involve running, but the pace, stamina, and strategies differ. Similarly, both day traders and swing traders thrive on short-term price moves, but the way they participate in the market is fundamentally different.
This article explores day trading vs swing trading in depth, covering definitions, key characteristics, advantages, risks, required skills, tools, psychology, and a balanced conclusion to help traders decide which style suits them best.
Chapter 1: Understanding Day Trading
What is Day Trading?
Day trading is the practice of buying and selling financial instruments within the same trading day, often closing all positions before the market closes. The objective is to capture small but frequent price movements. Day traders rarely hold trades overnight, minimizing exposure to overnight risks such as gaps, earnings announcements, or global events.
Characteristics of Day Trading
High Trade Frequency – Dozens or even hundreds of trades per day.
Small Profit Margins – Aim for a few points, ticks, or basis points per trade.
Intra-Day Charts – 1-minute, 5-minute, 15-minute, and sometimes hourly charts are heavily used.
Fast Execution – Requires speed, precision, and often advanced trading software.
Capital Requirement – Higher margins or regulatory requirements (e.g., pattern day trading rule in the U.S.).
Typical Day Trader Workflow
Pre-market preparation: Analyzing news, earnings reports, and economic data.
Identifying setups: Using technical indicators, price action, or order flow.
Executing trades: Entering and exiting within minutes or hours.
Risk control: Using tight stop-losses, rarely risking more than 1-2% per trade.
Closing all positions: No overnight holdings.
Example
A day trader sees a stock break above a pre-market resistance level. They buy 500 shares at ₹200, sell them within 15 minutes at ₹202, making ₹1,000 profit. They repeat this process multiple times daily.
Chapter 2: Understanding Swing Trading
What is Swing Trading?
Swing trading is the practice of holding trades for several days to weeks to capture medium-term market moves. Swing traders exploit market “swings” caused by supply-demand imbalances, news-driven momentum, or technical setups.
Characteristics of Swing Trading
Lower Trade Frequency – A few trades per week or month.
Larger Profit Targets – Aim for 5–20% moves, sometimes more.
Daily & Weekly Charts – Focus on higher timeframes like 1D, 4H, or weekly charts.
Overnight Exposure – Positions are held through overnight gaps, earnings, or news.
Capital Efficiency – Can trade with smaller accounts due to lower frequency and lower transaction costs.
Typical Swing Trader Workflow
Scanning markets: Identifying trends, consolidations, or breakouts.
Entry timing: Using technical levels (support/resistance, moving averages).
Position holding: Holding trades for days/weeks until targets are hit.
Risk management: Stop-losses wider than day trading, but risk per trade is carefully calculated.
Review & rebalance: Adjusting positions based on new data or chart setups.
Example
A swing trader notices a stock forming a bullish cup-and-handle pattern. They buy at ₹200 with a stop-loss at ₹190 and a target of ₹230. The trade takes 10 days to hit the target, yielding a 15% profit.
Chapter 3: Advantages & Disadvantages
Advantages of Day Trading
No Overnight Risk – No exposure to after-hours events.
Daily Income Potential – Consistent profits if disciplined.
Leverage Opportunities – Brokers often provide higher intraday leverage.
Skill Development – Sharpens quick decision-making and execution.
Disadvantages of Day Trading
High Stress & Intensity – Demanding lifestyle, mentally exhausting.
High Transaction Costs – Frequent trades increase brokerage and taxes.
Steep Learning Curve – Requires years of practice.
Capital Restrictions – Some markets impose minimum balances (e.g., $25,000 in U.S. for PDT rule).
Advantages of Swing Trading
Flexibility – Suitable for part-time traders with jobs.
Bigger Profit Margins – Larger gains per trade.
Less Stress – No need to watch every tick.
Lower Costs – Fewer transactions, lower fees.
Disadvantages of Swing Trading
Overnight & Weekend Risk – Gap risk due to news or global events.
Slower Results – Waiting days/weeks for trade resolution.
Discipline Required – Avoiding emotional exits during volatility.
Dependence on Trends – Works best in trending markets, struggles in choppy sideways markets.
Chapter 4: Required Skills
Skills for Day Traders
Technical Mastery: Reading candlestick patterns, order flow, momentum indicators.
Execution Speed: Entering/exiting trades instantly.
Emotional Control: Avoiding overtrading, revenge trading.
Adaptability: Quickly adjusting strategies based on market conditions.
Skills for Swing Traders
Patience: Waiting for setups and letting trades play out.
Chart Reading: Spotting longer-term patterns, support/resistance.
Risk Management: Wider stops and position sizing.
Fundamental Awareness: Earnings reports, economic cycles, sectoral strength.
Chapter 5: Lifestyle Differences
Day Trader’s Lifestyle
Rigid schedule, glued to screens.
Highly stressful, like a high-pressure job.
Potentially lucrative but exhausting.
Swing Trader’s Lifestyle
Flexible, allows another job or business.
More relaxed, less screen time.
Profit cycles are slower, requiring patience.
Chapter 6: Risk & Money Management
Both day trading and swing trading require strict risk management.
Day Traders: Use very tight stop-losses (0.5–1%). Since trades are frequent, even small losses can add up quickly. They usually risk 1% or less of capital per trade.
Swing Traders: Use wider stop-losses (2–5%), but since trade frequency is lower, they can size positions accordingly.
Golden Rule: In both styles, protecting capital is more important than chasing profits.
Chapter 7: Tools & Technology
Day Trading Tools:
Advanced brokers with fast execution.
Real-time scanners and news feeds.
Level 2 market data and order book.
1-min to 15-min charts with volume analysis.
Swing Trading Tools:
Stock screeners and scanners (fundamental + technical).
End-of-day charting platforms.
Alerts for breakouts or moving averages.
Daily/weekly trend analysis.
Chapter 8: Psychology of Day vs Swing Traders
Day Trader Mindset:
Thrives under pressure.
Short attention span but sharp reflexes.
Accepts small wins and small losses.
Needs strong discipline against greed/fear.
Swing Trader Mindset:
Patient and long-term thinker.
Comfortable with delayed gratification.
Can handle volatility and avoid panic exits.
Strong analytical temperament.
Chapter 19: Which One is Better?
There’s no “better” strategy universally—it depends on the trader’s goals, personality, and lifestyle.
Choose Day Trading if:
You can dedicate full-time hours.
You enjoy fast action and adrenaline.
You have sufficient capital to meet margin requirements.
You’re disciplined and thrive in high-stress environments.
Choose Swing Trading if:
You have a job/business and can’t sit in front of screens all day.
You prefer patience over speed.
You’re looking for bigger gains per trade.
You can handle overnight risk.
Conclusion
Day trading and swing trading are like two sides of the same coin. Both aim to capture short-term profits but differ in approach, holding period, required skills, and lifestyle impact. Day trading is fast, stressful, and capital-intensive but offers quick returns. Swing trading is slower, less stressful, and more flexible but comes with overnight risk.
Ultimately, the best trading style is the one aligned with your personality and goals. Many traders experiment with both before settling into the strategy that suits them. Whether you choose the sprint of day trading or the steady stride of swing trading, success depends less on the strategy itself and more on discipline, risk management, and consistency.

Bitcoin 1 Day view Support Levels:
$112,000 — a critical short-timeframe level; a sweep below this could trigger opportunities according to @CryptoMichNL.
$113,000–$114,000 — active support zone where traders are positioning, as noted by Greeks.Live.
$111,200–$112,700 — a daily + 4-hour Fair Value Gap (FVG) support area. Holding this region may prevent further downside.
Resistance Levels:
$115,000 — identified as a pressure zone by crypto observers; its breach could lead to renewed momentum.
$115,700–$116,100 — Fibonacci-style resistance tiers from Barchart’s pivot-point analysis.
What to Watch Next
If BTC holds above $112,700–$113,000: Could attract buyers looking for a bounce, possibly aiming toward $115K+.
If BTC breaks below $112K: Risk of deeper correction; next meaningful stop near $111K.
If BTC clears $115K: Likely opens the path toward the $115.7–$116.1 zone and beyond.

Part 2 Support And ResistanceWhy Options Exist?
Options exist to manage risk and to create trading opportunities. Think of them as financial insurance. Just like you pay a premium for car insurance to protect against damage, in options trading, investors pay a premium to protect themselves against adverse price moves.
For Hedgers: Options act as insurance. A stock investor can buy a put option to protect his portfolio if the market falls.
For Speculators: Options provide leverage. With small capital, traders can take large directional bets.
For Arbitrageurs: Options open opportunities to exploit price inefficiencies between the spot, futures, and options markets.
Key Terminologies in Option Trading
Before diving deep, let’s understand some essential terms:
Call Option: A contract that gives the buyer the right (but not the obligation) to buy an asset at the strike price before expiry.
Example: Buying a Reliance ₹2500 Call Option means you can buy Reliance shares at ₹2500 even if the market price rises to ₹2700.
Put Option: A contract that gives the buyer the right (but not the obligation) to sell an asset at the strike price before expiry.
Example: Buying a Nifty 19000 Put Option means you can sell Nifty at 19000 even if the market falls to 18500.
Premium: The price paid to buy the option contract.
Example: If a Nifty 20000 Call is trading at ₹150, that ₹150 is the premium.
Strike Price: The pre-decided price at which the option can be exercised.
Expiry Date: The last date on which the option contract is valid.
In-the-Money (ITM): Option that already has intrinsic value.
Example: Nifty at 20000 → 19500 Call is ITM.
Out-of-the-Money (OTM): Option that has no intrinsic value (only time value).
Example: Nifty at 20000 → 21000 Call is OTM.
At-the-Money (ATM): Option strike price is closest to current market price.
Lot Size: Options are traded in predefined lot sizes, not single shares.
Example: Bank Nifty option lot size = 15 units (as per 2025 rules).
Option Chain: A tabular representation showing available strikes, premiums, open interest, etc. for calls and puts.

Part 1 Support And ResistanceIntroduction to Option Trading
The stock market offers multiple instruments to trade and invest—stocks, futures, commodities, currencies, and derivatives. Among these, Options have gained tremendous popularity worldwide because they give traders flexibility, leverage, and strategies to profit in all types of market conditions—bullish, bearish, or even sideways.
At its core, an Option is a contract that gives a buyer the right but not the obligation to buy or sell an asset at a predetermined price (called the strike price) before or on a specific date (called the expiry date).
This right comes at a cost, known as the premium, which is paid by the option buyer to the option seller (also called the writer).
Options are widely traded on stocks, indices, commodities, and currencies. In India, for example, options on Nifty 50, Bank Nifty, Sensex, and individual stocks are among the most liquid contracts.
Why Options Exist?
Options exist to manage risk and to create trading opportunities. Think of them as financial insurance. Just like you pay a premium for car insurance to protect against damage, in options trading, investors pay a premium to protect themselves against adverse price moves.
For Hedgers: Options act as insurance. A stock investor can buy a put option to protect his portfolio if the market falls.
For Speculators: Options provide leverage. With small capital, traders can take large directional bets.
For Arbitrageurs: Options open opportunities to exploit price inefficiencies between the spot, futures, and options markets.

Stock Market & Trading Basics1. What is a Stock Market?
At its core, a stock market is a place where people buy and sell ownership of companies. When you buy a share, you are literally buying a tiny piece of that company. If the company grows, you benefit through price appreciation and dividends. If it fails, you share the loss.
Think of it as a giant marketplace – just like a vegetable market. Instead of potatoes and onions, here you trade shares of companies like Reliance, Infosys, or TCS.
The purpose of a stock market is simple:
Companies raise money for growth.
Investors get a chance to grow their wealth.
It is essentially a bridge between businesses and investors.
2. History and Evolution of Stock Markets
The concept of stock trading is centuries old.
The Amsterdam Stock Exchange (1602) is considered the world’s first official stock exchange, started by the Dutch East India Company.
In the U.S., the New York Stock Exchange (NYSE) was founded in 1792 under the famous “Buttonwood Agreement.”
In India, the Bombay Stock Exchange (BSE) was established in 1875, making it Asia’s oldest stock exchange. Later, the National Stock Exchange (NSE) launched in 1992, which brought electronic trading to India.
Over time, trading shifted from open outcry (shouting bids in trading pits) to today’s electronic screen-based trading where a smartphone is enough to trade.
3. Why Do Companies List Their Shares?
A company can grow in two ways:
Take loans from banks.
Raise money from investors by selling ownership (shares).
When a company issues shares for the first time through an IPO (Initial Public Offering), it becomes “listed” on a stock exchange. Once listed, anyone can buy or sell those shares.
Advantages for companies:
Easy access to large funds.
Increases credibility and brand value.
Provides liquidity to early investors.
4. How Investors Participate in the Market
Investors participate by opening a Demat and Trading Account with a broker (like Zerodha, Upstox, Angel One, etc.).
Trading Account = to buy/sell.
Demat Account = to store shares digitally (like a bank account for stocks).
Example: If you buy 10 shares of Infosys, they’ll reflect in your Demat account, and you can sell anytime through your trading account.
5. Primary Market vs Secondary Market
Primary Market → Where companies issue new shares via IPOs. Example: LIC IPO in India (2022).
Secondary Market → Where investors trade already issued shares. Example: Buying/selling Infosys shares daily on NSE.
In simple terms:
Primary = company → investor.
Secondary = investor → investor.
6. Key Stock Market Participants
The market has different types of players:
Retail Investors → Normal individuals like us.
Domestic Institutional Investors (DII) → Indian mutual funds, insurance companies.
Foreign Institutional Investors (FII) → Big international funds investing in India.
Market Makers / Brokers → Provide liquidity by facilitating trades.
Regulators (SEBI in India, SEC in USA) → Ensure fair play.
7. Basic Market Terminology
Some must-know terms:
Bull Market → Rising market.
Bear Market → Falling market.
Blue-chip stocks → Large, stable companies like TCS, Infosys.
Market Capitalization = Share Price × Total Shares.
Dividend = Profit sharing by company to shareholders.
Volume = Number of shares traded.
8. Types of Trading
Delivery Trading – Buy today, hold as long as you want.
Intraday Trading – Buy and sell on the same day.
Futures & Options (F&O) – Derivatives trading, betting on price movements without owning stock.
Commodities Trading – Gold, silver, crude oil.
Currency Trading – Forex pairs like USD/INR.
9. Understanding Indices
Indices are like “thermometers” of the stock market.
Sensex (BSE, 30 companies) → Oldest Indian index.
Nifty 50 (NSE, 50 companies) → Most popular benchmark in India.
Dow Jones (USA), S&P 500, Nasdaq → Global indices.
If Nifty is up, it usually means the overall market is healthy.
10. Market Orders
Different ways to buy/sell stocks:
Market Order – Execute instantly at current price.
Limit Order – Execute only at a specific price you set.
Stop Loss Order – Automatically sell if price falls below your set limit (risk management).
11. Stock Market Instruments
Equity Shares
Bonds / Debentures
Mutual Funds / ETFs
Derivatives (Futures, Options)
Commodities
Currencies
Each instrument has its own risk-return profile.
12. How Prices Move
Stock prices are driven by:
Demand & Supply → More buyers than sellers = price goes up.
News & Events → Quarterly results, elections, wars, etc.
Investor Sentiment → Greed vs fear.
13. Role of Regulators
In India, SEBI (Securities and Exchange Board of India) regulates markets.
Protects investors.
Ensures transparency.
Monitors insider trading and scams.
14. Trading Basics: Technical vs Fundamental Analysis
Fundamental Analysis → Studying a company’s financials, balance sheet, profits, growth potential. (Long-term investing).
Technical Analysis → Studying price charts, patterns, indicators (RSI, MACD, Moving Averages) to predict short-term moves.
Most traders use a mix of both.
15. Popular Trading Styles
Scalping → Very quick trades, seconds to minutes.
Intraday Trading → Same-day trading.
Swing Trading → Holding for days/weeks.
Position Trading → Holding for months/years.
Long-term Investing → Buy and hold for wealth creation.
Conclusion & Future of Trading
The stock market is not a casino – it is a platform for wealth creation. Yes, risks exist, but with the right knowledge, discipline, and strategy, it can be one of the most rewarding journeys.
The future of trading will be AI-driven, with algorithms, data analytics, and global connectivity shaping markets. But the basics – demand, supply, psychology – will always remain the same.
Part 1 Master Candle Sticks PatternRisk Management in Options
Position Sizing: Don’t risk more than 1–2% of capital in one trade.
Stop Loss: Exit before premium erodes completely.
Avoid Over-leverage: Options look cheap but risk is real.
Hedge Positions: Combine with futures or other options.
Psychology of Option Traders
Greed: Chasing high-return trades without risk control.
Fear of Missing Out (FOMO): Jumping in near expiry due to excitement.
Patience: Waiting for correct setup is key.
Discipline: Stick to rules, avoid revenge trading.
Modern Trends in Option Trading
Weekly Expiry Craze: Thursday = biggest trading day.
0DTE (Zero Day to Expiry) Options: Popular for scalping.
Algo & AI Trading: Automated strategies now dominate.
Retail Participation Explosion: India has seen retail option traders grow 5x in 3 years.

Part 4 Learn Institutional TradingParticipants in Options Market
Hedgers: Farmers, companies, or investors protecting against risk. Example: An airline hedging fuel cost with options.
Speculators: Traders betting on market moves with limited capital.
Arbitrageurs: Exploit mispricing between options and underlying.
Why Trade Options?
✅ Advantages:
Leverage: Small premium can control large value.
Flexibility: Can profit in any market condition.
Defined Risk: Buyer’s maximum loss = premium paid.
Income Strategies: Writing options to earn premium.
❌ Risks:
Time Decay: Options lose value daily.
Complexity: Many moving factors (Greeks, volatility).
Unlimited Losses (for Sellers): If selling naked options.

Short-Term Trading vs. Long-Term TradingIntroduction
When people step into the stock market, they usually come across two main approaches: short-term trading and long-term investing (or trading). Both are methods of participating in the markets, but they differ significantly in terms of time horizon, mindset, strategies, risks, and rewards.
Short-term trading is like sprinting: fast-paced, energetic, and often risky. Long-term investing is like running a marathon: steady, patient, and endurance-driven. Both can lead to success, but they suit different kinds of personalities, financial goals, and market conditions.
In this detailed discussion, we’ll explore what each strategy means, how they work, their pros and cons, famous examples, psychology, and ultimately how traders and investors can decide which approach (or blend of both) works for them.
What is Short-Term Trading?
Short-term trading refers to buying and selling financial assets within a short period, ranging from a few minutes to a few weeks. The primary objective is to take advantage of price fluctuations and profit quickly.
Types of Short-Term Trading
Scalping – Trades last seconds or minutes, aiming for small profits multiple times a day.
Day Trading – Buying and selling within the same day, closing all positions before market close.
Swing Trading – Holding trades for a few days to weeks, capturing short price “swings.”
Momentum Trading – Jumping into stocks with strong upward or downward momentum, often influenced by news, results, or events.
Key Features of Short-Term Trading
Time horizon: seconds to weeks.
Tools used: technical analysis, chart patterns, volume profile, moving averages, RSI, etc.
Driven by: volatility, news, earnings reports, global events.
Requires active monitoring and fast decision-making.
What is Long-Term Trading (or Investing)?
Long-term investing involves holding an asset for years, often ignoring short-term fluctuations. The goal is to grow wealth gradually by benefiting from compounding, dividends, and the long-term growth of companies or markets.
Key Features of Long-Term Trading
Time horizon: several years to decades.
Tools used: fundamental analysis, company earnings, valuation ratios (P/E, P/B), macroeconomic trends.
Driven by: company growth, economic cycles, innovation, demographics.
Requires patience, consistency, and belief in the long-term growth of markets.
Famous Example:
Warren Buffett is the most celebrated long-term investor. He buys strong companies with durable advantages and holds them for decades.
Time Horizon: The Core Difference
Short-Term Trading: Profit targets can be hit in minutes or days. Focus is on timing entry/exit perfectly.
Long-Term Trading: Success depends less on timing and more on time in the market. Staying invested allows the power of compounding to work.
For example:
A day trader might buy Reliance stock at ₹2800 and sell at ₹2825 within a few hours.
A long-term investor might buy Reliance at ₹1000 in 2016 and hold until 2025 when it reaches above ₹2800, gaining multiple times the initial capital.
Risk and Reward
Short-Term Trading Risks & Rewards
Rewards: Quick profits, ability to capitalize on volatility, frequent opportunities.
Risks: High transaction costs, emotional stress, overtrading, large losses from sudden moves.
Long-Term Trading Risks & Rewards
Rewards: Power of compounding, lower taxes (on long-term capital gains), dividends, financial security.
Risks: Market crashes (like 2008 or 2020), company failures, inflation risk, long waiting period.
Tools & Techniques
Short-Term Traders Rely On:
Technical charts (candlesticks, moving averages, RSI, MACD).
Market structure and volume profile.
News-driven events (earnings, economic data).
Risk management via stop-loss orders.
Long-Term Traders Rely On:
Fundamental analysis (balance sheet, income statement, cash flow).
Valuation models (Discounted Cash Flow, P/E ratios).
Macroeconomic outlook (GDP growth, interest rates, inflation).
Patience and steady investment via SIPs (Systematic Investment Plans).
Psychology Behind Both Approaches
Psychology of Short-Term Traders
Need discipline and emotional control.
Greed and fear drive most mistakes.
High adrenaline, similar to professional gaming or sports.
Psychology of Long-Term Traders
Patience and conviction are crucial.
Must endure downturns without panic selling.
Delayed gratification mindset—willing to wait years for returns.
Costs and Taxes
Short-Term Trading: Frequent buying and selling means higher brokerage, slippage, and short-term capital gains tax (usually higher).
Long-Term Investing: Fewer transactions reduce costs. Long-term capital gains tax rates are often lower, helping wealth accumulation.
Who Should Choose What?
Short-Term Trading Suits:
Active individuals who can track markets daily.
Those comfortable with risk and volatility.
People looking for quick income rather than long-term wealth.
Long-Term Trading Suits:
Salaried professionals or business owners who can’t monitor markets daily.
People aiming for retirement planning, wealth creation, children’s education.
Investors who prefer stability over thrill.
Case Studies
Short-Term Example:
A trader in March 2020 (COVID crash) bought Nifty futures at 7,600 and sold at 8,000 within 2 days. Quick 400 points profit = massive gain.
Long-Term Example:
Someone who invested in Infosys IPO in 1993 (₹95 per share, adjusted for splits/bonuses) would now have wealth worth crores.
Blended Approach (Best of Both Worlds)
Many professionals suggest mixing both:
Keep 80% of funds in long-term investments (stable growth, retirement security).
Use 20% for short-term trading (to exploit opportunities, stay active, and generate extra income).
This way, you don’t miss out on compounding while also enjoying the benefits of active trading.
Advantages & Disadvantages Side by Side
Aspect Short-Term Trading Long-Term Trading
Time Horizon Minutes to weeks Years to decades
Risk Very high Moderate (if diversified)
Reward Potential High, quick Massive over time
Stress Level Very high Lower
Tools Used Technical charts Fundamental analysis
Costs High Low
Taxes Higher Lower
Skill Requirement Very high Moderate
Best For Active, aggressive traders Patient investors
Final Thoughts
Short-term trading and long-term investing are two sides of the same coin. One thrives on speed, volatility, and timing, while the other prospers through patience, consistency, and the power of compounding.
The truth is, there’s no universal “better” strategy. It depends on your personality, risk tolerance, financial goals, and lifestyle. Some people thrive in the fast action of short-term trades, while others find peace in buying good companies and letting time do the heavy lifting.
If you’re new to the market, starting with long-term investing is generally safer. Once you gain experience, you may gradually allocate some portion of your capital to short-term trading.
In the end, the best strategy isn’t about chasing the highest return, but about choosing the path you can follow consistently without losing peace of mind.
Inflation & Market Performance (2025 Context)1. Introduction
Inflation has always been one of the most critical variables in shaping market performance. It affects everything — from consumer spending and corporate profits to central bank policies and stock valuations. In 2025, inflation continues to remain a hot topic across global economies, especially after the turbulent years of post-pandemic recovery, geopolitical conflicts, energy shocks, and monetary tightening cycles.
Markets don’t react to inflation in isolation; they respond to expectations about inflation, interest rates, and growth. While mild inflation is seen as healthy, runaway inflation or deflation can shake investor confidence and distort asset pricing.
In this article, we will explore:
The nature of inflation in 2025 and its drivers.
How inflation influences stock markets, bond markets, commodities, and currencies.
Sector-wise winners and losers in high/low inflation scenarios.
The interplay of central bank policies and investor psychology.
India’s inflation-market dynamics in 2025 compared with global trends.
Long-term structural themes in inflation-linked market performance.
2. Inflation Basics: Why It Matters
Before we dive into the 2025 context, let’s refresh the basics.
Definition: Inflation is the sustained rise in the general price level of goods and services.
Measurement: Typically measured via CPI (Consumer Price Index), WPI (Wholesale Price Index), or PCE (Personal Consumption Expenditure index in the US).
Causes:
Demand-pull inflation (too much demand chasing limited supply).
Cost-push inflation (higher input costs like wages, oil, commodities).
Built-in inflation (expectations embedded into wage-price cycles).
Why markets care about inflation:
Corporate Earnings: Rising costs squeeze profit margins.
Interest Rates: Central banks raise rates to tame inflation, making borrowing costlier.
Bond Yields: Higher inflation reduces the real return on fixed-income instruments.
Valuations: Equity valuations (P/E ratios) decline as discount rates rise.
Sector Rotation: Some sectors thrive in inflation (commodities, energy), while others suffer (tech, consumer discretionary).
In short, inflation is a valuation driver, a sentiment shaper, and a policy trigger.
3. The Global Inflation Landscape in 2025
3.1 Post-Pandemic Normalization
The pandemic years (2020–2022) created supply chain disruptions, leading to soaring prices. By 2023–2024, central banks aggressively raised rates (US Fed, ECB, RBI) to cool inflation. By 2025, inflation rates in developed economies are lower than peak levels but remain sticky — slightly above central bank comfort zones.
US Inflation (2025): Moderated to ~3% but stubborn in services and housing.
Eurozone: Around 2.5%, with energy still a risk due to geopolitical tensions.
India: CPI hovering around 4.5–5.5%, close to RBI’s comfort band but sensitive to food and fuel shocks.
Emerging Markets: More volatile inflation, often linked to currency weakness and commodity imports.
3.2 Key Drivers in 2025
Energy Prices: Oil & natural gas remain unpredictable due to Middle East tensions and Russia-Ukraine war aftershocks.
Climate Events: Erratic monsoons, floods, and heatwaves impact agricultural output (food inflation).
Geopolitical Fragmentation: Supply chain re-shoring, trade restrictions, and technology export controls add structural cost pressures.
Wages: Labor markets are tight, especially in tech and healthcare, adding wage-push inflation.
In essence, inflation in 2025 is not runaway like 2022, but sticky, uneven, and multi-speed across regions.
4. Inflation and Stock Market Performance
4.1 General Market Trends
Mild Inflation (2–3%): Markets usually perform well, as it signals healthy growth.
Moderate Inflation (3–5%): Mixed market performance — cost pressures vs. growth optimism.
High Inflation (>6%): Equity markets usually decline, except for inflation-hedge sectors.
4.2 Sectoral Winners in 2025
Energy & Commodities:
Oil, gas, metals tend to rise with inflation.
Companies in these sectors enjoy pricing power.
Banks & Financials:
Benefit from higher interest margins when rates rise.
Loan growth might slow, but profitability improves.
FMCG & Consumer Staples:
Can pass on costs to consumers, maintaining margins.
Defensive demand makes them stable.
Real Estate & Infrastructure:
Tangible assets act as inflation hedges.
However, sensitive to interest rates.
4.3 Sectoral Losers in 2025
Technology & Growth Stocks:
High valuations get compressed under rising discount rates.
Investors shift to value/cyclical stocks.
Consumer Discretionary:
Higher inflation erodes consumer purchasing power.
Luxury goods and non-essentials see demand contraction.
Bond-Proxies (Utilities, REITs):
Lose appeal as bond yields rise.
Higher financing costs hurt profitability.
5. Inflation and Bond Markets
Bond markets are directly linked to inflation expectations.
Nominal Bonds: Inflation erodes real returns, leading to higher yields.
Inflation-Indexed Bonds (TIPS in the US, IIBs in India): Demand rises when inflation uncertainty increases.
Yield Curve:
Flattening or inversion signals that markets expect inflation to cool and growth to slow.
Steepening suggests prolonged inflation risks.
In 2025, bond yields are high compared to the pre-pandemic era, reflecting elevated risk premiums. Institutional investors are diversifying between nominal and inflation-linked bonds.
6. Inflation and Commodities
Commodities are direct beneficiaries of inflation.
Gold & Silver: Classic safe havens. In 2025, gold trades strong due to persistent inflation fears and central bank buying (especially by China & India).
Oil & Gas: Sensitive to geopolitical disruptions; higher prices fuel inflation.
Agricultural Commodities: Climate shocks and supply-chain fragmentation keep food prices elevated.
Thus, commodity cycles are tightly interwoven with inflation, making them critical for portfolio diversification.
7. Inflation and Currencies
Currencies react strongly to inflation differentials.
High inflation, weak currency: Investors dump the currency (e.g., Turkey, Argentina).
Controlled inflation, stable currency: Boosts investor confidence.
In 2025:
US Dollar (USD): Stronger compared to EM currencies due to sticky inflation and Fed’s restrictive stance.
Indian Rupee (INR): Relatively stable but under pressure when oil surges.
Euro (EUR): Mixed performance; energy dependency makes inflation management tricky.
Yen (JPY): Weak due to ultra-loose monetary policy, despite global inflation trends.
8. Central Banks and Inflation Control
8.1 Federal Reserve (US)
The Fed remains cautious in 2025. It cannot cut rates too aggressively as inflation is not fully tamed. Markets closely track every FOMC meeting, as Fed policy guides global liquidity.
8.2 Reserve Bank of India (RBI)
RBI balances inflation control with growth support. India’s food inflation remains a challenge, but structural reforms, better forex reserves, and stable inflows help anchor market confidence.
8.3 European Central Bank (ECB) & Others
ECB faces a tough balancing act — weak growth but still above-target inflation. Other central banks (BoE, BoJ) adopt diverse stances depending on domestic pressures.
9. Investor Psychology in Inflationary Times
Markets are not just numbers; they’re a reflection of human behavior. Inflation affects psychology in powerful ways:
Fear: Rising prices reduce real wealth, making investors risk-averse.
Speculation: Some chase commodities or real estate as hedges.
Rotation: Capital shifts from growth to value, from equity to bonds, from domestic to global.
Herding: Retail investors often chase inflation-hedge assets at late stages, creating bubbles.
In 2025, investor sentiment is cautious yet opportunistic — inflation is high enough to worry but not catastrophic.
10. India’s Inflation-Market Performance in 2025
India is a special case in inflation-market dynamics.
Inflation Drivers: Food (vegetables, pulses), fuel imports, and rural demand are key factors.
Equity Markets:
Nifty and Sensex show resilience, supported by domestic flows (SIPs, DIIs).
Sectors like banking, IT services exports, and infrastructure remain strong.
Midcaps and SMEs are volatile due to inflation-sensitive costs.
Bond Markets: Rising G-sec yields (6.5–7.5%) reflect inflation risks but attract foreign inflows.
Rupee: Stable around 83–85/USD but vulnerable to oil price spikes.
India’s structural growth story (demographics, digital adoption, reforms) keeps markets buoyant even under moderate inflation.
Conclusion
Inflation in 2025 is not a crisis but a constant companion for markets. It’s sticky, regionally diverse, and shaped by structural shifts in energy, demographics, and geopolitics.
For investors and traders, understanding inflation means understanding market performance. It dictates central bank actions, bond yields, sectoral rotations, and even investor psychology.
The key takeaway: Markets can thrive under mild-to-moderate inflation, but elevated inflation demands strategic repositioning. In 2025, successful investors are those who embrace flexibility, hedge intelligently, and adapt to inflation’s multi-dimensional impact.

Part 8 Trading Master Class Calls & Puts with Real-Life Examples
Call Option Example
Suppose Reliance stock is trading at ₹2,500.
You buy a Call Option with strike price ₹2,600, paying a premium of ₹50.
If Reliance goes to ₹2,800, your profit = (2800 - 2600 - 50) = ₹150 per share.
If Reliance stays below 2600, you lose only the premium = ₹50.
A call option = bullish bet (you expect prices to rise).
Put Option Example
NIFTY is at 22,000.
You buy a Put Option strike 21,800, premium ₹80.
If NIFTY falls to 21,200 → Profit = (21800 - 21200 - 80) = ₹520 per lot.
If NIFTY rises above 21,800, you lose only ₹80.
A put option = bearish bet (you expect prices to fall).
Why Traders Use Options
Options are powerful because they allow:
Leverage – Control large value with small money (premium).
Example: Buying Reliance stock directly at ₹2,500 may cost ₹2.5 lakh (100 shares). But buying a call option may cost just ₹5,000.
Hedging – Protect portfolio from losses.
Example: If you hold Infosys shares, you can buy a put option to protect against downside.
Speculation – Bet on market direction with limited risk.
Income generation – Selling options (covered calls, cash-secured puts) generates steady income.
