THETA Monthly Chart Just Entered Its Most Dangerous ZoneTHETA Monthly Chart Just Entered Its Most Dangerous Zone
THETA is testing one of the most crucial zones on the entire macro structure. After a long decline from the 2021 high of 15.686, the market is pressing into levels that will determine whether a major reversal or deeper downside unfolds.
*Major Resistance Zones*
🔹 0.60 to 0.80 acting as a heavy supply region
🔹 Long term descending trendline still suppressing price
🔹 Monthly EMA cluster maintaining strong overhead pressure
🔹 These levels continue to reject any attempt at reclaiming momentum.
*Key Support Zones*
🔹 0.40 to 0.47 acting as the immediate defense
🔹 0.30 to 0.20 forming the most important macro support
🔹 0.25 to 0.35 also aligning with strong historical demand
🔹 This lower block is the zone that can define the next multi month trend.
*Price Action Snapshot*
🔹 The 0.60 to 0.80 zone has fully flipped into resistance
🔹 Current bullish order block invalidated and structure remains weak
🔹 Monthly candle is down more than 8 percent with fading volume
🔹 Sellers remain in control while buyers show limited strength
🔹 The market is in distribution below resistance and drifting toward major demand.
*Potential Bullish Scenario*
If THETA holds the deeper order block at 0.30 to 0.20, a large upward rally becomes possible.
A strong bounce from this zone opens upside targets toward 1 to 2.
If price later holds above 2, the macro structure supports a long term push back toward the 15 region.
This makes the 0.30 to 0.20 range the most critical accumulation zone on the entire chart. Keep close attention to how price behaves here.
*Directional Bias*
🔹 Bearish while below 0.60
🔹 Break of 0.40 confirms continuation into the deeper demand.
Bullish only with a monthly close above 0.60
Reclaiming that level begins a structural shift.
*Risk Note*
This is a high impact decision zone. Market reaction here will determine the next major leg. Manage exposure with discipline. NFA. DYOR.
Thetausdt

THETA Long Swing Setup – Bullish Divergence & Range Low ReclaimTHETA has formed a strong bullish divergence off a double bottom, following a deep liquidity sweep to $0.56. With price now reclaiming the 20-day SMA, signs point to a local bottom and potential range low deviation.
📌 Trade Setup:
• Entry Zone: $0.70 – $0.75
• Take Profit Targets:
o 🥇 $0.95 – $1.00
o 🥈 $1.60 – $1.72
o 🥉 $2.13 – $2.25
• Stop Loss: Daily close below $0.65

THETAUSDT inverted head and shoulder pattern and bullishTechnical Analysis:
- The current price of THETA is $1.4094 with a 24-hour price change of +8.74% and a 7-day price change of +16.92%.
- The BOLL support price is $1.3374 and the BOLL resistance price is $1.5013.
- Backtesting within the last 7 days shows a bearish MACD pattern with a death cross occurring 6 times. The accuracy of this pattern is 33.33%.
- There are no specific patterns observed in RSI, BOLL, and KDJ indicators within the last 7 days.
- Backtesting within the last 30 days shows no specific patterns in MACD, RSI, BOLL, and KDJ indicators.
Fundamental Analysis:
- Theta (THETA) is a blockchain-powered network designed for video streaming, aiming to disrupt the industry's current challenges such as centralization, poor infrastructure, and high costs.
- Theta features its own native cryptocurrency token, THETA, which performs governance tasks within the network.
- The project is advised by Steve Chen, co-founder of YouTube, and Justin Kan, co-founder of Twitch.
- Theta has notable enterprise validators like Google, Binance, Sony Europe, and Samsung, along with a Guardian network of community-run guardian nodes.
- The market cap of Theta is $1,394,229,082 with a total token supply of 1,000,000,000 and a circulation supply of 1,000,000,000.
THETAUSDT BUYTHETAUSDT Buy at Live Price 1.245
Target and Stop Loss given in the chart
Happy Trading


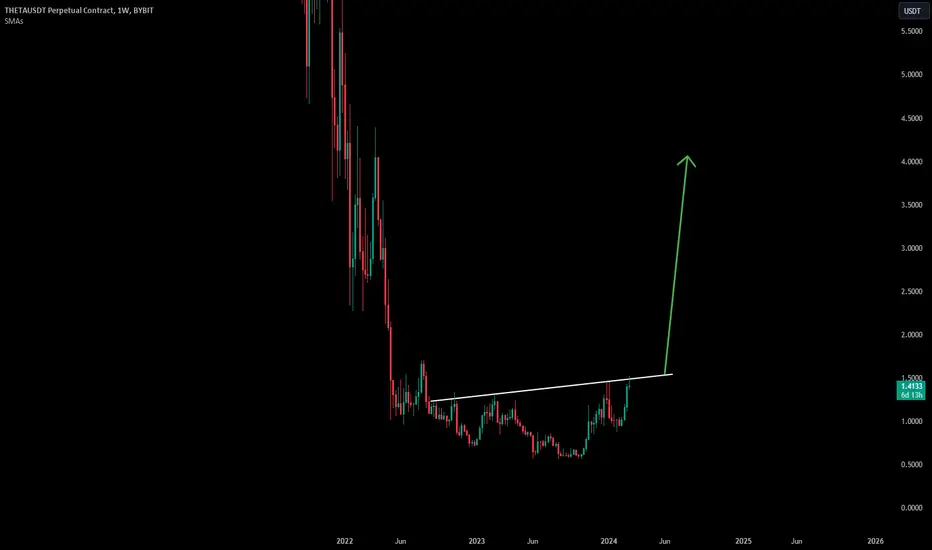
#Theta scalp zone with sup. & resis. 4hr TF#Theta scalp zone with sup. & resis. 4hr TF, finally we break the heavy resistance trend line now we wait for retest then i personally go long. I am not giving you any financial advice just raed the chart for your knowledge

#theta scalping zone support & Resis. 4HrTF#theta scalping zone support & Resis. 4HrTF trade between zone if you want

Theta usdt triangle breakout if btc stay stable theta now take entry those who want to take risk and make big rewards otherwise wait to break triangle then enter safely

THETA USDTTheta coin is forming a descending triangle pattern and a normal triangle. I have mark all trendlines and support and resistance area.
We can buy above 10.585 and project the target for the 15 dollar with the stop loss of 8 dollar.
Thanks

💡Don't miss the great buy opportunity in THETAUSDTrading suggestion:
". There is a possibility of temporary retracement to the suggested support line (6.258).
. if so, traders can set orders based on Price Action and expect to reach short-term targets."
Technical analysis:
. THETAUSD is in a range bound, and the beginning of an uptrend is expected.
. The price is above the 21-Day WEMA, which acts as a dynamic support.
. The RSI is at 67.
Take Profits:
TP1= @ 6.791
TP2= @ 7.028
TP3= @ 7.437
TP4= @ 8.141
TP5= @ 9.543
SL= Break below S2
❤️ If you find this helpful and want more FREE forecasts in TradingView
. . . . . Please show your support back,
. . . . . . . . Hit the 👍 LIKE button,
. . . . . . . . . . Drop some feedback below in the comment!
❤️ Your support is very much 🙏 appreciated! ❤️
💎 Want us to help you become a better Forex / Crypto trader ?
Now, It's your turn !
Be sure to leave a comment; let us know how you see this opportunity and forecast.
Trade well, ❤️
ForecastCity English Support Team ❤️

💡Don't miss the great buy opportunity in THETAUSDTrading suggestion:
". There is a possibility of temporary retracement to the suggested support line (6.425).
. if so, traders can set orders based on Price Action and expect to reach short-term targets."
Technical analysis:
. THETAUSD is in an uptrend, and the continuation of the uptrend is expected.
. The price is above the 21-Day WEMA, which acts as a dynamic support.
. The RSI is at 51.
Take Profits:
TP1= @ 7.528
TP2= @ 8.538
TP3= @ 10.099
TP4= @ 11.338
TP5= @ 13.195
SL= Break below S2
❤️ If you find this helpful and want more FREE forecasts in TradingView
. . . . . Please show your support back,
. . . . . . . . Hit the 👍 LIKE button,
. . . . . . . . . . Drop some feedback below in the comment!
❤️ Your support is very much 🙏 appreciated!❤️
💎 Want us to help you become a better Forex / Crypto trader?
Now, It's your turn!
Be sure to leave a comment; let us know how you see this opportunity and forecast.
Trade well, ❤️
ForecastCity English Support Team ❤️

THETA short term 15-25% profit$THETA is in accumulation in converging triangle or say Bermuda triangle. If we break out the smaller triangle with volume then there can be a max of 28% pump..
Entry at below 9 and take profit 10.5 1st Target and max to 28% from breakout or say 12$.
As at time of publishing idea the RSI is tending to move downward so wait we can get a lower price, but can buy anywhere bellow 9$.
Not a financial advisor.


THETA for Long TermTHETA has about 9 events coming, 4 in month of June, 3 in September and 2 in December. You can invest in Theta networks and Theta GAS as well, try to accumulate from now as the price will surge at start of June. You can short it as well right now, but I will suggest to accumulate and HODL , as by the end of 2021 we assume this at 35-50$ by then if all of there project turns to a success.


THETA/USDT on 30 mins chart.Theta/usdt trading at above 200 Ma, indicating bullish momentum. We believe theta can test the support level again and form a reversal W pattern.

💡 Don't miss the great buy opportunity in Theta TokenTrading suggestion:
. There is a possibility of temporary retracement to suggested support line (1.74). if so, traders can set orders based on Price Action and expect to reach short-term targets.
Technical analysis:
. Theta Token THETAUSDT is in a range bound and the beginning of uptrend is expected.
.The price is above the 21-Day WEMA which acts as a dynamic support.
. The RSI is at 50.
Take Profits:
TP1= @ 2.20
TP2= @ 2.51
TP3= @ 2.78
TP4= @ 3.14
TP5= @ 3.60
SL= Break below S2
❤️ If you find this helpful and want more FREE forecasts in TradingView
. . . . . Please show your support back,
. . . . . . . . Hit the 👍 LIKE button,
. . . . . . . . . . . Drop some feedback below in the comment!
❤️ Your Support is very much 🙏 appreciated! ❤️
💎 Want us to help you become a better Forex trader ?
Now, It's your turn !
Be sure to leave a comment let us know how do you see this opportunity and forecast.
Trade well, ❤️
ForecastCity English Support Team ❤️


THETA/USDT IHS Pattern Formation- Theta/USDT is forming IH&S Pattern on 2-4 HR Timeframe.
- Break of neck line will confirm the pattern.
- Expecting a run of 10-13% after breaking neckline of IH&S Pattern.
- RSI also forming the same pattern.
#Theta

