THETAUSDT inverted head and shoulder pattern and bullishTechnical Analysis:
- The current price of THETA is $1.4094 with a 24-hour price change of +8.74% and a 7-day price change of +16.92%.
- The BOLL support price is $1.3374 and the BOLL resistance price is $1.5013.
- Backtesting within the last 7 days shows a bearish MACD pattern with a death cross oc
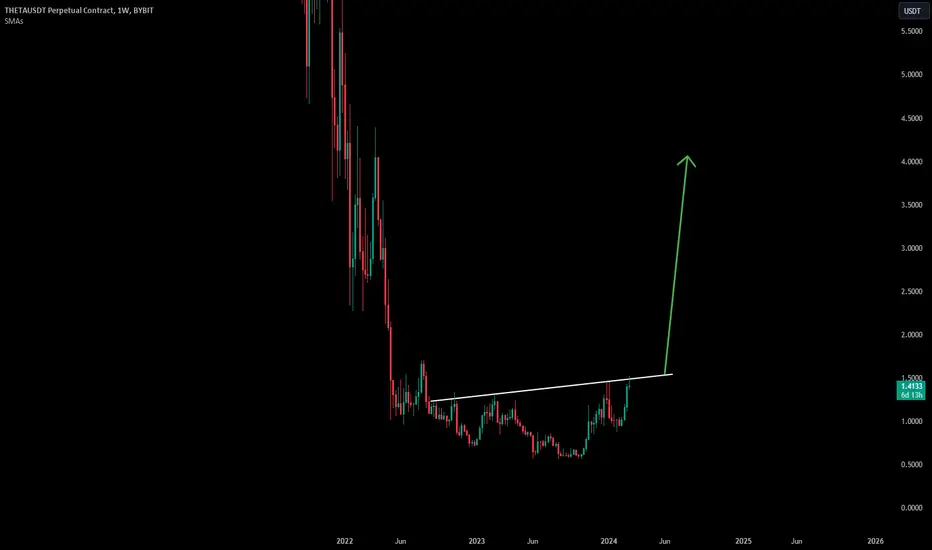
THETA, entry with the greating wavesimilar to grt, as you can see theta is moving in a box shape, and is about to have a strong growth trend in this area. Fasten your seat belt to buy as soon as theta exits the ichimoku cloud

THETA 4H analysis 👀 HEAD & SHOULDER pattern
If close above 0.6687 on 4h time frame ,
It will be good to look for long.
And SL slightly below right shoulder.❌
Tp as mentioned or even higher if big money step in.
Keep watching 👀

THETA USDT Chart is showing interesting moves THETA USDT Chart is showing interesting moves . Detailed explanation video you will get on CITA platform.

$THETA LONGWhen applied Elliott wave theory we have completed 1st impulsive wave (leading diagonal) and ABC correction which is wave2 and now we are currently in wave3
Tp : $1.75 , $1.85

THETAUSDT BUYTHETAUSDT Buy at Live Price 1.245
Target and Stop Loss given in the chart
Happy Trading


💡Don't miss the great buy opportunity in THETAUSD@Theta_NetworkTrading suggestion:
". There is a possibility of temporary retracement to the suggested support line (3.221).
. if so, traders can set orders based on Price Action and expect to reach short-term targets."
Technical analysis:
. THETAUSD is in a range bound, and the beginning of an uptrend is expe

Theta Token may EXPLODE!The theta token seems to be breaking its long term daily downtrend.
30-40% momentum to the upside expected.

#Theta scalp zone with sup. & resis. 4hr TF#Theta scalp zone with sup. & resis. 4hr TF, finally we break the heavy resistance trend line now we wait for retest then i personally go long. I am not giving you any financial advice just raed the chart for your knowledge

See all ideas
Displays a symbol's price movements over previous years to identify recurring trends.
Curated watchlists where THETAUSDT.P is featured.
