Bollinger Bands: How to Stop Being a Slave to the Markets.Bollinger Bands: How to Stop Being a Slave to the Markets.
Bollinger Bands are a technical analysis indicator widely used in trading to assess the volatility of a financial asset and anticipate price movements. Created in the 1980s by John Bollinger, they consist of three lines superimposed on the price chart:
The middle band: a simple moving average, generally calculated over 20 periods.
The upper band: the moving average to which two standard deviations are added.
The lower band: the moving average to which two standard deviations are subtracted.
These bands form a dynamic channel around the price, which widens during periods of high volatility and narrows when the market is calm. When a price touches or exceeds a band, it can signal an overbought or oversold situation, or a potential trend reversal or continuation, depending on the market context.
What are Bollinger Bands used for? Measuring volatility: The wider the bands spread, the higher the volatility.
Identifying dynamic support and resistance zones.
Detecting market excesses: A price touching the upper or lower band may indicate a temporary excess.
Anticipating reversals or consolidations: A tightening of the bands often heralds an upcoming burst of volatility.
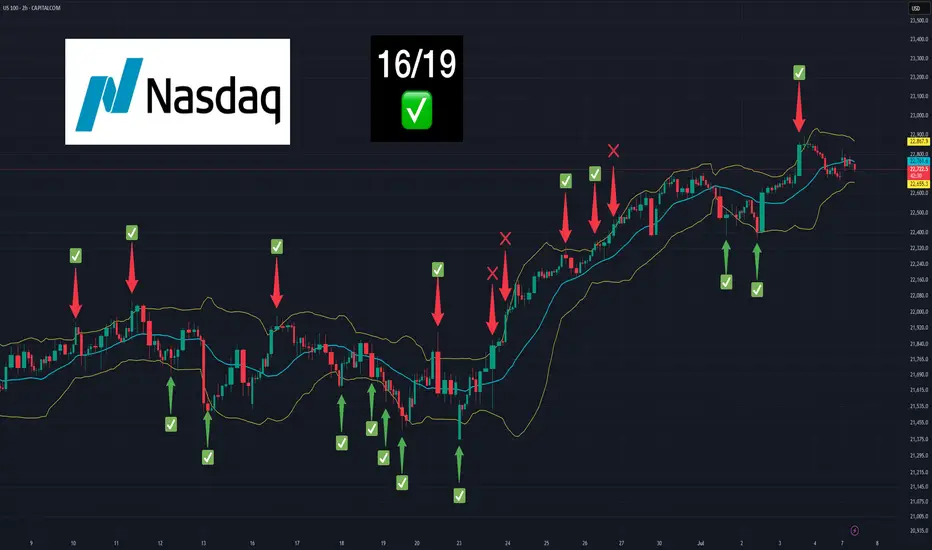
Why is the 2-hour time frame so widely used and relevant?
The 2-hour (H2) time frame is particularly popular with many traders for several reasons:
Perfect balance between noise and relevance: The H2 offers a compromise between very short time frames (often too noisy, generating many false signals) and long time frames (slower to react). This allows you to capture significant movements without being overwhelmed by minor fluctuations.
Suitable for swing trading and intraday trading: This timeframe allows you to hold a position for several hours or days, while maintaining good responsiveness to take advantage of intermediate trends.
Clearer reading of chart patterns: Technical patterns (triangles, double tops, Wolfe waves, etc.) are often clearer and more reliable on H2 than on shorter timeframes, which facilitates decision-making.
Less stress, better time management: On H2, there is no need to constantly monitor screens. Monitoring every two hours is sufficient, which is ideal for active traders who don't want to be slaves to the market.
Statistical relevance: Numerous backtests show that technical signals (such as those from Bollinger Bands) are more robust and less prone to false signals on this intermediate timeframe.
In summary, the 2-hour timeframe is often considered "amazing" because it combines the precision of intraday trading with the reliability of swing trading, providing superior signals for most technical strategies, especially those using Bollinger Bands.
To summarize
Bollinger Bands measure volatility and help identify overbought/oversold areas or potential reversals.
The 2-hour timeframe is highly valued because it filters out market noise while remaining sufficiently responsive, making it particularly useful for technical analysis and trading decision-making.
Thewoozacademy
Real Success Rates of the Falling Wedge in TradingReal Success Rates of the Falling Wedge in Trading
The falling wedge is a chart pattern highly valued by traders for its potential for bullish reversals after a bearish or consolidation phase. Its effectiveness has been extensively studied and documented by various technical analysts and leading authors.
Key Statistics
Bullish Exit: In 82% of cases, the exit from the falling wedge is upward, making it one of the most reliable patterns for anticipating a positive reversal.
Price Target Achieved: The pattern's theoretical target (calculated by plotting the height of the wedge at the breakout point) is achieved in approximately 63% to 88% of cases, depending on the source, demonstrating a high success rate for profit-taking.
Trend Reversal: In 55% to 68% of cases, the falling wedge acts as a reversal pattern, signaling the end of a downtrend and the beginning of a new bullish phase.
Pullback: After the breakout, a pullback (return to the resistance line) occurs in approximately 53% to 56% of cases, which can provide a second entry opportunity but tends to reduce the pattern's overall performance.
False Breakouts: False exits represent between 10% and 27% of cases. However, a false bullish breakout only results in a true bearish breakout in 3% of cases, making the bullish signal particularly robust.
Performance and Context
Bull Market: The pattern performs particularly well when it appears during a corrective phase of an uptrend, with a profit target reached in 70% of cases within three months.
Gain Potential: The maximum gain potential can reach 32% in half of cases during a bullish breakout, according to statistical studies on equity markets.
Formation Time: The wider the wedge and the steeper the trend lines, the faster and more violent the post-breakout upward movement will be.
Comparative Summary of Success Rates:
Criteria Rate ..........................................Observed Frequency
Bullish Exit ........................................................82%
Price Target Achieved ........................................63% to 88%
Reversal Pattern ..............................................55% to 68%
Pullback After Breakout .....................................53% to 56%
False Breakouts (False Exits) ...............................10% to 27%
Bullish False Breakouts Leading to a Downside ..............3%
Points of Attention
The falling wedge is a rare and difficult pattern to correctly identify, requiring at least five contact points to be valid.
Performance is best when the breakout occurs around 60% of the pattern's length and when volume increases at the time of the breakout.
Pullbacks, although frequent, tend to weaken the initial bullish momentum.
Conclusion
The falling wedge has a remarkable success rate, with more than 8 out of 10 cases resulting in a bullish exit and a price target being reached in the majority of cases. However, it remains essential to validate the pattern with other technical signals (volume, momentum) and to remain vigilant against false breakouts, even if their rate is relatively low. When mastered, this pattern proves to be a valuable tool for traders looking for optimized entry points on bullish reversals.
Adverse excursion: a key concept for risk managementAs a professional trader, I can tell you about the adverse excursion and its crucial importance in the world of trading.
Adverse excursion: a key concept for risk management
Adverse excursion refers to the unfavorable movement of the price of an asset after a position is opened. More precisely, it is the difference between the entry price and the worst point the price reaches before the position becomes profitable again or is closed.
Maximum Adverse Excursion (MAE)
The concept of Maximum Adverse Excursion (MAE), developed by John Sweeney, is particularly useful. It measures the maximum floating loss suffered by a position before it turns in your favor or is closed. The MAE is a powerful statistical tool for analyzing drawdowns in an open position.
Trading Efficiency
Using MAE has several benefits for traders:
Optimizing Stop-Loss: By analyzing MAE over a series of trades, the optimal level for placing stop-loss orders can be statistically determined.
Evaluating Trading Systems: MAE helps evaluate the performance of trading systems and identify areas for improvement.
Refining Risk Management Strategies: By understanding the maximum adverse moves, traders can refine their strategies to better preserve their capital.
Improving Trading Efficiency: MAE analysis can help improve decision-making and execute trades with greater accuracy and confidence.
Practical Application
To effectively use the concept of adverse excursion, it is crucial to collect data on a large number of trades. For example, if you observe a series of MAEs like this: 15, 23, 18, 16, 0, 11, 31, 17, 8, 0, 19, 26, 0, 38, 22, you can deduce valuable information about the behavior of your trades and adjust your stop-loss levels accordingly.
In conclusion, the adverse excursion and especially the MAE are powerful tools for any serious trader. They allow to optimize risk management, improve the performance of strategies and make more informed decisions. As they say in the trade, "who controls his risks, controls his profits".
_______
Using the Maximum Adverse Excursion (MAE) has several significant advantages over traditional stop-loss placement methods:
Data-driven optimization
The MAE allows for a more precise and data-driven approach to stop-loss placement:
Statistical analysis: By examining the distribution of the MAE over a large number of trades, the optimal level for placing stop-loss orders can be statistically determined.
Performance visualization: The graphical representation of the MAE provides a clear overview of trade performance, allowing the most effective stop-loss levels to be visually identified.
Balancing protection and performance
The MAE helps to find an optimal balance between capital protection and trading performance:
Retention of winning trades: The stop-loss can be placed to retain 75-85% of winning trades, thus avoiding prematurely cutting potentially profitable positions.
Elimination of large losses: At the same time, this approach eliminates trades that suffer large losses, thus protecting capital.
Adaptation to the specific strategy
The MAE adapts to the unique characteristics of each trading strategy:
Customization: Unlike generic methods, the MAE takes into account the specific behavior of the trades of a given strategy.
Flexibility: This approach can be applied to a variety of strategies, whether short-term trading, swing trading, or long-term positions3.
Improved risk management
Using the MAE contributes to better overall risk management:
Deep understanding: The MAE provides a more nuanced understanding of how trades evolve, allowing for better risk assessment.
Reduced stress: By having a solid basis for placing stop-losses, traders can reduce the stress associated with real-time decision-making.
Complementarity with other tools
The MAE can be used in conjunction with other techniques:
Combination with the MFE: The analysis of the Maximum Favorable Excursion (MFE) in parallel can help to optimize not only the stop-losses, but also the profit-taking.
Cross-validation: The results obtained by the MAE analysis can be compared with those of traditional parameter optimization methods for greater confidence in the strategy.

Real Success Rates of the "Rising Wedge" in TradingReal Success Rates of the Rising Wedge in Trading
Introduction
The rising wedge, also known as the "rising wedge" in English, is a chart pattern that has a remarkable success rate in trading. This analysis details its performance, reliability and complementary indicators to optimize its use.
Success Rate and Performance
-Key Statistics
Overall success rate: 81% in bull markets
Average potential profit: 38% in an existing uptrend
-Breakout Direction
Bearish: 60% of cases
Bullish: 40% of cases
Contextual Reliability
Bull market: 81% success, average gain of 38%
After a downtrend: 51% success, average decline of 9%
Important Considerations
The rising wedge is generally a bearish pattern, indicating a potential reversal.
Reliability increases with the duration of the pattern formation.
Confirmation of the breakout by other indicators, especially volume, is crucial.
Complementary Indicators
-Volume
Gradual decrease during formation
Significant increase during breakout
-Oscillators
RSI (Relative Strength Index): Identifies overbought/oversold conditions
Stochastics: Detects price/indicator divergences
-Moving Averages
Crossovers: Signal trend changes
-Dynamic Support/Resistance: Confirm the validity of the wedge
-Momentum Indicators
MACD: Identifies price/indicator divergences
Momentum: Assesses the exhaustion of the trend
-Other Elements
Fibonacci Levels: Identify potential support/resistance
Japanese Candlestick Analysis: Provides indications of reversals
Conclusion
The rising wedge is a powerful tool for traders, offering a high success rate and significant profit potential. The combined use of complementary indicators increases the reliability of the signal and improves the accuracy of trading decisions. It is essential to look for a convergence of signals from multiple sources to minimize false signals and optimize trading performance.
_______________________________________________
Here are the best times to enter a trade after a rising wedge, in a professional manner:
-The confirmed breakout
Wait for the candle to close below the support line of the wedge.
Look for a significant increase in volume during the breakout to confirm its validity.
-The retest
Look for a pullback on the broken support line, which has become resistance.
Enter when the price rebounds downward on this new resistance, confirming the downtrend.
-The post-breakout consolidation
Identify the formation of a flag or pennant after the initial breakout.
Enter when this mini-formation breaks in the direction of the main downtrend.
-The confirmed divergences
Spot bearish divergences on oscillators such as the RSI or the MACD.
Enter when price confirms divergence by breaking a nearby support.
-Timing with Japanese Candlesticks
Identify bearish formations such as the Evening Star, Bearish Harami, or Dark Cloud.
Enter as soon as the next candle confirms the bearish pattern.
-Important Considerations
Always place a stop-loss to manage risk effectively.
Be patient and wait for the setup to be confirmed before entering the trade
Check the trend on higher timeframes to ensure the consistency of the trade.
Integrate the analysis of the rising wedge with other technical indicators to improve the quality of decisions.
By following these recommendations, traders can optimize their entries on rising wedges while minimizing the risk of false signals.

GARTLEY Harmonic Pattern: How does it work?!GARTLEY Harmonic Pattern: How does it work?!
The "Gartley", as its name suggests, was introduced by Henry Mackinley Gartley.
All other harmonic patterns are modifications of the Gartley.
Its construction consists of 5 waves:
XA: This could be any violent movement on the chart and there are no specific requirements for this movement in order to be a Gartley start
AB: This is opposite to the XA movement and it should be about 61.8% of the XA movement.
BC: This price movement should be opposite to the AB movement and it should be 38.2% or 88.6% of the AB movement.
CD: The last price movement is opposite to BC and it should be 127.2% (extension) of CD if BC is 38.2% of BC. If BC is 88.6% of BC, then CD should be 161.8% (extension) of BC.
AD: The overall price movement between A and D should be 78.6% of XA
How to use it
Point D is where you come in, man! It's your entry signal.
-If it's an M pattern, you buy.
-If it's a W, you sell2.
Where to put your STOP LOSS??
-Below or "X" if you are a BUYER.
-Above "X" if you are a SELLER.
These percentages are based on the famous Fibonacci ratios, as mysterious as the pyramids of Egypt!
Ultimately, the Gartley pattern is like a good Cuban cigar: it requires patience and experience to be appreciated at its true value. But once you master it, it can become a powerful tool in your trading arsenal, as effective as a punch from Rocky Balboa!

The Symmetrical Triangle: Real Success Rates + Breakout.The Symmetrical Triangle: Real Success Rates + Breakout.
The symmetrical triangle is an important chart pattern in technical analysis, deserving special attention from professional traders.
This formation is characterized by a convergence of prices between two trendlines, one descending and the other ascending, creating a consolidation zone where indecision between buyers and sellers is palpable.
Statistical Analysis
Empirical data reveals that the success rate of the symmetrical triangle for a trend continuation is approximately 54%. This percentage, although higher than 50%, underlines the importance of a cautious approach and rigorous risk management in using this pattern.
Breakout Point
The breakout of the symmetrical triangle usually occurs when the price has traveled approximately 75% of the distance to the apex. This point is crucial for traders, as it often represents the moment when volatility increases and a new trend can be established.
Risks and False Exits
It is essential to note that the symmetrical triangle has a relatively high rate of false exits. Statistics indicate that approximately 13% of cases in a bear market can result in a false exit to the bottom. This phenomenon underlines the need for additional confirmation before entering a position.
Strategy of use
To effectively exploit the symmetrical triangle, professional traders must:
-Identify the formation accurately.
-Wait for the breakout near the point of convergence of the trendlines.
-Confirm the breakout with other technical indicators or an increase in volume.
-Put in place strict risk management to protect against false exits.
In conclusion, the symmetrical triangle, although being a valuable tool in the trader's arsenal, requires a methodical approach and a thorough understanding of its characteristics to be used effectively in a trading strategy.

Actual Success Rates of Ascending and Descending TrianglesActual Success Rates of Ascending and Descending Triangles
Here is an analysis of the actual success rates of ascending and descending triangles in trading, based on the information provided:
Success Rates
Ascending and descending triangles generally have fairly high success rates as continuation patterns:
-The ascending triangle has a success rate of approximately 72.77%.
-The descending triangle has a slightly higher success rate of 72.93%.
These numbers come from a study that tested over 200,000 price patterns over a 10-year period.
Factors Influencing Success
Several factors can influence the success rate of these patterns:
-The trader's ability to execute the strategy correctly
-Market conditions at the time the triangle formed
-Market liquidity
-Overall market sentiment
Important Points to Consider
-Triangles are considered reliable continuation patterns, especially in trending markets.
-The ascending triangle in an uptrend is statistically more reliable than the descending triangle.
-To validate the pattern, the price must touch at least twice each of the upper and lower lines.
-An increase in volume during the breakout is an important confirmation sign.
Strategies to improve the chances of success
-Wait for the triangle to fully form before entering a position1.
-Confirm the breakout with a close above/below the resistance/support level.
-Use additional technical indicators to confirm the signal.
-Pay attention to the volume, which should increase during the breakout.
Conclusion
Although ascending and descending triangles have relatively high success rates, it is important to use them in conjunction with other technical analysis tools and to take into account the overall market context to maximize the chances of success.

The “Fan Principle” is a powerful technique in tradingThe “Fan Principle” is a powerful technique in trading, using trendlines to predict price movements.
Highlights
📈 Powerful Technique: The Fan Principle is formidable in technical analysis.
📉 Identifying Points: Drawing trendlines from three key points.
🔴 Trading Signals: Buy or sell signals can be identified depending on the pattern.
📊 Practical Examples: Analyzing price movements on charts to illustrate the technique.
💰 Profit Opportunities: Strategies can result in significant gains, up to 22%.
🛑 Risk Management: Importance of placing stop-losses to protect investments.
🔍 Additional Resources: Detailed information and charts will be shared to deepen understanding.
Key Insights
📈 Technique Effectiveness: The Fan Principle helps identify clear trends using reference points, making the strategy both simple and effective.
📉 Importance of Confirmation: Validating trendlines with a third point builds confidence in trading signals, increasing the chances of success.
🔴 Warning Signals: Sell or buy signals, as shown in the video, can lead to strategic decisions based on historical analysis.
📊 Visual Analysis: Visualizing data on charts helps understand market movements, which is essential for technical analysis.
💰 Profit Potential: Trades based on the Fan Principle can provide significant profit opportunities, highlighting its effectiveness.
🛑 Protection Strategies: Placing stop-losses above resistance points is crucial to limit losses in the event of adverse market movements.
🔍 Access to resources: The information shared in the description and on other platforms offers ways to deepen the understanding of the technique and improve trading skills.
__________________________________________________________________
The fan principle in trading is a strategy that consists of opening several positions on the same asset at different price levels. Here are the main aspects of this approach:
How it works
The idea is to open several positions (or "lots") on the same financial asset at different price levels, thus forming a "fan" of positions.
These positions are opened at points considered as potential market reversals.
The objective is to let these positions unfold like a fan or to close them gradually according to the evolution of the market.
Advantages
Risk diversification: By entering the market at different levels, the trader reduces the impact of a single bad entry.
Movement capture: This approach allows to take advantage of different phases of a price movement.
Flexibility: The trader can adjust his strategy by closing some positions while keeping others open.
Complementary Tools
The fan principle can be combined with other technical analysis tools to improve its effectiveness:
Fibonacci Fan: This tool automatically draws trendlines at key levels (38.2%, 50%, 61.8%) that can serve as entry points for fan positions.
Gann Angles: These lines, drawn at different angles (82.5°, 75°, 71.25°, etc.), can also help identify potential levels to open positions.
RSI (Relative Strength Index): Some traders combine the fan principle with the RSI to confirm entry points.
Important Considerations
This strategy requires good risk management, as it involves opening multiple positions.
It is crucial to set stop-loss and take-profit levels for each position in the range.
Using this approach requires a thorough understanding of the market and significant trading experience.

NVIDIA: Bearish: Possible Head and Shoulders: Warning!NVIDIA: Bearish: Possible Head and Shoulders: Warning!
Hello everyone The Wolf of Zurich has detected a possible "head and shoulder" on Nvidia, which would bring the price down to around $42.
I have also drawn a trend line that you absolutely must watch!
The level to watch is around $98-98
Here, watch your Fibonacci levels as well as your exponential mobile means
Have a nice day everyone
Some information to know about Nvidia:
Nvidia, the world leader in graphics chips and AI, is enjoying a flourishing situation despite a recent drop in its stock price.
Here is a summary of its current situation:
-Dominant position in the AI market
Nvidia occupies a quasi-monopolistic position in the field of chips for artificial intelligence. Its GPUs, especially the H100 series, are essential for the development of cutting-edge AI systems and are selling at high prices around the world.
-Stock market performance
Despite a recent 9.53% drop in its share price, Nvidia has posted an impressive 120% increase since the beginning of the year and nearly 400% over 3 years. This one-off drop does not seem to worry analysts, who still see significant growth potential.
-Technological innovations
Nvidia recently presented its new Blackwell GPU architecture, with the B200 and GB200 processors. These chips promise performance multiplied by 5 compared to the previous generation in the field of AI. The company also reassured investors by announcing that it had resolved the production problems initially encountered.
-Future Outlook
With its dominance in AI training chips and its comprehensive software ecosystem, Nvidia appears well positioned for continued growth. The company continues to innovate and strengthen its position in the AI market, which suggests a positive outlook for the future.

LVMH: Bullish: Butterfly detected.LVMH: Bullish: Butterfly detected.
The price could go down to the PRZ zone indicated on the right chart: 512 to start, then 388 if the Double top plays its role.
This will therefore be a very interesting entry point for investors.
Below: Some information about LVMH.
LVMH (Louis Vuitton Moët Hennessy) is today the world leader in luxury and one of the largest French companies. Here’s a look at where LVMH stands today:
Recent Financial Performance
LVMH recently announced its third-quarter 2023 results, which missed analysts’ expectations
This announcement caused a significant drop in the stock price, which is down more than 20% from its record highs
Market Position
Despite these mixed results, LVMH remains the world’s largest luxury company, with a portfolio of iconic brands including Louis Vuitton, Dior, Givenchy, Kenzo, Moët & Chandon and many others
Structure and Values
LVMH is a family-owned group founded in 1987. Its primary mission is to ensure the long-term development of each of its houses, while preserving their identity and autonomy. The group emphasizes creativity, innovation and excellence in all its products and services. Corporate Strategy
LVMH's strategy is based on the vertical integration of its value chain, from raw material sourcing to selective distribution. This approach aims to ensure the excellence and sustainability of its products.
Social and Environmental Responsibility
LVMH is increasingly committed to ethical, social and environmental initiatives. The group places emphasis on adopting and promoting honest behavior in all its actions and relationships.
Future Outlook
Despite recent challenges, LVMH remains a solid company with long-term growth potential. , like any company in the luxury sector, it is sensitive to global economic fluctuations and changes in consumer habits.

BITCOIN: Bearish - Double TOP + Rising WedgeBITCOIN: Bearish – Double TOP + Rising Wedge
The market could go back down to around $58 000.
In addition, detection of a possible double top on Bitcoin which would bring the price down to around $48 000
Watch for the 50 and 200 exponential moving averages, as well as the Ichimoku levels, and RSI.
be careful

GOLD: Bullish - FLAG detected + Breakout of the range.GOLD: Bullish - FLAG detected + Breakout of the range.
1- A "Head Shoulders" has been detected and we did a perfect Take profit ( TP1) at 2 395$.
2- When we break a range the Take profit should be the Height of the range.
Then the TP2 is expected around 2 518$.
3- Plus we can also consider that the range is like a flag and then the TP3 ( green arrow) is expevted around 3 030$
The red horizontals are retracements regarding ICHIMOKU levels .
However a retracement Fibonacci gives a target lower around 2 100$.
Be careful

NIFTY 50 : Bullish - Ascending flag detected NIFTY 50 : Bullish - Ascending flag detected
To monitor/
The exponential moving averages 50 (in pink)and the exponential moving average 200(in white)
The market could rise around 25 507 .
But be careful there are divergences with the RSI and the ROC ( Rate Of Change), which gives the speed of the variation of the momentum of an underlying!
So a bearish return is possible around 20 000, then 18 150
Be safe!

ETH : 3 important patterns detectedETH : 3 important patterns detected
On the decline :
1- Rising Wedge The price can go lower to 56 000$
_______________________________
On the rise :
2- Falling Wedge : The price can rise to 4 144 $
3- Bullish Pennnat : The price can reach 4 892 $
_________________________________
To monitor :
- EMA.50 and EMA.200
- ICHIMOKU levels : Tenkan and Kijun

TESLA : Bullish - Butterfly-Wolfe Wave-Head Shoulders inverseTESLA : Bullish - Butterfly-Wolfe Wave-Head Shoulders inverse
A butterly was detected since several weeks
We have also a Head shoulders inverse
and a Wolf Wave Bullish
then the market can reach 207 and the 233 $
To monitor the EMA.50 and EMA.200 and ICHIMOKU "kijun"
NB : Divergences ROC and RSI , bullish

US OIL WTI : Bullish - Falling wedges + inverse Head & ShouldersUS OIL WTI : Bullish - 2 falling wedges + Head&Shoulders
Wti crude oil can rise higher because of current geopolitical tensions. OPEC countries have reduced their daily production of barrels of oil.
Technically:
The wolf of Zurich has detected 2 "Falling wedges" and an " inverse head & shoulders" .
These chartist patterns could raise the price of WTI oil around 96$-98$ and even up to 106$ ;
However a divergence with their ROC ( Rate fo Change ) has been detected and we could go back down to the levels indicated on the graph 81$- 79$- 73$ ,and then 67$ dollars.
To monitor EMA.50 and EMA.200 on different timesframes
be careful !
have a good day to all

ADYEN : Many patterns and Divergence ROCADYEN : Many patterns and Divergence ROC
On the Rise : Detection of :
- 2 Falling Wedges
-Gaps to Monitor
On the decline :
-FLAG ( H1)
- Divergence ROC
-ADX and Di bearish signal
-GAPS to monitor

Chrono Trades: Indexes-Stocks- Commodities-FOREX-CRYPTOSChrono Trades: Barometer of financial markets:Indexes-Stocks- Commodities-FOREX-CRYPTOS
A market brief of the different underlyings : FOREX- SP500-Bitcoin-NVIDIA-TAT MOTORS-NIFTI-GOLD-Oil wti- etc...

BTC : BITCOIN: : FLAG + Double Top detectedBTC : BITCOIN: : FLAG + Double Top detected
The Wolf of Zurich has detected 2 chartist famous patterns :
1st is a "Double Top" , which gives a Bearish signal , and the price can reach : 58 000 - 56 500
The second signal is Bullish .
I detected an "ascending FLAG" , which is a Bullish signal;
And the the price can reach 71 200 - 73 00
Watch the EMA.200 Daily and the ICHIMOKU levels around 51 000 Weekly
be safe
Good trades
"PAKA PAKA ! "

TSMC : Bullish - "falling Wedge" and a "BAT" potential.TSMC detection of a "falling Wedge" and a "BAT" potential.
The price could rise and reach the gap upwards towards 147.25 then higher at 156.11
On the downside the market could go down to 135.92 then to 128.76 and finally to 125.27
Additionally, the RSI is divergent with the stock price §
be attentive and monitor the Ichimoku levels

ETH : Bullish possible - SHARK detectedETH : Bullish possible - SHARK detected
A harmonic pattern named "SHARK" has been deteted.
These patterns are used especially by ALL the professional traders, Hedge funds, banks etc...
The Potential Reversal Zone ( PRZ) has been reached ( white rectangle).
Then the price can go to the targets mentionened on the graph : 3 305 - 3 425 - 3 620$
However the rising wedge bearish is still valid!!
Then pleaqse watch the EMA.200 ( Daily).
Be safe.

TATA MOTORS: Bullish - Bullish Pennant detectedTATA MOTORS: Bullish - Bullish Pennant detected
On the rise :
A rising pennant has been detected and the price can go up around 1 108.
Plus we can reach the Gap around 1 018.
On the decline:
However we can monitor the EMA.50 ( pink) at 954, and the EMA.200 around 775.
Plus, for the purists of ICHIMOKU ( weekly) , we can go down to 843.
Watch the divergence with ROC, and the RSI to monitor also.
Be careful

ICICI BANK : Bearish - Rising Wedge detected, and Double TOP ?!ICICI BANK : Bearish - Rising Wedge detected, and Double TOP possible.
To monitor:
The exponential moving averages 50 (in pink) around 991 ,
and the exponential moving average 200(in white) around 793.
A possible Double Top is detected.
+ there are divergences with the RSI and the ROC ( Rate Of Change), which gives the speed of the variation of the momentum of an underlying!
So a bearish return is possible
Be safe!
