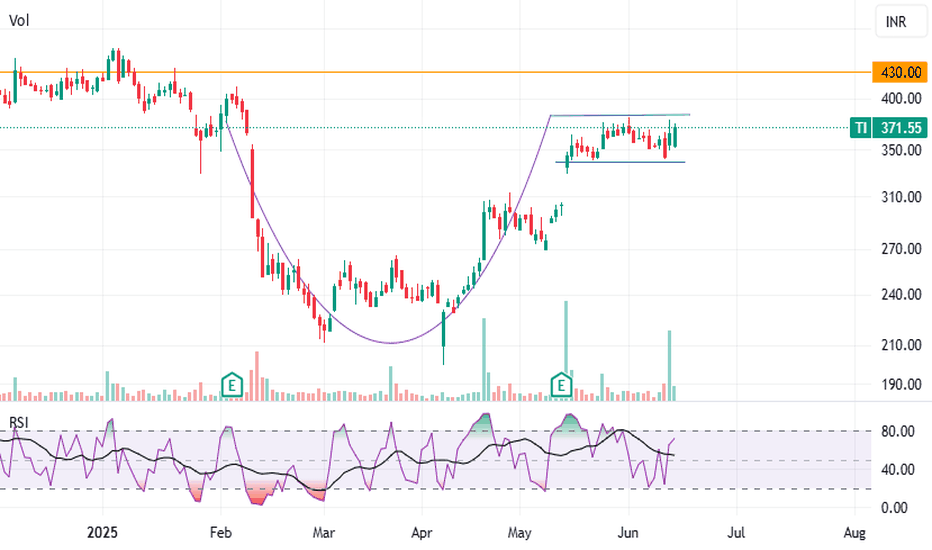
Tilaknagarbuy
TILAKNAGAR INDUSTRIES : Bullish triangleUsually this wave structure forms in an impulsive sequence as wave 4 . It consists of 5 sub waves as wave-a , wave-b , wave-c, wave-d and a final setback wave-e . Each of these waves consists of three wave internal structure. Each of the waves should not break their extreme points. The final confirmation to enter the position comes when the price gets close above the level of wave-d. The minimum target of the pattern is just a poke above the level of wave-b and just above the level of wave-3 of the impulsive count. There is also a guideline to predict the target of this pattern which is known as triangular thrust. The triangular thrust is the measurement of the distance from the level of wave-a to the level of wave-b . This measured length should be kept at the point of completion of wave-e (conservative approach) or to the breakout level of wave-d to get the target of this pattern (aggressive approach).
Trading strategy: Buy on CMP 412, add on dips, keeping the SL of 389 look for the target of 465.
TILAKNAGAR INDUSTR (TI) breakout analysis BUY TILAKNAGAR INDUSTR (TI) has given a breakout of bullish flag and pole pattern to upside.
All important levels have been marked at the chart.
As stock has broke to upside you can generate a buy @LTP.
If we see the volume surge it was massive yesterday. if we enter stock at 230 we can achive the target with
Risk: Reward :: 1 : 3.
Reasons:
Bullish Flag and POLE breakout to upside.
Taking support at the VWAP, indicates good sign to enter.
RSI crossing 60 to upside shows good bullishness.
Successful breakout after 6 months.
High Volume is traded last day, which shows lots of interest in stock buying.
Price > EMAs, shows bulls are more powerful than bears we can make an entry.
Taking successful support at 200 EMA with good buying interest(volume spike).
Verdict:
Strong Bullish
Plan of action:
BUY: 230
Stoploss: 214
Target: 281
Trailing SL: 5


