Postmortem on #BankNifty - 26 SEP 2022BankNifty opened gap down at 39027 breaking the support level of 39327. Tried to recover in the 1st and 3rd candle but the selling pressure was so heavy that it couldnt keep up.
What happened from 9.25 to 11.05 was strong selling that even resulted in the 2nd level of support being taken out.
This is the 2nd time that BN is taking out 2 support levels in the same day, which really talks about the situation we are in.
From 11.10 to 13.10 BN made a good recovery breaking through the new resistance line of 38698, for a moment this recovery looked more promising than the first 15mts.
The level of shorting was very much evident with the volume of OTM CE traded today. This could be the reason that the pullback was dozed off at 13.15 and also at 14.25
The final closing was just below the support line, as pointed out BN has taken out 2 support lines today which should be an event to look for this week.
The 5mts TF for the previous days - shows bearishness.
TradingView Chart
1hr TF starting to show the bearishness now, esp when the session had a good gap down. remember what i said with the 38700 support level on 23rd - click here
TradingView Chart
Bank nifty important support and resistance lines
s1:37946, s2: 37247
r1: 38698, r2: 39326
more ideas at viswaram.substack.com
no predictions, no trade recommendations !
TIPS

Niftybank 22 September closing Banknifty nutral points 40888to 41067
R1 41248
R2 41478
R3 41837
S1 40626
S2 40289
S3 40000
Important point
1.We are not SEBI registered advisor.
2. Theses support and resistance is for education purpose only.
3. We are not responsible for any profit and losses.
4. Kindly take trade according to your risk appetite.

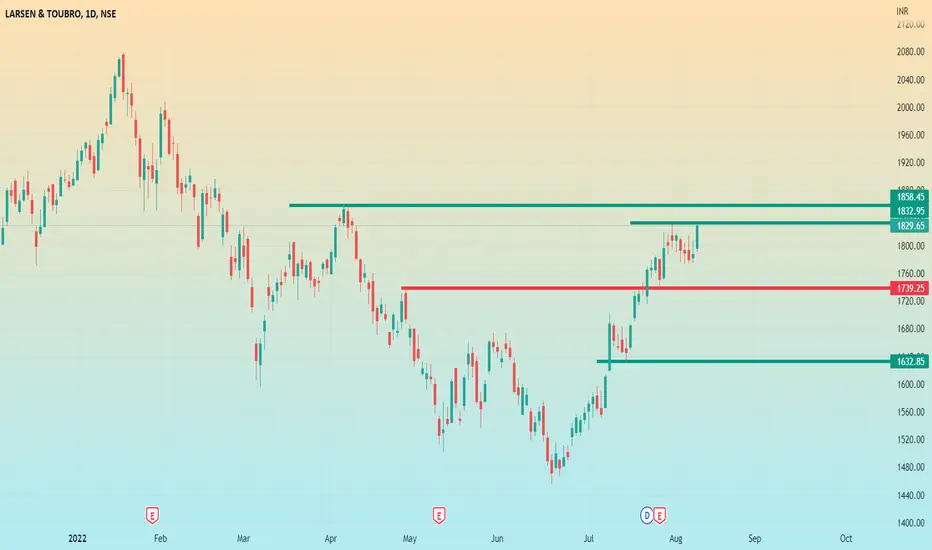
LT share analysis and my viewthis share is looking good above 1858. LT is a good momentum share and it follow technical very well. this share is also for swing traders.
RELIANCE Wait And Watch ??
Look for Low risk, High reward, and High Probability setups-
Things to Remember while Trading with the Trend
1. Know what the trend is.
2. The best trades are made in the direction of the trend.
3. Assume that the main trendline or moving average will hold.
4. The longer the moving average is, the better it defines the trend.
5. Wait for the pullback.
6. Don’t chase the market.
7. Don’t fight the market.
8. Even in the strongest trends there should be some retracement.
9. The closer the market is to the trendline, the better the risk/reward ratio is.
10. Use ADX to determine the strength of the trend.
11. Higher the level of ADX , the stronger the trend, below 20 consider the market to be choppy
12. Hold trades longer in a strong trend.
13. Wait for confirmation of a trendline breaking before reversing position.
14. Know where the Support levels are.
15. Place stops outside the Support levels.
Thank You..

BankNifty is Good for short below 33500BANKNIFTY can be shorted below 33500
It is showing a negative pattern in higher time frame

NIFTY BANK FORMING INVERTED POLE AND FLAG PATTERNNifty Bank has formed inverted POLE AND FLAG PATTERN if it breaks the level it will go down. As market is negative in HIGHER TIME FRAME
#banknifty

BankniftyGood Morning Everyone 🌾🤝
Banknifty - currently progressing subwave C, once the c wave will complete, then we will expect 5 correction. banknifty

NIFTY INTRADAY SUPPORT & RESISTANCE LEVELS FOR [20-05-2022]NSE:NIFTY
Nifty analysis important levels are marked on the chart.
please always trade with stop loss to avoid big drawdown.
happy trading & keep learning.

Nifty End of Day Study & Chart Analysis for Day Trading Get Nifty Direction With Option Chain Analysis For Moe Details Search in Google - Manoj Shinde 27485

ACC NEAR BREAKOUT (FOR SWING TRADE) According to news,
Cement prices expected to rise further on rising raw material cost
SO KEEP EYE ON CEMENTS STOCKS,
ACC CEMENT FOR BUYING ABOVE 2239,
ONLY BUY IF GIVES BREAKOUT ABOVE EXPECTED LEVEL..
𝘿𝙄𝙎𝘾𝙇𝘼𝙄𝙈𝙀𝙍-
Trade On Side of Market And if you find that trend is week then you can exit before target.
Do Your Own Study Before Taking Any Decision All These Charts Are For Learning Purpose.
Wait For Breakout Before Entering A Trade, Wait for Your Levels Before Entering A trade.
𝘿𝙊 𝙔𝙊𝙐𝙍 𝙊𝙒𝙉 𝘼𝙉𝘼𝙇𝙔𝙎𝙄𝙎 𝘽𝙀𝙁𝙊𝙍𝙀 𝘽𝙐𝙔𝙄𝙉𝙂...

HDFC Life up for a good moveHDFC Life has been in a correction for over 6 months.
RSI and price made positive divergence, and price consolidated for a few trading sessions at the low level.
Yesterday's big green candle has broken out but has average volumes.
if the price sustains above the upper level marked on the chart, it will be a good buy for swing trade.
SL- Low of the breakout candle/ swing low made before the breakout candle
Target - Open
Not buy/sell advice, just an observation

Banknifty Options Analysis StrategiesStay ready for big move. Banknifty do or die NSE:BANKNIFTY big resistance big support zone get ready for big profit

BankNifty Daily zones for 25th MARCHEverything you need to know are marked in charts..
The only thing i have to tell you is always know your risk and plan the trades and follow proper risk management.
Trade Responsibly. Don't bust your capital.


IINDIABULLS HOUSING LOOKS WEAK BELOW 192The stock looks weak below 192 for the marked targets on the chart.
To motivate us, Please like the idea If you agree with the analysis.
Happy Trading!
InvestPro India Team

holding idea in techmrunning ar a discounted price
taking reversal from 200 DMA
short term channel breakout with big green candle
IT stocks are going to be in focus

SHORT- in REKLIANCE !!!#FRIDAY#
#INTRADAY#
@VK2413
NSE:RELIANCE
{
INDIAN MARKETS WILL BE OPENING WITH MINIMUM 1% DOWN (GAP DOWN ).
reliance being one of 50 companies, its shares will be affected too.
Today even a short profit booking will also can be seen in RELIANCE !
Targets, trigger-price, stop-loss are provided in chart!
HAPPY TRADING !
}
Fallow @VK2413 ,like👍SHARE❤️,✌️

Hindustan Unilever Ltd - 11.02.2022Hindustan Unilever Ltd - 11.02.2022
The stock is trading @ 2258 levels
There is a STRONG SUPPORT @ 2250
The prices are below EMA
There is a SPINNING TOP in Weekly Chart
RSI is 40 in Weekly Chart
Let the prices go above 2281, one can initiate a BUY position with Support @ 2222
Watch out for the price action

Simple Trade Setup | RELIANCE | 09-02-2022 [INTRADAY]NSE:RELIANCE
Trade Setup for 09-02-2022
1) Don't Jump in to trade at the beginning of the market. Let it get settle for 15-20min first and judge the price action.
2) Everything is mentioned on the chart. I hope it is easy to understand.
3) All the levels will work as support, resistance, entry and exit w.r.t price action near that level.
4) Avoid gap up or gap down chase. Wait and trade between levels.
Please refer below chart for levels.
Hope I made it easy to understand it.
Do comment your doubt or suggestion.
Note: Trade with Strict SL. It may or may not hit all the levels. So one can book profit / loss at respective level considering how price action works near that level.

TATASTEEL READY FOR ATH?TATASTEEL can give good upside move above 1229 zone R:R the setup can be used for positional trade.
SL and Targets mentioned in the chart.

BankNifty ShortI hope you can now see how Banknifty represents an excellent low risk profit entry setup allowing you to trade in the market. Take positions so that the risk/reward is in your favor.
Knowing why, where & when a strong reversal signal is being generated will be the only way to capitalize on your technical analysis .
Disclaimer: It should not be assumed that the methods, techniques, or indicators presented in these chart will be profitable or that they will not result in losses. There is no assurance that the strategies and methods presented will be successful for you. Past results are not necessarily indicative of future results. You should not trade with money that you cannot afford to lose. Examples presented in these charts are for educational purposes only and it should not be assumed that these are indicative of ordinary trades. These setups are not solicitations of any order to buy or sell. The publisher assume no responsibility for your trading results. There is a high degree of risk in trading.

HINDUNILVR : Ready for Daily BOHINDUNILVR : Ready for Daily BO
Like, Share, Comment for regular updates.
Disclaimer
I am not sebi registered analyst
My studies are Educational purpose only
Please consult with your Financial advisor before trading or investing
