NIFTY TOMORROW PREDICTION NIFTY makes Head and shoulder pattern in 1H Time frame ..........if it's breaking the levels then We will see in negetive movement in market...
Nifty 50 has broken through the floor of a rising trend channel in the short term. This indicates a slower rising rate at first, or the start of a more horizontal development. The index has broken a head and shoulders formation. A decisive break, preferably with increasing volume, is considered a confident signal of the start of a falling trend. The index has broken down through support at points 25000. This predicts a further decline. RSI below 30 shows that the momentum of the index is strongly negative in the short term. Investor have steadily reduced the price to sell the index, which indicates increasing pessimism and continued falling prices. However, particularly in big stocks, low RSI may be a sign that the stock is oversold and that there is a chance for a reaction upwards. The index is overall assessed as technically negative for the short term.
Tomorrow

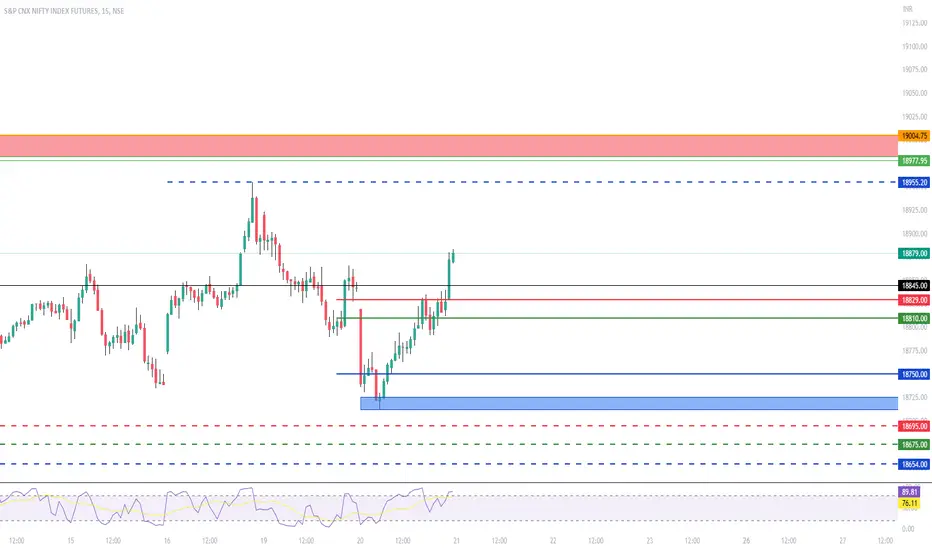
Nifty 50 - 27 June 2023
Live market, Post market analysis and Next trading session's Detailed Analysis has been posted in my YouTube channel.
Please do watch my old videos in Daily Analysis Playlist to understand the Entry and Exit criteria.
Do follow and subscribe if you like the analysis.
I expect the market to be Bullish tomorrow.
Trade or invest according to your analysis. This is just my view.
<----- 3MRT Trading ----->

BankNifty - 26 June 2023Post market analysis and Next trading session's Detailed Analysis has been posted in my YouTube channel.
Please do watch my old videos in Daily Analysis Playlist to understand the Entry and Exit criteria.
Do follow and subscribe if you like the analysis .
I expect the market to be Bullish tomorrow.
Trade or invest according to your analysis . This is just my view.
<----- 3MRT Trading ----->

Nifty 50 - 26 June 2023Post market analysis and Next trading session's Detailed Analysis has been posted in my YouTube channel.
Please do watch my old videos in Daily Analysis Playlist to understand the Entry and Exit criteria.
Do follow and subscribe if you like the analysis .
I expect the market to be Bullish tomorrow.
Trade or invest according to your analysis . This is just my view.
<----- 3MRT Trading ----->

BankNifty - 23 June 2023Detailed Analysis has been posted in my YouTube channel.
Do follow and subscribe if you like the analysis.
I expect the market to be Bearish tomorrow.
Trade or invest according to your analysis. This is just my view.
<----- 3MRT Trading ----->

Nifty Futures 22nd June 2023Let's see how the day opens tomorrow. Price action should be watched, and a decision taken accordingly.
Will try and give some live market updates.
Keep following to understand the significance of these lines drawn and how and why these lines are very important.
Please go through the previous charts and check the price action and how these lines responded vis a vis the days open
Bank nifty Futures 22nd June 2023Let's see how the day opens tomorrow. Price action should be watched, and a decision taken accordingly.
Will try and give some live market updates.
Keep following to understand the significance of these lines drawn and how and why these lines are very important.
Please go through the previous charts and check the price action and how these lines responded vis a vis the days open

BankNifty - 21 June 2023Detailed Analysis has been posted in my YouTube channel.
Do follow and subscribe if you like the analysis .
I expect the market to be Bullish tomorrow.
Trade or invest according to your analysis. This is just my view.
<----- 3MRT Trading ----->

Nifty 50 - 21 June 2023Detailed Analysis has been posted in my YouTube channel.
Do follow and subscribe if you like the analysis .
I expect the market to be Bullish tomorrow.
Trade or invest according to your analysis. This is just my view.
<----- 3MRT Trading ----->

BankNifty - 20June 2023Detailed Analysis has been posted in my YouTube channel.
Do follow and subscribe if you like the analysis.
I expect the market to be Bullish tomorrow.
Trade or invest according to your analysis. This is just my view.
<----- 3MRT Trading ----->

Nifty - 14 June 2023Detailed Analysis has been posted in my YouTube channel.
Do follow and subscribe if you like the analysis.
I expect the market to be Bullish tomorrow.
Trade or invest according to your analysis. This is just my view.
<----- 3MRT Trading ----->

BankNifty - 14 June 2023Detailed Analysis has been posted in my YouTube channel.
Do follow and subscribe if you like the analysis.
I expect the market to be Bullish tomorrow.
Trade or invest according to your analysis. This is just my view.
<----- 3MRT Trading ----->

Nifty Futures 14th June 2023I have posted enough Charts here for one to see how the price responds at the lines marked.
We can go down to lower Time frames of 5 min and 3 min to study the price action .
It would be very interesting to observe what happens when
1. Price opens within the range marked of Red, Blue and Green Lines.
2. Price opens below / above the range but within the range of the previous day
3. When there is a Gap up and Gap down opening.
Constant visualization and practice makes one familiar with what type of price action can come and what type of the day it can be.
The dotted lines can be tagged by price as these are untouched area where price can probably reach depending upon upward or downward movement.
Further studying the OI and unwinding on either side can help in deciphering a directional move. Along with the charts the study becomes more interesting.
14 hours ago
Comment:
If You are studying the charts in lower Time frames and observing price action, Let me know in comments your observations on the points 1,2 and 3 mentioned above.

Nifty Futures Levels 14th June 2023I have posted enough Charts here for one to see how the price responds at the lines marked.
We can go down to lower Time frames of 5 min and 3 min to study the price action .
It would be very interesting to observe what happens when
1. Price opens within the range marked of Red, Blue and Green Lines.
2. Price opens below / above the range but within the range of the previous day
3. When there is a Gap up and Gap down opening.
Constant visualization and practice makes one familiar with what type of price action can come and what type of the day it can be.
The dotted lines can be tagged by price as these are untouched area where price can probably reach depending upon upward or downward movement.
Further studying the OI and unwinding on either side can help in deciphering a directional move. Along with the charts the study becomes more interesting.
14 hours ago
Comment:
If You are studying the charts in lower Time frames and observing price action, Let me know in comments your observations on the points 1,2 and 3 mentioned above.

Bank Nifty Future Levels 13th June 2023I have posted enough Charts here for one to see how the price responds at the lines marked.
We can go down to lower Time frames of 5 min and 3 min to study the price action .
It would be very interesting to observe what happens when
1. Price opens within the range marked of Red, Blue and Green Lines.
2. Price opens below / above the range but within the range of the previous day
3. When there is a Gap up and Gap down opening.
Constant visualization and practice makes one familiar with what type of price action can come and what type of the day it can be.
The dotted lines can be tagged by price as these are untouched area where price can probably reach depending upon upward or downward movement.
Further studying the OI and unwinding on either side can help in deciphering a directional move. Along with the charts the study becomes more interesting.

Nifty Futures Levels 13th June 2023I have posted enough Charts here for one to see how the price responds at the lines marked.
We can go down to lower Time frames of 5 min and 3 min to study the price action .
It would be very interesting to observe what happens when
1. Price opens within the range marked of Red, Blue and Green Lines.
2. Price opens below / above the range but within the range of the previous day
3. When there is a Gap up and Gap down opening.
Constant visualization and practice makes one familiar with what type of price action can come and what type of the day it can be.
The dotted lines can be tagged by price as these are untouched area where price can probably reach depending upon upward or downward movement.
Further studying the OI and unwinding on either side can help in deciphering a directional move. Along with the charts the study becomes more interesting.

Bank Nifty - 13 June 2023Detailed Analysis has been posted in my YouTube channel.
Do follow and subscribe if you like the analysis.
I expect the market to be Bullish tomorrow.
Trade or invest according to your analysis. This is just my view .
<----- 3MRT Trading ----->

Nifty - 13 June 2023Detailed Analysis has been posted in my YouTube channel.
Do follow and subscribe if you like the analysis.
I expect the market to be Bullish tomorrow.
Trade or invest according to your analysis. This is just my view .
<----- 3MRT Trading ----->

BankNifty Futures Levels 12.06.23I have posted enough Charts here for one to see how the price responds at the lines marked.
We can go down to lower Time frames of 5 min and 3 min to study the price action .
It would be very interesting to observe what happens when
1. Price opens within the range marked of Red, Blue and Green Lines.
2. Price opens below / above the range but within the range of the previous day
3. When there is a Gap up and Gap down opening.
Constant visualization and practice makes one familiar with what type of price action can come and what type of the day it can be.
The dotted lines can be tagged by price as these are untouched area where price can probably reach depending upon upward or downward movement.
Further studying the OI and unwinding on either side can help in deciphering a directional move. Along with the charts the study becomes more interesting.

Nifty Futures 11th June 2023I have posted enough Charts here for one to see how the price responds at the lines marked.
We can go down to lower Time frames of 5 min and 3 min to study the price action .
It would be very interesting to observe what happens when
1. Price opens within the range marked of Red, Blue and Green Lines.
2. Price opens below / above the range but within the range of the previous day
3. When there is a Gap up and Gap down opening.
Constant visualization and practice makes one familiar with what type of price action can come and what type of the day it can be.
The dotted lines can be tagged by price as these are untouched area where price can probably reach depending upon upward or downward movement.
Further studying the OI and unwinding on either side can help in deciphering a directional move. Along with the charts the study becomes more interesting.

Bank Nifty - 12 June 2023Detailed Analysis has been posted in my YouTube channel.
Do follow and subscribe if you like the analysis.
I expect the market to be Bearish tomorrow.
Trade or invest according to your analysis. This is just my view.
<----- 3MRT Trading ----->

Nifty - 09 June 2023Detailed Analysis has been posted in my YouTube channel.
I expect the market to be Bearish tomorrow.
Trade or invest according to your analysis. This is just my view.
<----- 3MRT Trading ----->

Nifty Futures Levels 8th June 2023Special markings in Red, blue and Green solid lines are very important areas and opening of the trade in the morning gives us a reasonable idea along with other factors as to how the day should proceed.
If you have been following the levels from the previous charts by now you would have seen the importance of how correctly marked areas worked .
we can visualize from the chart where a trade with defined risk can be taken.
The dotted lines in red blue and green can be tagged incase of a break on either side. The dotted lines ate the untouched VAH, VAL or poc which can be tagged.
If you carefully watch the previous charts you will understand how the dotted lines get tagged during the course of the day
Keep following for live market updates.
Follow the chart in 5 min and 3 min time frame also
