Trading Master Class With Experts1. What Are Options?
Options are financial contracts that give traders the right, but not the obligation, to buy or sell an asset (like stocks, indices, or commodities) at a pre-decided price within a specific time frame. Unlike shares, which represent ownership, options are derivatives whose value comes from the price of the underlying asset.
Call Option → Right to buy at a fixed price.
Put Option → Right to sell at a fixed price.
This flexibility makes options useful for speculation, hedging, and income strategies.
2. Key Terminologies in Options
To trade options, one must understand the language of the market:
Strike Price → The price at which the option buyer can buy/sell the underlying.
Premium → The cost paid to buy an option.
Expiry Date → The last date the option can be exercised.
In-the-Money (ITM) → Option has intrinsic value (profitable if exercised now).
Out-of-the-Money (OTM) → No intrinsic value (worthless if exercised now).
Mastering these terms is crucial to avoid confusion while trading.
3. How Option Trading Works
Let’s simplify with an example:
Suppose Reliance stock is trading at ₹2,500. You buy a Call Option with a strike price of ₹2,600 by paying a premium of ₹50.
If Reliance rises to ₹2,700, your option value increases (you gained ₹100 – ₹50 = ₹50 profit).
If Reliance stays below ₹2,600, your option expires worthless, and you lose only the premium (₹50).
This shows how options can provide high reward with limited risk.
4. The Players in Option Trading
There are two main participants:
Option Buyers → Pay a premium, have limited risk but unlimited profit potential.
Option Sellers (Writers) → Receive premium, have limited profit but unlimited risk exposure.
Example: If you sell a call option and the stock skyrockets, your losses can be massive. That’s why option writing requires deep knowledge and strong risk management.
5. Benefits of Option Trading
Why do traders choose options over stocks?
Leverage → Control a large value of assets with small capital (premium).
Hedging → Protects portfolios from sudden market crashes.
Flexibility → Can profit in bullish, bearish, or even sideways markets.
Defined Risk for Buyers → Maximum loss is only the premium paid.
This versatility makes options a favorite tool among professional traders.
6. Risks Involved in Option Trading
Though attractive, options are not risk-free:
Time Decay (Theta) → Option value reduces as expiry approaches, even if stock price doesn’t move.
High Volatility → Sudden market swings can cause rapid premium erosion.
Unlimited Loss for Sellers → Writers can lose far more than the premium received.
Complex Pricing → Influenced by multiple factors (volatility, time, demand-supply).
Hence, proper strategy and discipline are vital.
Trade!

Part 7 Trading Master Class1. Risk Management in Options Trading
Risk is both the biggest appeal and the biggest danger in options trading. Without proper risk management, traders can face massive losses.
Key practices include:
Position Sizing: Never risking more than a small percentage of capital on a single trade.
Stop-Loss Orders: Exiting positions when losses exceed tolerance levels.
Diversification: Spreading trades across different sectors or instruments.
Hedging: Using options not for speculation but for protection of a stock portfolio.
Awareness of Leverage: Remembering that leverage can magnify both gains and losses.
Professional traders always prioritize risk management over profit chasing.
2. Role of Options in Hedging and Speculation
Options serve dual purposes:
Hedging
Companies hedge currency risks using currency options.
Investors hedge stock portfolios by buying index puts.
Commodity traders hedge raw material costs with commodity options.
Speculation
Traders can take leveraged bets on short-term price movements.
Bullish traders buy calls; bearish traders buy puts.
Volatility traders deploy straddles/strangles to benefit from sharp moves.
This dual nature — protection and profit — makes options invaluable across markets.
3. Options in Global and Indian Markets
Globally, option trading is massive. Exchanges like CBOE (Chicago Board Options Exchange) pioneered listed options. The U.S. markets dominate in volume and liquidity.
In India, options gained traction after NSE introduced index options in 2001. Today:
Nifty and Bank Nifty options are among the most traded derivatives worldwide.
Stock options are actively traded with physical settlement.
Weekly expiry contracts have boosted retail participation.
India is now among the top markets for derivatives trading globally.
4. Challenges, Risks, and Common Mistakes
Despite their potential, option trading is not easy. Challenges include:
Complexity: Requires understanding of pricing models and Greeks.
High Risk for Sellers: Unlimited potential losses.
Time Decay: Buyers must be right not only about direction but also timing.
Liquidity Issues: Illiquid contracts can result in slippage.
Common mistakes traders make:
Overleveraging with large positions.
Ignoring Greeks and volatility.
Trading without a defined plan or exit strategy.
Chasing profits without managing risk.
Awareness of these pitfalls is crucial for long-term success.
5. The Future of Option Trading and Final Thoughts
The world of options is evolving rapidly. With technology, AI-driven strategies, and algorithmic trading, options are becoming more accessible and efficient. Platforms now offer retail traders tools once exclusive to institutions.
In India, the increasing popularity of weekly options and innovations like zero brokerage discount brokers have democratized option trading. Globally, options tied to cryptocurrencies and ETFs are gaining popularity.
However, while opportunities expand, the fundamentals remain unchanged: options are powerful, but they demand respect, knowledge, and discipline.
In conclusion, option trading is not just about making fast money. It’s about using financial intelligence to structure trades, manage risks, and optimize outcomes in an uncertain market.

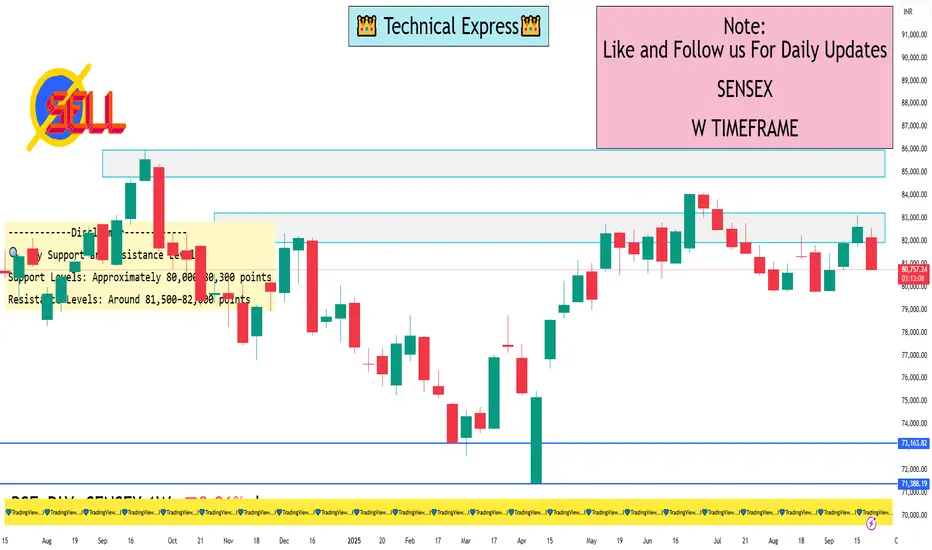
SENSEX 1 Week View📉 Weekly Technical Overview (as of Sep 26, 2025)
Current Level: Approximately 80,782.73 points
Weekly Decline: ~2,000 points, reflecting a drop of about 2.35%
Technical Indicators:
Relative Strength Index (RSI): The RSI is currently in the oversold zone, indicating potential for a short-term rebound if buying interest returns
Moving Averages: Technical analysis suggests a bearish trend, with moving averages signaling a "strong sell" outlook
Pivot Points: Key support and resistance levels are being closely monitored to gauge potential reversal points
🔍 Key Support and Resistance Levels
Support Levels: Approximately 80,000–80,300 points
Resistance Levels: Around 81,500–82,000 points
These levels are crucial for determining the market's short-term direction. A break below support may indicate further downside, while a move above resistance could signal a potential recovery.
📈 Outlook
While the short-term technical indicators suggest a bearish trend, the oversold conditions and key support levels imply that the market may be due for a corrective bounce. However, the ongoing geopolitical tensions and trade-related uncertainties could continue to exert downward pressure on the index.
Investors are advised to monitor the upcoming trading sessions closely, as a decisive move above or below the established support and resistance levels could provide clearer signals for the next phase of market movement.
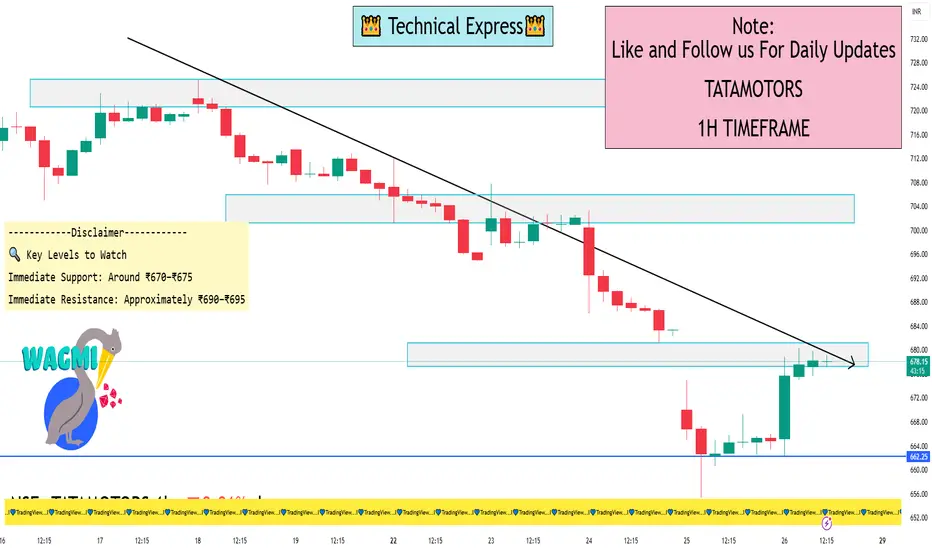
TATAMOTORS 1 Hour ViewOn the 1-hour chart, Tata Motors exhibits a neutral trend, indicating indecision in the short term. Key technical indicators are as follows:
Relative Strength Index (RSI): Approximately 50, suggesting balanced buying and selling pressures.
Moving Averages: The stock is trading near its short-term moving averages, with no clear bullish or bearish crossover.
Volume: Trading volume is consistent with recent averages, showing no significant spikes.
Given these indicators, the stock is consolidating within a range, awaiting a catalyst for a directional move.
🔍 Key Levels to Watch
Immediate Support: Around ₹670–₹675. A breakdown below this level could lead to a retest of ₹650.
Immediate Resistance: Approximately ₹690–₹695. A breakout above this zone may target ₹720–₹730.
⚠️ Market Context
The recent uptick follows a challenging period marked by a cyberattack at Jaguar Land Rover, which had a significant financial impact. While operations are resuming, the stock remains sensitive to further developments.
Part 1 Ride The Big Moves 1. Introduction to Option Trading
Option trading is one of the most versatile and dynamic segments of financial markets. Unlike traditional equity trading, where investors directly buy or sell shares, options give the right, but not the obligation, to buy or sell an underlying asset at a predetermined price on or before a specific date. This flexibility allows traders to hedge risks, speculate on market movements, and design strategies for income generation or protection against adverse price movements.
Options are derivative instruments, meaning their value derives from an underlying asset, which can be stocks, indices, commodities, currencies, or ETFs. The global options market has grown exponentially over the last few decades due to its ability to provide leverage, risk management tools, and strategic investment opportunities for both retail and institutional traders.
2. Basic Concepts of Options
To understand options trading, it’s essential to grasp some foundational concepts:
2.1 What is an Option?
An option is a contract that grants the holder the right, but not the obligation, to buy or sell a specific asset at a predetermined price (called the strike price) within a defined period (expiry date).
Call Option: Gives the holder the right to buy the underlying asset at the strike price.
Put Option: Gives the holder the right to sell the underlying asset at the strike price.
2.2 Key Terminology
Underlying Asset: The security on which the option is based.
Strike Price / Exercise Price: The price at which the underlying asset can be bought or sold.
Expiry Date: The date on which the option contract expires.
Premium: The price paid by the buyer to the seller for the option.
In-the-Money (ITM): Option has intrinsic value (e.g., a call option where strike price < current market price).
Out-of-the-Money (OTM): Option has no intrinsic value (e.g., a call option where strike price > current market price).
At-the-Money (ATM): Option strike price is approximately equal to the market price.
3. Types of Options
Options can be broadly categorized based on style, market, and underlying asset.
3.1 Based on Style
American Options: Can be exercised anytime before expiry.
European Options: Can only be exercised on the expiry date.
Bermuda Options: Can be exercised on specific dates prior to expiry.
3.2 Based on Market
Exchange-Traded Options (ETOs): Standardized contracts traded on regulated exchanges.
Over-The-Counter Options (OTC): Customized contracts traded directly between parties.
3.3 Based on Underlying Asset
Equity Options: Based on individual stocks.
Index Options: Based on market indices like Nifty, Sensex, S&P 500.
Commodity Options: Based on commodities such as gold, oil, or agricultural products.
Currency Options: Based on foreign exchange rates.
ETF Options: Based on exchange-traded funds.
4. How Options Work
Option trading involves two parties: the buyer and the seller (writer).
Buyer (Holder): Pays the premium and holds the right to exercise the option.
Seller (Writer): Receives the premium and has the obligation to fulfill the contract if the option is exercised.
For example:
Buying a call option gives the potential to profit if the underlying asset's price rises.
Buying a put option profits if the underlying asset's price falls.
Selling options can generate premium income but carries higher risk.

Introduction to Sector Rotation Strategies in Trading1. Understanding Sector Rotation
Sector rotation is a trading strategy used by investors and traders to capitalize on the cyclical movements of different sectors of the economy. The concept stems from the observation that economic conditions, business cycles, and market sentiment affect various sectors differently at different stages of the cycle. By identifying which sectors are likely to outperform in a given phase, traders can allocate capital strategically to maximize returns.
The financial markets are influenced by macroeconomic factors such as interest rates, inflation, consumer spending, corporate earnings, and geopolitical events. These factors create patterns of performance among different sectors—technology, healthcare, financials, energy, consumer discretionary, consumer staples, industrials, materials, utilities, and real estate. Sector rotation involves moving investments from one sector to another based on expected performance changes due to these macroeconomic shifts.
2. The Conceptual Basis of Sector Rotation
2.1 Economic Cycles and Sector Performance
Economic cycles consist of expansion, peak, contraction, and trough phases. Each phase favors certain sectors over others:
Expansion: During periods of economic growth, cyclical sectors such as technology, consumer discretionary, and industrials tend to outperform.
Peak: At the peak of economic activity, investors may rotate toward sectors with stable earnings and dividends, like utilities and consumer staples.
Contraction: Defensive sectors such as healthcare, utilities, and consumer staples often outperform as the economy slows.
Trough: At the bottom of the cycle, early cyclicals like financials and industrials start to recover, signaling the beginning of the next rotation cycle.
This cyclical nature forms the theoretical foundation for sector rotation strategies.
2.2 Market Sentiment and Behavioral Economics
Market sentiment, influenced by investor psychology, can drive sector rotation independently of the fundamental economic cycle. For example, bullish investor sentiment often drives funds into growth sectors like technology, while bearish sentiment increases the appeal of defensive sectors. Understanding behavioral tendencies, including fear and greed, is essential for timing sector rotations.
2.3 Relative Strength and Momentum Indicators
Technical analysts often use relative strength (RS) and momentum indicators to identify sectors with potential for outperformance. Relative strength compares the performance of one sector to another or to the broader market index. Momentum indicators, such as the Moving Average Convergence Divergence (MACD) or the Relative Strength Index (RSI), provide signals for trend reversals and optimal entry points.
3. Key Sectors and Their Roles in Rotation
To implement a sector rotation strategy, traders must understand the characteristics of each sector:
Technology: High growth, highly sensitive to economic expansion, driven by innovation and corporate earnings.
Healthcare: Defensive, stable cash flows, less sensitive to economic cycles.
Financials: Sensitive to interest rates, economic growth, and credit demand.
Energy: Influenced by commodity prices and global economic demand.
Consumer Discretionary: Cyclical, benefits from higher consumer spending.
Consumer Staples: Defensive, maintains stable performance during downturns.
Industrials: Cyclical, tied to economic growth, manufacturing, and infrastructure investment.
Materials: Tied to commodity prices and industrial demand.
Utilities: Defensive, steady dividends, low growth, preferred during economic uncertainty.
Real Estate: Sensitive to interest rates and economic cycles.
Understanding the sensitivity of each sector to macroeconomic variables is crucial for timing rotations effectively.
4. Tools and Techniques for Sector Rotation
4.1 Fundamental Analysis
Traders use fundamental analysis to assess sector health, focusing on factors like GDP growth, interest rates, inflation, and corporate earnings. Key indicators include:
Purchasing Managers’ Index (PMI)
Inflation and CPI reports
Central bank monetary policies
Employment and consumer spending data
These indicators help predict which sectors are likely to outperform in upcoming phases of the economic cycle.
4.2 Technical Analysis
Technical tools assist in identifying the right timing for sector rotations:
Sector ETFs: Exchange-traded funds provide exposure to specific sectors and allow for easy rotation.
Moving Averages: Indicate trend direction and momentum for sector indices.
Relative Strength Charts: Compare performance of sectors against the market benchmark.
MACD and RSI: Detect overbought or oversold conditions, signaling potential rotation points.
4.3 Quantitative Models
Quantitative models, including factor-based investing and algorithmic strategies, allow traders to systematically rotate sectors based on data-driven signals. Factors such as valuation ratios, growth metrics, momentum, and volatility can be incorporated into sector rotation models.
5. Benefits of Sector Rotation Strategies
Enhanced Returns: Capturing sector outperformance can generate alpha beyond broad market gains.
Risk Management: Rotating into defensive sectors during downturns reduces portfolio volatility.
Diversification: Moving across sectors balances exposure and mitigates sector-specific risks.
Flexibility: Can be applied in both long-only and long-short portfolios.
Data-Driven Decision Making: Combines fundamental, technical, and macroeconomic analysis for strategic investment.
6. Challenges in Sector Rotation
While sector rotation can be profitable, it comes with challenges:
Timing Risks: Entering or exiting a sector too early can reduce returns or create losses.
Transaction Costs: Frequent rotation may increase brokerage fees and slippage.
Complex Analysis: Requires constant monitoring of economic indicators, earnings reports, and technical trends.
Market Volatility: Unexpected events can disrupt rotation patterns.
Behavioral Biases: Traders may react emotionally, missing optimal rotation opportunities.
Successful sector rotation demands discipline, research, and a systematic approach.
7. Practical Implementation of Sector Rotation
7.1 Using Sector ETFs
Exchange-traded funds (ETFs) tracking sector indices provide an easy method for implementing rotation strategies. For example:
Technology ETF: QQQ or XLK
Healthcare ETF: XLV
Financial ETF: XLF
Investors can allocate capital dynamically based on economic signals and technical indicators.
7.2 Rotating Across Industry Sub-Sectors
Advanced traders rotate within sectors to capture micro-trends. For example, within the technology sector, semiconductors may outperform software during one cycle, while cloud computing leads in another.
7.3 Integrating with Broader Portfolio Strategy
Sector rotation can complement broader portfolio strategies like:
Value investing
Growth investing
Momentum trading
Dividend investing
Integrating sector rotation helps enhance returns and manage risks across market cycles.
8. Case Studies and Historical Examples
8.1 The 2008 Financial Crisis
During the 2008 financial crisis, defensive sectors like consumer staples, healthcare, and utilities outperformed, while cyclical sectors like financials and industrials suffered. Traders who rotated into defensive sectors preserved capital and captured relative outperformance.
8.2 Post-COVID-19 Recovery (2020–2021)
Technology and consumer discretionary sectors led the recovery due to shifts in consumer behavior and digital adoption. Investors who rotated into these growth sectors early benefited from significant gains.
8.3 Commodity Price Cycles
Energy and materials sectors often experience rotations based on commodity cycles. Traders tracking oil, gas, and metals prices can anticipate sector performance to adjust portfolio allocations accordingly.
9. Sector Rotation and Global Markets
Sector rotation is not limited to domestic markets. International investors can apply rotation strategies to:
Emerging markets
Developed markets
Regional ETFs
Global macroeconomic factors, such as interest rate differentials, trade policies, and geopolitical tensions, create opportunities for cross-border sector rotation.
10. The Future of Sector Rotation
With the rise of technology, artificial intelligence, and data analytics, sector rotation strategies are becoming more sophisticated. AI-driven models can:
Analyze vast economic datasets
Predict sector performance with machine learning
Automate rotation decisions
Reduce human bias
Furthermore, thematic investing and ESG (Environmental, Social, Governance) trends are influencing sector performance, providing new dimensions for rotation strategies.
11. Conclusion
Sector rotation is a dynamic and nuanced trading strategy that leverages economic cycles, market sentiment, and technical analysis to maximize portfolio performance. By understanding sector behavior, monitoring macroeconomic indicators, and applying disciplined entry and exit strategies, traders can enhance returns while managing risks. Though complex, sector rotation remains a powerful tool for both institutional and individual investors seeking to navigate the ever-changing landscape of financial markets.
How AI is Transforming Financial Markets1. Introduction
Financial markets have traditionally relied on human expertise, intuition, and historical data analysis to make decisions. While these methods have served well, they are often limited by human cognitive biases, data processing constraints, and the speed at which information is absorbed and acted upon.
Artificial Intelligence, encompassing machine learning (ML), deep learning (DL), natural language processing (NLP), and predictive analytics, is enabling financial institutions to overcome these limitations. AI can process vast amounts of structured and unstructured data, identify patterns, make predictions, and execute actions in real-time. This has paved the way for smarter trading strategies, enhanced risk mitigation, and improved customer experiences.
The integration of AI in finance is not just a technological upgrade; it represents a paradigm shift in the structure and functioning of financial markets globally.
2. AI in Trading and Investment
2.1 Algorithmic Trading
Algorithmic trading refers to the use of computer algorithms to automate trading strategies. AI enhances algorithmic trading by making it adaptive, predictive, and capable of handling complex patterns that traditional models may overlook.
Machine Learning Algorithms: AI-powered algorithms can analyze historical data and detect subtle market patterns to make predictions about asset price movements. Unlike traditional models that rely on fixed rules, machine learning algorithms continuously learn and adapt based on new data.
High-Frequency Trading (HFT): AI facilitates HFT by enabling trades to be executed in milliseconds based on micro-market changes. AI models analyze price fluctuations, order book dynamics, and market sentiment to execute trades at optimal moments.
Predictive Analytics: AI predicts market trends, volatility, and asset price movements with high accuracy. Techniques like reinforcement learning allow models to simulate and optimize trading strategies in virtual market environments before applying them in real markets.
2.2 Robo-Advisors
Robo-advisors are AI-driven platforms that provide automated investment advice and portfolio management services. They use algorithms to assess an investor’s risk profile, financial goals, and market conditions, creating personalized investment strategies.
Accessibility: Robo-advisors democratize investing by making professional-grade financial advice accessible to retail investors at low costs.
Portfolio Optimization: AI dynamically adjusts portfolios based on market conditions, maximizing returns while minimizing risk.
Behavioral Analysis: By analyzing investor behavior, AI can provide personalized guidance to reduce emotional trading, which is a common source of losses.
2.3 Sentiment Analysis
AI leverages natural language processing to analyze news articles, social media, earnings calls, and financial reports to gauge market sentiment.
Market Prediction: Positive or negative sentiment extracted from textual data can provide early signals for stock price movements.
Event Detection: AI detects geopolitical events, regulatory changes, or corporate announcements that could impact markets.
Investor Insight: By analyzing sentiment patterns, AI helps investors anticipate market reactions, enhancing decision-making efficiency.
3. Risk Management and Compliance
3.1 Credit Risk Assessment
AI has transformed how banks and financial institutions assess creditworthiness. Traditional credit scoring models relied on limited historical data and rigid criteria, but AI can evaluate a broader set of variables.
Alternative Data: AI analyzes non-traditional data such as social behavior, transaction patterns, and digital footprints to assess credit risk.
Predictive Modeling: Machine learning models predict the probability of default more accurately than conventional statistical models.
Dynamic Risk Assessment: AI continuously monitors borrowers’ behavior and financial health, updating risk profiles in real-time.
3.2 Market Risk and Portfolio Management
AI enhances market risk management by modeling complex market dynamics and stress scenarios.
Scenario Analysis: AI simulates various market conditions, helping fund managers understand potential portfolio risks.
Volatility Prediction: Machine learning models forecast market volatility using historical data, enabling proactive risk mitigation strategies.
Optimization: AI optimizes portfolio allocations by balancing expected returns against potential risks in real-time.
3.3 Regulatory Compliance and Fraud Detection
Financial markets are heavily regulated, and compliance is critical. AI automates compliance processes and fraud detection.
Anti-Money Laundering (AML): AI detects suspicious transaction patterns indicative of money laundering or financial crimes.
RegTech Solutions: AI ensures adherence to regulatory requirements by automating reporting, monitoring, and auditing processes.
Fraud Detection: AI identifies anomalies in transaction data, preventing fraudulent activities with greater speed and accuracy than human oversight.
4. Enhancing Market Efficiency
AI improves market efficiency by reducing information asymmetry and enhancing decision-making for market participants.
4.1 Price Discovery
AI algorithms facilitate faster and more accurate price discovery by analyzing multiple data sources simultaneously, including market orders, economic indicators, and news.
4.2 Liquidity Management
AI optimizes liquidity by forecasting cash flow needs, monitoring order book dynamics, and predicting market depth.
4.3 Reducing Transaction Costs
Automated trading and AI-driven market analysis reduce operational and transaction costs, enabling more efficient markets.
5. AI in Customer Experience and Personalization
5.1 Personalized Financial Services
AI personalizes customer experiences by analyzing behavior patterns, transaction histories, and preferences.
Tailored Products: Banks and fintech firms offer customized investment products, loans, and insurance policies.
Chatbots and Virtual Assistants: AI-driven chatbots handle routine queries, transactions, and financial advice, improving customer satisfaction.
Financial Wellness Tools: AI analyzes spending and saving patterns to provide actionable advice, helping users achieve financial goals.
5.2 Behavioral Insights
By understanding investor behavior, AI helps reduce irrational decisions, encourages disciplined investing, and supports financial literacy.
6. AI-Driven Innovation in Financial Products
AI is not only enhancing existing financial services but also driving the creation of new products.
Algorithmic Derivatives: AI designs derivatives and structured products tailored to specific investor needs.
Dynamic Insurance Pricing: AI models assess risk dynamically, enabling real-time premium adjustments.
Smart Contracts and Blockchain: AI combined with blockchain technology automates contract execution, reducing counterparty risks and improving transparency.
7. Challenges and Risks of AI in Financial Markets
While AI offers numerous advantages, its adoption also comes with challenges:
7.1 Model Risk
AI models are only as good as the data and assumptions underlying them. Poorly designed models can lead to significant financial losses.
7.2 Ethical and Regulatory Concerns
AI’s decision-making process is often opaque (“black-box problem”), raising concerns about accountability, fairness, and compliance.
7.3 Cybersecurity Threats
AI systems are vulnerable to cyber-attacks, data breaches, and adversarial attacks that can manipulate outcomes.
7.4 Market Stability
The widespread use of AI in high-frequency trading and algorithmic strategies may amplify market volatility and systemic risks.
8. Case Studies of AI Transforming Financial Markets
8.1 JPMorgan Chase: COiN Platform
JPMorgan’s Contract Intelligence (COiN) platform uses AI to analyze legal documents and extract key data points, reducing manual review time from thousands of hours to seconds.
8.2 BlackRock: Aladdin Platform
BlackRock’s Aladdin platform integrates AI for risk management, portfolio optimization, and predictive analytics, providing a comprehensive view of market exposures and investment opportunities.
8.3 Goldman Sachs: Marcus and Trading Algorithms
Goldman Sachs uses AI-driven trading algorithms for securities and commodities, while Marcus leverages AI to enhance customer lending and risk assessment processes.
8.4 Retail Trading Platforms
Platforms like Robinhood and Wealthfront utilize AI to offer personalized recommendations, portfolio rebalancing, and real-time insights to millions of retail investors.
9. Future Trends
9.1 Explainable AI (XAI)
Future financial markets will increasingly demand AI systems that are transparent and explainable, ensuring accountability and regulatory compliance.
9.2 Integration with Quantum Computing
Quantum computing combined with AI could revolutionize financial modeling, enabling previously impossible optimizations and simulations.
9.3 Cross-Asset AI Trading
AI will integrate insights across equities, commodities, currencies, and derivatives, enhancing cross-asset trading strategies.
9.4 Democratization of AI Tools
As AI tools become more accessible, retail investors and smaller institutions will be able to leverage advanced analytics, leveling the playing field.
9.5 Sustainable and Ethical Finance
AI will help investors incorporate ESG (Environmental, Social, Governance) factors into investment decisions, promoting sustainable financial markets.
10. Conclusion
AI is fundamentally reshaping financial markets, making them faster, smarter, and more efficient. From algorithmic trading and risk management to customer personalization and product innovation, AI’s applications are extensive and transformative. However, this transformation comes with challenges, including ethical concerns, regulatory compliance, cybersecurity risks, and market stability issues.
As AI continues to evolve, financial markets will likely witness further innovation, democratization, and efficiency. Institutions that effectively harness AI while managing its risks will be best positioned to thrive in the increasingly complex and dynamic global financial ecosystem.
In essence, AI is not just changing how financial markets operate—it is redefining the very nature of finance, turning data into intelligence, and intelligence into strategic advantage. The future of financial markets will be defined by those who can master the synergy between human insight and artificial intelligence.
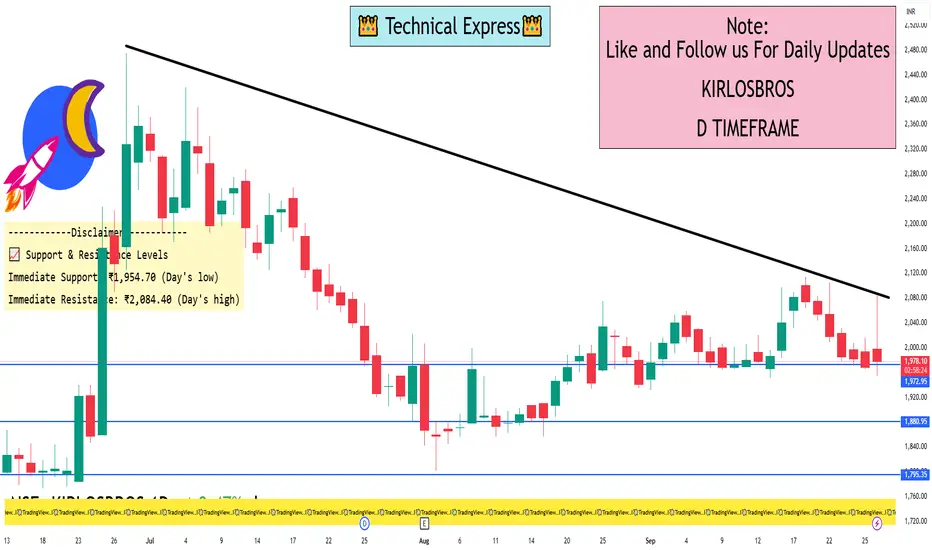
KIRLOSBROS 1 Day View📊 1-Day Technical Summary
Current Price: ₹2,030.50
Open: ₹1,998.00
High: ₹2,084.40
Low: ₹1,954.70
Close: ₹2,030.50
Volume: 177,664 shares
VWAP: ₹2,029.19
Price Change: -0.67%
🔍 Technical Indicators
RSI (14-day): 39.91 — Indicates a bearish trend, approaching oversold conditions
MACD: -16.34 — Suggests a bearish momentum
Moving Averages: All short-term and long-term moving averages (MA5 to MA200) are signaling a Strong Sell
Stochastic RSI: In a bearish zone, reinforcing the downward momentum
📈 Support & Resistance Levels
Immediate Support: ₹1,954.70 (Day's low)
Immediate Resistance: ₹2,084.40 (Day's high)
⚠️ Conclusion
The 1-day technical indicators for Kirloskar Brothers Ltd. suggest a bearish outlook, with the stock trading below key moving averages and exhibiting negative momentum. Traders should exercise caution and consider waiting for a confirmation of trend reversal before initiating long positions.
Public vs Private Banks in Trading1. Introduction
Banking institutions play a crucial role in the financial ecosystem, acting as intermediaries between savers and borrowers, facilitating economic growth, and influencing market stability. Within India, banks are broadly classified into public sector banks and private sector banks, both of which participate in trading activities but with different operational strategies, risk appetites, and market impacts.
Trading by banks refers to activities such as:
Equity trading: Buying and selling shares of companies.
Debt trading: Involving government bonds, corporate bonds, and other fixed-income instruments.
Derivatives trading: Futures, options, swaps for hedging or speculative purposes.
Forex trading: Buying and selling foreign currencies.
Commodity trading: Participation in commodity markets, often indirectly.
The distinction between public and private banks in these trading activities affects liquidity, market volatility, investor confidence, and overall financial stability.
2. Overview of Public and Private Banks
2.1 Public Sector Banks (PSBs)
Public sector banks are banks in which the government holds a majority stake (usually over 50%), giving it significant control over operations and policies. Examples in India include:
State Bank of India (SBI)
Punjab National Bank (PNB)
Bank of Baroda (BoB)
Characteristics:
Government ownership provides implicit trust and perceived safety.
Mandated to serve social and economic objectives, sometimes at the cost of profitability.
Larger branch networks, especially in semi-urban and rural areas.
Regulatory oversight tends to be stricter, focusing on stability rather than aggressive profits.
2.2 Private Sector Banks
Private banks are owned by private entities or shareholders with the primary objective of profit maximization. Examples include:
HDFC Bank
ICICI Bank
Axis Bank
Characteristics:
More technologically advanced and customer-centric.
Flexible, agile, and willing to explore new trading strategies.
High focus on efficiency, profitability, and risk-adjusted returns.
Typically have fewer rural branches but dominate urban and digital banking.
3. Role of Banks in Trading
Banks are central players in the financial markets. Their trading activities can be categorized as:
3.1 Proprietary Trading
Banks trade with their own capital to earn profits. Private banks often engage more aggressively due to higher risk appetite.
3.2 Client Trading
Banks execute trades on behalf of clients, such as corporates, mutual funds, or high-net-worth individuals. Both public and private banks participate, but private banks may offer more advanced advisory and trading platforms.
3.3 Hedging and Risk Management
Banks use derivatives and other instruments to hedge risks associated with:
Currency fluctuations
Interest rate changes
Commodity price movements
Public banks often hedge conservatively due to regulatory oversight, whereas private banks may engage in complex derivative strategies.
4. Trading in Different Market Segments
4.1 Equity Markets
Public Banks: Typically invest in blue-chip companies and government initiatives; tend to hold stable equity portfolios.
Private Banks: Active in IPOs, mutual funds, and portfolio management; may leverage proprietary trading desks for short-term gains.
4.2 Debt Markets
Public Banks: Major participants in government bonds, treasury bills, and large-scale debt issuance.
Private Banks: Active in corporate bonds, debentures, and structured debt instruments.
4.3 Forex Markets
Public Banks: Facilitate trade-related foreign exchange, hedging imports/exports; conservative trading.
Private Banks: Aggressive forex trading, currency swaps, and derivatives to maximize profits.
4.4 Commodity Markets
Public Banks: Minimal direct participation; may finance commodity traders.
Private Banks: May engage in commodity-linked derivatives for proprietary or client trading.
4.5 Derivatives Markets
Public Banks: Hedging-driven; lower exposure to high-risk derivatives.
Private Banks: Speculation and hedging; higher use of futures, options, and structured products.
5. Comparative Performance Analysis
5.1 Profitability
Private banks typically have higher net interest margins and return on equity.
Public banks focus on financial inclusion and stability; profits are secondary.
5.2 Risk Management
Public banks prioritize capital preservation; may carry higher non-performing assets (NPAs).
Private banks employ advanced risk modeling; NPAs are lower, but exposure to market risks is higher.
5.3 Market Impact
Public banks stabilize markets during crises due to government backing.
Private banks drive market innovation through new trading products and digital platforms.
6. Regulation and Compliance
Both public and private banks in India are regulated by the Reserve Bank of India (RBI).
Public Banks: Must follow government mandates on priority sector lending, capital adequacy, and lending limits.
Private Banks: While regulated, they enjoy more freedom in investment strategies, provided they adhere to Basel III norms and RBI guidelines.
7. Technological and Digital Edge
Public Banks
Historically slower in adopting technology.
Initiatives like Core Banking Solutions (CBS) have modernized operations.
Digital trading platforms are limited.
Private Banks
Early adopters of digital trading platforms, mobile banking, and AI-based trading analytics.
Focus on client-driven solutions like portfolio optimization, robo-advisory, and high-frequency trading.
8. Case Studies
8.1 State Bank of India (SBI)
Large-scale government bond trading.
Stable equity portfolio; focus on corporate and retail clients.
Conservative derivatives trading.
8.2 HDFC Bank
Active in equity derivatives and forex trading.
Aggressive risk-adjusted proprietary trading strategies.
Strong digital platforms for client trading.
9. Challenges and Opportunities
Public Banks
Challenges:
High NPAs, bureaucratic hurdles, and slower adoption of technology.
Limited risk-taking capacity restricts trading profits.
Opportunities:
Government support can stabilize during crises.
Potential for technology partnerships to modernize trading platforms.
Private Banks
Challenges:
Vulnerable to market volatility and regulatory scrutiny.
Aggressive trading strategies can backfire during crises.
Opportunities:
High profit potential through innovative trading and fintech integration.
Can attract high-net-worth clients and institutional investors.
10. Impact on Financial Markets
Public Banks: Act as stabilizers; provide liquidity during market stress.
Private Banks: Drive market efficiency and innovation; increase competition.
Combined Effect: Both types ensure a balanced ecosystem where stability and growth coexist.
11. Future Trends in Banking and Trading
Integration of AI and Machine Learning:
Private banks leading in algorithmic trading and predictive analytics.
Public banks adopting AI for risk management and operational efficiency.
Blockchain and Digital Assets:
Both sectors exploring blockchain for secure and transparent trading.
Cryptocurrency exposure remains limited but monitored.
Sustainable and ESG Investments:
Increasing focus on green bonds, socially responsible funds, and ESG-compliant derivatives.
Global Market Expansion:
Private banks expanding cross-border trading.
Public banks supporting government-backed international trade financing.
12. Conclusion
Public and private banks serve complementary roles in the trading ecosystem:
Public Banks: Conservative, stable, government-backed, stabilizing force in markets.
Private Banks: Agile, profit-oriented, technologically advanced, driving market innovation.
A robust financial system requires both sectors to function effectively. Public banks ensure economic stability, especially in times of crisis, while private banks provide innovation, efficiency, and competitive trading solutions. For investors, understanding these differences is critical when assessing bank stock investments, trading opportunities, or market trends.
Types of Trading in India: An In-Depth Analysis1. Equity Trading (Stock Trading)
Overview: Buying and selling shares of companies listed on stock exchanges like NSE and BSE.
Key Features:
Can be short-term (intraday) or long-term (investment).
Investors earn through capital appreciation and dividends.
Benefits: High liquidity, transparency, regulated market.
Risks: Market volatility can lead to significant losses.
Example: Buying shares of Reliance Industries and selling after a price rise.
2. Intraday Trading
Overview: Buying and selling stocks within the same trading day.
Key Features:
Traders do not hold positions overnight.
Relies heavily on technical analysis.
Benefits: Quick profits, no overnight risk.
Risks: High leverage increases risk; requires constant monitoring.
Example: Buying Infosys in the morning and selling by afternoon for short-term gains.
3. Futures and Options (Derivatives Trading)
Overview: Contracts whose value is derived from underlying assets like stocks, indices, or commodities.
Key Features:
Futures obligate buying/selling at a fixed date.
Options provide the right, not obligation, to buy/sell.
Benefits: Hedging, leverage, speculation.
Risks: High risk due to leverage; can lead to large losses.
Example: Buying Nifty Call Option to profit from a market rise.
4. Commodity Trading
Overview: Buying and selling commodities such as gold, silver, oil, and agricultural products on MCX or NCDEX.
Key Features:
Includes spot, futures, and options contracts.
Influenced by global demand, supply, and geopolitical factors.
Benefits: Portfolio diversification, inflation hedge.
Risks: Price volatility, geopolitical risks, storage costs (for physical commodities).
Example: Trading crude oil futures anticipating a price surge.
5. Currency Trading (Forex Trading)
Overview: Trading in foreign currency pairs like USD/INR, EUR/INR.
Key Features:
Can be spot or derivative contracts.
Driven by global economic events and RBI policies.
Benefits: High liquidity, global opportunities.
Risks: Exchange rate volatility, leverage risks.
Example: Buying USD against INR expecting INR to weaken.
6. Mutual Fund Trading
Overview: Investing in professionally managed funds that pool money from multiple investors.
Key Features:
Equity, debt, hybrid funds available.
Can be SIP (Systematic Investment Plan) or lump sum.
Benefits: Professional management, diversification, lower risk.
Risks: Returns are market-linked; management fees apply.
Example: Investing in HDFC Equity Fund via monthly SIP.
7. Bond and Debt Securities Trading
Overview: Trading government and corporate bonds, debentures, and fixed-income instruments.
Key Features:
Predictable income through interest payments.
Less volatile than equity markets.
Benefits: Capital preservation, steady returns.
Risks: Interest rate fluctuations, credit risk of issuers.
Example: Buying 10-year government bonds for stable returns.
8. Cryptocurrency Trading
Overview: Buying and selling digital currencies like Bitcoin, Ethereum, and Indian crypto tokens.
Key Features:
Highly volatile and largely unregulated in India.
Includes spot trading and futures trading.
Benefits: Potential for high returns, global market access.
Risks: Extreme volatility, regulatory uncertainty, cyber risks.
Example: Trading Bitcoin on WazirX anticipating a price spike.
9. IPO and Primary Market Trading
Overview: Investing in companies during their Initial Public Offering before they are listed.
Key Features:
Subscription-based allotment via brokers or banks.
Potential for listing gains.
Benefits: Opportunity to buy at a lower price before listing.
Risks: Listing may underperform; market sentiment affects gains.
Example: Applying for LIC IPO shares expecting listing gains.
10. Algorithmic and High-Frequency Trading (HFT)
Overview: Automated trading using computer algorithms to execute orders at high speed.
Key Features:
Relies on pre-set rules, AI, and quantitative models.
Popular among institutional traders and hedge funds.
Benefits: Speed, accuracy, can exploit small price differences.
Risks: Requires technical expertise, market flash crashes possible.
Example: Using algorithmic trading to scalp Nifty futures in milliseconds.
Conclusion
India offers a wide spectrum of trading opportunities for investors and traders—from traditional stock markets to cutting-edge algorithmic and crypto trading. Choosing the right type depends on risk tolerance, capital, time horizon, and knowledge of the market. While equities, derivatives, and commodities dominate in terms of popularity, newer avenues like cryptocurrencies and algorithmic trading are gaining traction rapidly.

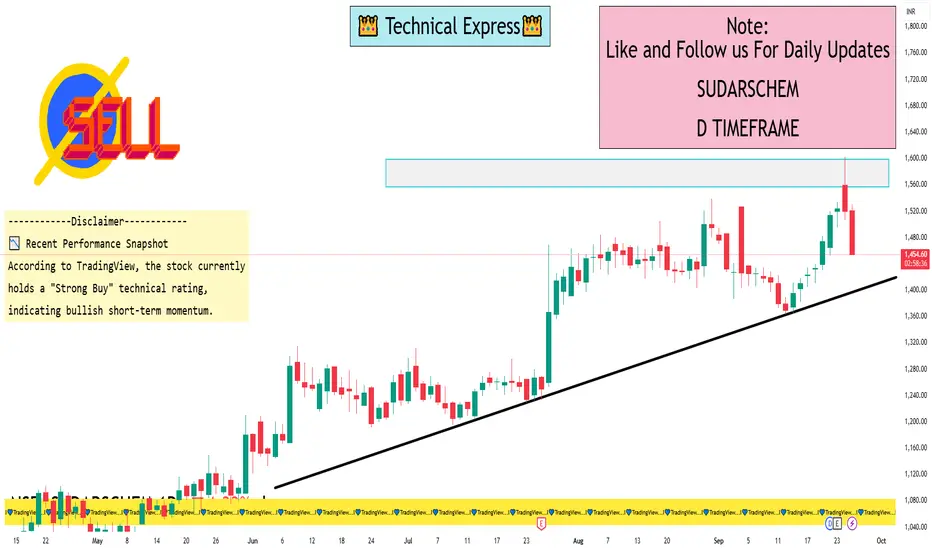
SUDARSCHEM 1 Day View📊 Key Intraday Levels
Opening Price: ₹1,521.00
Day’s High: ₹1,529.80
Day’s Low: ₹1,454.40
Previous Close: ₹1,520.50
VWAP (Volume-Weighted Average Price): ₹1,489.72
Upper Circuit Limit: ₹1,824.60
Lower Circuit Limit: ₹1,216.40
📈 Technical Overview
According to TradingView, the stock currently holds a "Strong Buy" technical rating, indicating bullish short-term momentum.
📉 Recent Performance Snapshot
Despite the current decline, Sudarshan Chemical has shown robust performance over the past year, with a 1-year return of approximately 38.25%.
🧠 Intraday Outlook
The stock is currently testing its support levels. A sustained move below ₹1,445 could lead to further declines. Conversely, a rebound above ₹1,530 may signal a potential reversal. Traders should monitor these levels closely for potential entry or exit points.
🔍 Summary
While the stock is experiencing a pullback today, its overall technical outlook remains positive. Investors should monitor key support levels around ₹1,454 and ₹1,440, as a breach could signal further downside. Conversely, a recovery above ₹1,500 may indicate a resumption of the uptrend.
DIvergence SecretsUnderstanding Options Trading
With the help of Options Trading, an investor/trader can buy or sell stocks, ETFs, and others, at a certain price and within a certain date. It is a type of trading that offers investors fair flexibility to not purchase a security at a certain date/price.
How Does Options Trading Work?
When a trader/investor purchase or sell options, they attain a right to apply that option at any point in time, although before the expiration date. Merely buying/selling an option does not require an individual to exercise at the time of expiration.
Strategies in Option Trading
Long call options trading strategy
Short call options trading strategy
Long put options trading strategy
Short put options trading strategy
Long straddle options trading strategy
Short straddle options trading strategy
Participants in Options
1. Buyer of an Option
The one who, by paying the premium, buys the right to exercise his option on the seller/writer.
2. Writer/seller of an Option
The one who receives the premium of the option and thus is obliged to sell/buy the asset if the buyer of the option exercises it.
3. Call Option
A call option is an option that provides the holder the right but not the obligation to buy an asset at a set price before a certain date.
4. Put Option
A put option is an option that offers the holder, the right but not the obligation, to sell an asset at a set price before a certain date.
Notable Terms in Options Trading
1. Premium
The price that the option buyer pays to the option seller is referred to as the option premium.
2. Expiry Date
The date specified in an option contract is known as the expiry date or the exercise date.
3. Strike Price
The price at which the contract is entered is the strike price or the exercise price.
4. American Option
The option that can be exercised at any date until the expiry date.
5. European Option
The option that can be exercised only on the expiry date.
6. Index Options
These are the options that have an index as the underlying. In India, the regulators authorized the European style of settlement. Examples of such options include Nifty options, Bank Nifty options, etc.
7. Stock Options
These are options on the individual stocks (with stock as the underlying). The contract gives the holder the right to buy or sell the underlying shares at the specified price. The regulator has also authorized the American style of settlement for such options.

Advanced Smart Liquidity Concepts1. Introduction to Smart Liquidity
1.1 Definition of Smart Liquidity
Smart liquidity refers to the portion of market liquidity that is not just available but is efficiently utilized by market participants to execute trades with minimal market impact. Unlike raw liquidity, which measures just the number of shares or contracts available, smart liquidity evaluates:
Accessibility: Can orders be executed efficiently without adverse price movement?
Quality: How stable and reliable is the liquidity at various price levels?
Speed: How quickly can liquidity be accessed and replenished?
1.2 Evolution from Traditional Liquidity Concepts
Traditional liquidity focuses on measurable quantities: order book depth, bid-ask spreads, and trading volume. Smart liquidity incorporates behavioral and strategic aspects of market participants:
Algorithmic awareness: Machines identify and exploit inefficiencies, adjusting liquidity dynamically.
Hidden liquidity: Orders concealed in dark pools or iceberg orders that influence market balance without being visible.
Latency arbitrage impact: The speed advantage of HFT affects liquidity availability and reliability.
2. Drivers of Advanced Smart Liquidity
Smart liquidity is influenced by a complex interplay of market structure, participant behavior, and technological factors:
2.1 Market Microstructure
Order book dynamics: Depth, shape, and resilience of the order book impact how liquidity is absorbed.
Spread dynamics: Tight spreads suggest high-quality liquidity, but may hide fragility if large orders create slippage.
Order flow imbalance: The ratio of aggressive to passive orders indicates how liquidity will move under pressure.
2.2 High-Frequency and Algorithmic Trading
Liquidity provision by HFTs: HFTs continuously place and cancel orders, creating dynamic liquidity pockets.
Quote stuffing and spoofing: Some algorithms distort perceived liquidity temporarily, affecting smart liquidity perception.
Latency arbitrage: Access to faster data feeds allows participants to extract liquidity before it is visible to slower traders.
2.3 Dark Pools and Hidden Liquidity
Iceberg orders: Large orders split into smaller visible slices to reduce market impact.
Alternative trading systems (ATS): These venues offer substantial liquidity without displaying it on public exchanges, contributing to overall market efficiency.
Liquidity fragmentation: The same asset may be available in multiple venues, requiring smart routing to access efficiently.
2.4 Market Sentiment and Behavior
Trader psychology: Fear or greed can amplify or withdraw liquidity, especially during volatility spikes.
News and macro events: Smart liquidity shifts rapidly around earnings, central bank announcements, or geopolitical shocks.
3. Measuring Smart Liquidity
Traditional liquidity measures are insufficient for modern market analysis. Advanced metrics capture both quality and accessibility:
3.1 Market Impact Models
Price impact per trade size: How much the price moves for a given order quantity.
Resilience measurement: How quickly the market recovers after a large trade absorbs liquidity.
3.2 Order Book Metrics
Depth at multiple levels: Not just best bid and ask but the full ladder of price levels.
Order flow toxicity: Probability that incoming orders are informed or likely to move the market against liquidity providers.
3.3 Smart Liquidity Indicators
Liquidity-adjusted volatility: Adjusting volatility estimates based on available liquidity.
Effective spread: Spread accounting for market impact and hidden liquidity.
Liquidity heatmaps: Visual tools highlighting concentration and availability of smart liquidity across price levels and venues.
3.4 Machine Learning for Liquidity Analysis
Predicting liquidity shifts using historical order book data.
Clustering trades by behavior to identify hidden liquidity patterns.
Algorithmic routing optimization to access the most favorable liquidity pools.
4. Strategies Leveraging Smart Liquidity
Advanced smart liquidity concepts are not just analytical—they inform trading strategy, risk management, and execution efficiency.
4.1 Optimal Order Execution
VWAP and TWAP algorithms: Spread large trades over time to minimize market impact.
Liquidity-seeking algorithms: Dynamically route orders to venues with the highest smart liquidity.
Iceberg order strategies: Hide large orders to reduce signaling risk.
4.2 Risk Management Applications
Dynamic hedging: Adjust hedge positions based on real-time smart liquidity availability.
Liquidity-adjusted VaR: Incorporates potential liquidity constraints into risk calculations.
Stress testing: Simulating low liquidity scenarios to measure portfolio vulnerability.
4.3 Arbitrage and Market-Making
Exploiting temporary liquidity imbalances across venues or assets.
Providing liquidity strategically during periods of high spreads to capture rebates and mitigate inventory risk.
Utilizing smart liquidity signals to identify emerging inefficiencies.
5. Smart Liquidity in Volatile Markets
5.1 Liquidity Crises and Flash Events
Flash crashes often occur when apparent liquidity evaporates under stress.
Smart liquidity analysis identifies resilient liquidity versus superficial depth that may disappear under pressure.
5.2 Adaptive Strategies for High Volatility
Dynamic adjustment of execution algorithms.
Use of limit orders versus market orders depending on liquidity conditions.
Monitoring order flow toxicity and liquidity concentration to avoid adverse selection.
6. Technological Innovations Impacting Smart Liquidity
6.1 AI and Machine Learning
Predictive models for liquidity shifts.
Reinforcement learning for adaptive execution strategies.
6.2 Blockchain and Decentralized Finance (DeFi)
Automated market makers (AMMs) provide liquidity continuously with programmable rules.
Smart liquidity pools that dynamically adjust pricing and depth.
6.3 High-Frequency Infrastructure
Co-location and low-latency networking enhance the ability to access liquidity before competitors.
Real-time analytics of fragmented markets for smart routing.
7. Regulatory Considerations
Advanced liquidity management intersects with regulation:
Market manipulation risks: Spoofing, layering, and quote stuffing can misrepresent liquidity.
Best execution obligations: Brokers must seek the highest-quality liquidity for clients.
Transparency vs. privacy: Balancing visible liquidity with hidden orders in regulated venues.
8. Future Directions of Smart Liquidity
Integration of multi-asset liquidity analysis: Evaluating cross-asset and cross-venue liquidity to optimize execution.
AI-driven market-making: Fully autonomous systems that dynamically adjust liquidity provision.
Global liquidity networks: Real-time global liquidity mapping for cross-border trading.
Impact of quantum computing: Potentially enabling instant liquidity analysis at unprecedented speeds.
9. Conclusion
Advanced smart liquidity goes far beyond simple bid-ask spreads or volume metrics. It encompasses quality, accessibility, adaptability, and strategic use of liquidity. In a market dominated by algorithms, high-frequency trading, and fragmented venues, understanding smart liquidity is essential for:
Efficient trade execution
Risk mitigation and stress management
Market-making and arbitrage strategies
Anticipating market behavior in volatile conditions
Future financial markets will increasingly rely on AI-driven liquidity analytics, real-time monitoring, and predictive modeling. Traders and institutions that master smart liquidity will gain a competitive edge in both execution efficiency and risk management.
Technical Indicators for Swing Trading1. Introduction to Technical Indicators
Technical indicators are mathematical calculations based on historical price, volume, or open interest data. They help traders identify trends, reversals, and potential entry and exit points. There are two main types of indicators used in swing trading:
Trend-Following Indicators – These help identify the direction of the market and confirm the strength of a trend. Examples include Moving Averages, MACD, and Average Directional Index (ADX).
Oscillators – These help identify overbought or oversold conditions and possible price reversals. Examples include RSI, Stochastic Oscillator, and Commodity Channel Index (CCI).
Most swing traders use a combination of trend-following indicators and oscillators to improve the accuracy of their trades.
2. Trend-Following Indicators
2.1 Moving Averages (MA)
Definition: Moving averages smooth out price data to identify trends by averaging prices over a specific period. The two most popular types are:
Simple Moving Average (SMA): The arithmetic mean of prices over a chosen period.
Exponential Moving Average (EMA): Gives more weight to recent prices, making it more responsive to price changes.
Application in Swing Trading:
Trend Identification: A rising MA indicates an uptrend, while a declining MA indicates a downtrend.
Crossovers: A common strategy is the moving average crossover. For instance, when a short-term MA (e.g., 20-day) crosses above a long-term MA (e.g., 50-day), it signals a potential bullish trend. Conversely, a cross below indicates a bearish trend.
Support and Resistance: MAs often act as dynamic support or resistance levels. Traders can enter trades when the price bounces off the MA.
Example: If a stock’s 50-day EMA is rising, swing traders might look for pullbacks to this EMA as entry points.
2.2 Moving Average Convergence Divergence (MACD)
Definition: MACD measures the relationship between two EMAs (usually 12-day and 26-day) and includes a signal line (9-day EMA of MACD) to generate trading signals.
Components:
MACD Line: Difference between the 12-day EMA and the 26-day EMA.
Signal Line: 9-day EMA of the MACD line.
Histogram: Represents the difference between the MACD line and the signal line.
Application in Swing Trading:
Trend Identification: MACD above zero indicates an uptrend; below zero indicates a downtrend.
Crossovers: When the MACD line crosses above the signal line, it’s a bullish signal. A cross below signals bearishness.
Divergence: When price makes a new high or low but the MACD doesn’t, it signals a potential trend reversal.
Example: A swing trader may buy a stock when the MACD crosses above the signal line after a pullback in an uptrend.
2.3 Average Directional Index (ADX)
Definition: ADX measures the strength of a trend, regardless of direction. It ranges from 0 to 100.
Application in Swing Trading:
Trend Strength: ADX above 25 indicates a strong trend, while below 20 suggests a weak trend or range-bound market.
Trade Confirmation: Swing traders often avoid taking trades when ADX is low because the price may be consolidating rather than trending.
Example: If ADX is 30 and the trend is upward, traders may consider buying on pullbacks.
3. Oscillators for Swing Trading
3.1 Relative Strength Index (RSI)
Definition: RSI measures the speed and change of price movements on a scale of 0 to 100. Traditionally, RSI above 70 is considered overbought, and below 30 is oversold.
Application in Swing Trading:
Identify Overbought/Oversold Conditions: Overbought conditions may indicate a potential reversal down, while oversold conditions suggest a potential reversal up.
Divergence: When price makes a new high but RSI doesn’t, it can signal a reversal.
Support and Resistance: RSI often reacts to trendlines, helping traders anticipate price reactions.
Example: If a stock is in an uptrend but RSI drops below 30 after a pullback, a swing trader might use it as a buy signal.
3.2 Stochastic Oscillator
Definition: The stochastic oscillator compares a security’s closing price to its price range over a specific period, usually 14 periods.
Components:
%K Line: Measures the current closing price relative to the high-low range.
%D Line: 3-day moving average of %K.
Application in Swing Trading:
Overbought/Oversold Conditions: Above 80 is overbought; below 20 is oversold.
Crossovers: A bullish signal occurs when %K crosses above %D; a bearish signal when %K crosses below %D.
Divergence: Like RSI, divergence can indicate potential reversals.
Example: During an uptrend, a pullback that moves the stochastic below 20 and then back above it can be a buying opportunity.
3.3 Commodity Channel Index (CCI)
Definition: CCI measures the variation of the price from its average price over a specified period. It helps identify cyclical trends.
Application in Swing Trading:
Overbought/Oversold Levels: CCI above +100 indicates overbought; below -100 indicates oversold.
Trend Reversals: Swing traders use CCI to detect potential reversal points during pullbacks.
Entry and Exit Signals: Traders may enter long positions when CCI crosses above -100 and exit when it crosses below +100 in an uptrend.
Example: A CCI moving from -120 to -90 during an uptrend can indicate a potential entry point.
4. Volume-Based Indicators
Volume is a crucial aspect of swing trading because it confirms the strength of price moves.
4.1 On-Balance Volume (OBV)
Definition: OBV adds volume on up days and subtracts volume on down days to measure buying and selling pressure.
Application in Swing Trading:
Confirm Trends: Rising OBV with rising prices confirms an uptrend; falling OBV with falling prices confirms a downtrend.
Divergence: If OBV diverges from price, a reversal may be imminent.
Example: If a stock price is rising but OBV is falling, swing traders may be cautious about taking long positions.
4.2 Volume Oscillator
Definition: Measures the difference between two moving averages of volume, usually a short-term and a long-term MA.
Application in Swing Trading:
Helps identify volume surges that precede price movements.
Confirms breakout or breakdown signals.
Example: A spike in the volume oscillator along with a price breakout indicates strong momentum, ideal for swing trades.
5. Combining Indicators for Swing Trading
No single indicator is perfect. The most successful swing traders combine multiple indicators to confirm trades and reduce false signals. Here are common combinations:
Trend + Oscillator: Use moving averages or MACD to identify the trend, and RSI or Stochastic to time entry points during pullbacks.
Trend + Volume: Confirm a breakout with rising volume and a bullish MACD signal.
Oscillator + Volume: Use RSI or Stochastic for potential reversals, with OBV confirming strength of buying/selling.
Example Strategy:
Identify a stock in an uptrend using 50-day EMA.
Wait for RSI to drop below 30 during a pullback.
Confirm volume increase with OBV.
Enter long position when price starts moving up, exit when RSI approaches 70.
6. Practical Swing Trading Tips Using Indicators
Avoid Overloading: Using too many indicators can create conflicting signals. Stick to 2–3 complementary indicators.
Timeframe Matters: Swing traders typically use daily or 4-hour charts. Shorter timeframes may generate noise.
Risk Management: Always use stop-loss orders based on support/resistance levels or ATR (Average True Range) to protect capital.
Backtesting: Test strategies historically before applying them live to understand performance and potential drawdowns.
Patience is Key: Swing trading requires waiting for the right setup; don’t rush trades based on impulse.
7. Common Mistakes to Avoid
Ignoring Trend: Using oscillators alone without trend context can lead to premature entries.
Overreacting to Short-Term Signals: Swing trading is about the bigger picture, not intraday fluctuations.
Neglecting Volume: Price movements without volume confirmation are less reliable.
Lack of Strategy: Entering trades randomly without clear indicator-based rules often leads to losses.
8. Advanced Indicator Techniques
Divergence Analysis: Spotting divergence between price and indicators like RSI, MACD, or CCI can reveal hidden reversals.
Indicator Confluence: Using multiple indicators to converge on a single trading signal increases accuracy.
Adaptive Indicators: Some traders use adaptive MAs or dynamic RSI levels based on market volatility for improved precision.
9. Conclusion
Technical indicators are indispensable tools for swing traders. They provide insight into market trends, potential reversals, and entry/exit points. Popular indicators such as moving averages, MACD, RSI, Stochastic Oscillator, and volume-based indicators can be combined to create robust trading strategies. The key to successful swing trading lies not just in using indicators but in understanding their strengths, limitations, and context within the market. By combining trend-following tools with oscillators and volume confirmation, swing traders can systematically identify profitable trading opportunities while managing risk effectively.
Swing trading is both an art and a science. While indicators provide the science, the art comes from interpreting signals, recognizing patterns, and exercising discipline. Over time, with consistent application, swing traders can develop strategies that maximize profits and minimize losses in ever-changing markets.
Option trading 1. What Are Options?
Options are financial contracts that give you the right, but not the obligation, to buy or sell an underlying asset (like a stock, index, or commodity) at a fixed price (strike price) within a certain time period.
Call Option → Right to buy the asset.
Put Option → Right to sell the asset.
👉 You pay a premium to purchase the option.
2. Key Terms in Options
Strike Price: The fixed price at which you can buy/sell the asset.
Premium: The cost of buying the option (like an entry fee).
Expiry Date: Last date the option can be exercised.
In the Money (ITM): Option has profit value.
Out of the Money (OTM): Option has no intrinsic profit value.
Lot Size: Options are traded in fixed quantities, not single shares.
3. How Options Work (Example)
Imagine Reliance stock = ₹2,500.
You buy a Call Option with strike = ₹2,600, expiry in 1 month, premium = ₹50.
If Reliance rises to ₹2,700 before expiry:
You can buy at ₹2,600, sell at ₹2,700 → Profit = ₹100 – ₹50 premium = ₹50.
If Reliance stays below ₹2,600, you don’t exercise → Loss = Premium ₹50.
This way, risk is limited to the premium, but potential profit can be much larger.
4. Types of Option Trading
Buying Calls/Puts → Simple strategy, limited risk.
Writing (Selling) Options → You receive premium but face higher risk.
Spreads & Strategies → Combining multiple options to control risk/reward. Examples:
Bull Call Spread
Bear Put Spread
Straddle
Iron Condor
5. Why Traders Use Options?
Hedging → To protect against losses in existing positions.
Speculation → To bet on price movements with limited capital.
Leverage → Small premium controls large value of stock.
Income → Option sellers earn premium regularly.
6. Pros & Cons of Options
✅ Advantages:
Limited risk (for buyers).
Lower capital needed than buying stocks directly.
Flexible strategies in rising, falling, or sideways markets.
❌ Risks/Challenges:
Complex compared to stock trading.
Sellers have unlimited risk.
Time decay → Options lose value as expiry nears.
👉 In short: Option trading is a flexible and powerful tool, but it requires solid knowledge of risk, pricing, and strategies. Beginners usually start by buying simple calls or puts before moving to advanced spreads and hedging techniques.

Part 2 Support and Resistance1. Time Decay (Theta) in Action
Time decay erodes option premiums daily, faster near expiry. Example: An option priced ₹50 with 10 days left may lose ₹5 daily if underlying doesn’t move. This favors option sellers (who benefit from decay) and hurts option buyers (who need timely moves).
2. Volatility’s Influence on Options
Volatility is the heartbeat of option trading:
Implied Volatility (IV): Future expected volatility, priced into options.
Historical Volatility (HV): Past realized volatility.
If IV is high, premiums rise (good for sellers). Sudden IV drops after events (e.g., budget, results) can crush option buyers despite correct direction.
3. Advantages of Options Trading
Limited risk for buyers.
Lower capital requirement vs. buying stock.
Leverage enhances returns.
Hedging against market risk.
Multiple strategies for bullish, bearish, and neutral views.
This flexibility attracts both traders and investors.
4. Risks of Options Trading
Sellers face unlimited loss risk.
Buyers suffer time decay.
Sudden volatility crush (IV crash).
Complexity of Greeks.
Low liquidity in some stock options.
New traders often underestimate these risks.
5. Option Trading vs Futures Trading
Futures = Obligation to buy/sell at a fixed price.
Options = Right, not obligation.
Futures have linear P/L; options have asymmetric P/L.
Options require deeper risk management (Greeks, IV).
Both can be used together for hedging and speculation.
6. Single-Leg Option Strategies
Long Call: Bullish with limited risk.
Long Put: Bearish with limited risk.
Covered Call: Holding stock + selling call for income.
Protective Put: Holding stock + buying put for downside hedge.
These are basic building blocks.
7. Multi-Leg Option Strategies
Advanced traders combine options for defined outcomes:
Straddle: Buy call + put ATM → volatile move expected.
Strangle: Buy OTM call + OTM put → cheaper volatility bet.
Butterfly Spread: Limited risk, limited reward, range-bound outlook.
Iron Condor: Sell strangle + buy protection → income from low volatility.
8. Hedging with Options
Options allow investors to protect portfolios. Example: A mutual fund holding Nifty stocks can buy Nifty Puts to protect against a sudden crash. Farmers hedge crop prices with commodity options. Hedging reduces risk but costs premium.
9. Options in Intraday Trading
In India, options are heavily used for intraday speculation, especially in Nifty & Bank Nifty weekly contracts. Traders scalp premium moves, delta-neutral setups, or expiry-day theta decay. However, intraday option trading requires discipline due to extreme volatility.
10. Options in Swing and Positional Trading
Swing traders use options to play earnings results, events, or trends. Positional traders might use debit spreads (low risk) or credit spreads (income). Longer-dated options (LEAPS) are used for investment-style plays.

The Future of Futures Trading1. The Evolution of Futures Trading
1.1 Historical Background
Futures trading traces its roots to the agricultural markets of the 19th century. Farmers and merchants used forward contracts to lock in prices for crops, mitigating the risks of fluctuating market prices. The Chicago Board of Trade (CBOT), founded in 1848, became the first organized marketplace for standardized futures contracts, laying the foundation for modern derivatives trading. Over time, the range of underlying assets expanded to include metals, energy products, financial instruments, and more recently, digital assets such as cryptocurrencies.
1.2 The Role of Futures in Modern Markets
Futures serve multiple purposes in today’s markets:
Hedging: Corporations, financial institutions, and investors use futures to protect against price volatility in commodities, currencies, and financial instruments.
Speculation: Traders aim to profit from short-term price movements.
Arbitrage: Futures contracts enable the exploitation of price differences between markets.
Price Discovery: Futures markets provide transparent, real-time pricing signals that guide investment and production decisions globally.
2. Technological Advancements Shaping Futures Trading
2.1 Algorithmic and High-Frequency Trading
Advances in technology have transformed futures trading by introducing algorithmic and high-frequency trading (HFT). These automated systems execute trades at speeds and volumes impossible for human traders, leveraging complex mathematical models to identify arbitrage opportunities, manage risk, and capture microprice movements. HFT has enhanced market liquidity but also raised concerns regarding market stability and fairness.
2.2 Artificial Intelligence and Machine Learning
Artificial intelligence (AI) and machine learning (ML) are increasingly integrated into futures trading. AI algorithms analyze vast amounts of historical and real-time data, including market sentiment, macroeconomic indicators, and news feeds, to forecast price trends. Machine learning models can adapt to changing market conditions, improving predictive accuracy and decision-making efficiency.
2.3 Blockchain and Distributed Ledger Technology
Blockchain technology promises to revolutionize futures trading by increasing transparency, reducing settlement times, and minimizing counterparty risk. Smart contracts can automate trade execution and settlement, ensuring contracts are fulfilled without intermediaries. Exchanges exploring blockchain-based futures platforms may offer faster, more secure, and cost-effective trading environments.
2.4 Cloud Computing and Big Data Analytics
Cloud computing provides scalable infrastructure for processing large datasets, enabling faster trade execution, risk analysis, and scenario modeling. Big data analytics allows traders and institutions to identify patterns, correlations, and anomalies in real-time, enhancing trading strategies and risk management.
3. Globalization and Market Integration
3.1 Expansion of Emerging Market Futures
Emerging markets, particularly in Asia, Latin America, and Africa, are experiencing rapid growth in futures trading. Countries such as India, China, and Brazil are expanding their derivatives markets to provide hedging tools for commodities, currencies, and financial instruments. This expansion increases liquidity, reduces global price volatility, and provides new opportunities for cross-border investment.
3.2 Cross-Market Connectivity
Technological integration allows futures contracts to be traded across multiple exchanges simultaneously. Cross-market connectivity facilitates global arbitrage opportunities, harmonizes pricing, and enhances capital efficiency. As futures markets become increasingly interconnected, price movements in one market can have immediate implications worldwide.
3.3 Rise of Global Commodity Trading Hubs
Key global hubs such as Chicago, London, Singapore, and Dubai continue to dominate futures trading. However, emerging hubs in Asia and the Middle East are gaining prominence due to growing commodity production, technological investment, and regulatory reforms. These hubs will play a pivotal role in shaping the future of global futures trading.
4. Regulatory Evolution
4.1 Current Regulatory Landscape
Futures trading is heavily regulated to ensure market integrity, transparency, and investor protection. Agencies such as the U.S. Commodity Futures Trading Commission (CFTC), the European Securities and Markets Authority (ESMA), and the Securities and Exchange Board of India (SEBI) oversee futures markets. Regulations cover margin requirements, position limits, reporting obligations, and risk management protocols.
4.2 Emerging Regulatory Trends
The future of futures trading will be influenced by new regulatory trends:
Digital Asset Regulation: As cryptocurrency futures gain popularity, regulators are implementing frameworks to ensure investor protection and prevent market manipulation.
Cross-Border Oversight: Harmonizing global regulatory standards may reduce arbitrage and enhance market stability.
Sustainability and ESG Compliance: Futures markets may introduce products linked to environmental, social, and governance (ESG) benchmarks, responding to investor demand for responsible investment.
4.3 Balancing Innovation and Risk
Regulators face the challenge of balancing innovation with risk management. While technology and product innovation enhance efficiency, they also introduce systemic risks, cybersecurity threats, and potential market abuse. Future regulatory frameworks will need to adapt dynamically, leveraging technology for monitoring and enforcement.
5. The Rise of Retail Participation
5.1 Democratization of Futures Trading
Advances in online trading platforms and mobile technology have democratized access to futures markets. Individual investors now participate alongside institutional traders, using tools and analytics previously reserved for professionals. This shift increases market liquidity and widens participation but also introduces behavioral risks, such as overleveraging and speculative bubbles.
5.2 Education and Risk Management
The surge in retail participation highlights the importance of education. Platforms offering tutorials, simulation tools, and real-time market insights empower retail traders to understand leverage, margin requirements, and risk mitigation strategies. Future trends will likely see a blend of technology-driven guidance and personalized AI coaching to enhance trader competency.
6. Emerging Futures Products
6.1 Cryptocurrency Futures
Cryptocurrency futures, such as Bitcoin and Ethereum contracts, have emerged as a new frontier. They allow hedging and speculative opportunities in volatile digital asset markets while integrating traditional financial instruments with blockchain innovation. Regulatory clarity and technological infrastructure will dictate the growth trajectory of crypto futures.
6.2 ESG and Sustainability Futures
Futures linked to carbon credits, renewable energy indices, and other ESG metrics are gaining traction. These products allow investors and corporations to manage environmental risk and align portfolios with sustainability objectives. As global focus on climate change intensifies, ESG-linked futures will likely become mainstream.
6.3 Inflation and Macro-Economic Futures
Products designed to hedge macroeconomic risks, such as inflation swaps or interest rate futures, are evolving. These instruments provide investors and institutions with tools to navigate monetary policy changes, inflationary pressures, and geopolitical uncertainties.
7. Risk Management and Market Stability
7.1 Advanced Hedging Strategies
Futures traders increasingly employ sophisticated hedging strategies using options, spreads, and algorithmic overlays. These strategies enhance capital efficiency, minimize downside risk, and stabilize portfolios during market turbulence.
7.2 Systemic Risk Considerations
The rapid growth of futures trading, high leverage, and technological interconnectivity can contribute to systemic risk. Market crashes, flash events, and cyber threats necessitate robust risk frameworks, continuous monitoring, and stress-testing mechanisms.
7.3 Future of Clearing and Settlement
Central clearinghouses play a critical role in mitigating counterparty risk. Innovations in blockchain-based clearing could enable real-time settlement, reducing systemic exposure and improving capital utilization. The future will likely see hybrid models combining centralized oversight with decentralized technology.
8. Technological Disruption and Market Efficiency
8.1 Predictive Analytics and Sentiment Analysis
The use of AI-driven sentiment analysis allows traders to anticipate market moves based on news, social media, and macroeconomic events. Predictive analytics transforms data into actionable insights, improving execution strategies and risk-adjusted returns.
8.2 Smart Contracts and Automated Execution
Smart contracts can automate futures trade execution, margin calls, and settlements. This automation reduces human error, increases transparency, and lowers operational costs. As adoption grows, smart contracts could redefine the operational landscape of futures exchanges.
8.3 Integration with IoT and Real-World Data
The Internet of Things (IoT) and real-time data feeds enable futures contracts to be linked to tangible metrics, such as agricultural yield, energy consumption, or shipping logistics. This integration increases contract accuracy and enables innovative products tailored to industry-specific risks.
9. Challenges and Opportunities
9.1 Cybersecurity Threats
As technology permeates futures trading, cybersecurity becomes a critical concern. Exchanges, brokers, and trading platforms must invest in robust security protocols to prevent data breaches, fraud, and market manipulation.
9.2 Market Volatility and Speculation
High-frequency trading, retail participation, and leveraged products can exacerbate market volatility. Effective risk management, regulatory oversight, and trader education are essential to mitigate speculative excesses.
9.3 Global Geopolitical Risks
Geopolitical events, trade disputes, and monetary policy shifts can impact futures markets significantly. Traders must integrate macroeconomic intelligence and scenario analysis into decision-making frameworks.
9.4 Opportunities for Innovation
The fusion of AI, blockchain, and global connectivity opens unprecedented opportunities. New product classes, algorithmic strategies, and cross-border trading platforms will redefine how futures markets operate, providing efficiency, transparency, and inclusivity.
10. The Future Outlook
10.1 Technology-Driven Evolution
The future of futures trading is inherently tied to technology. AI, ML, blockchain, cloud computing, and big data will continue to transform market structure, execution, and risk management.
10.2 Global Market Integration
Emerging markets and cross-border trading will deepen market integration, providing new opportunities for diversification and price discovery.
10.3 Regulatory Adaptation
Dynamic, technology-aware regulatory frameworks will balance innovation with investor protection and systemic stability.
10.4 Expanding Product Horizons
From digital assets to ESG-focused contracts, futures trading will diversify to meet the evolving needs of participants and the global economy.
10.5 Democratization and Education
Greater retail participation, combined with technology-driven education, will democratize access while enhancing market sophistication and resilience.
Conclusion
Futures trading has evolved from simple agricultural contracts to a sophisticated, technology-driven, and globally interconnected ecosystem. The future promises even greater transformation, driven by AI, blockchain, data analytics, and globalization. While challenges such as market volatility, cybersecurity, and regulatory compliance persist, the opportunities for innovation, efficiency, and inclusivity are immense.
The success of futures trading in the next decades will depend on the ability of exchanges, regulators, traders, and technology providers to adapt, innovate, and collaborate. The markets of tomorrow will be faster, smarter, more accessible, and more resilient, offering tools for hedging, speculation, and price discovery that are more advanced and integrated than ever before. Futures trading will not just reflect the pulse of the global economy—it will actively shape it.
PCR Trading Strategies1. The Psychology of Option Trading
Options magnify emotions: greed (unlimited gains) and fear (time decay, sudden loss). Many traders lose due to overleveraging, chasing cheap OTM options, or not respecting stop-loss. Psychological discipline is as vital as technical knowledge.
2. Option Chain Analysis
An option chain shows all available strikes, premiums, OI (open interest), IV, etc. Traders analyze max pain, OI build-up, and put-call ratio (PCR) to gauge market sentiment. Option chains are powerful tools for directional and volatility analysis.
3. Role of Market Makers in Options
Market makers provide liquidity by quoting bid-ask spreads. They profit from spreads and hedging but ensure smoother trading. Without them, option spreads would widen, making it harder for retail traders to enter/exit efficiently.
4. Index Options vs Stock Options
Index Options (e.g., Nifty, Bank Nifty): Cash-settled, high liquidity, lower manipulation risk.
Stock Options: Physical settlement (delivery), less liquid, but higher potential returns.
Retail traders prefer index options; institutions often hedge with stock options.
5. Option Writing as a Business
Many professional traders treat option writing like a business: selling high IV options, hedging risk, managing spreads. Profits come steadily from time decay, but big moves can wipe out capital if risk isn’t managed with stop-loss or hedges.
6. Options and Event Trading
Events like earnings, RBI policy, budget, elections, or global news drastically affect IV. Traders buy straddles/strangles pre-event, and sellers wait for IV crush post-event. Understanding event volatility cycles is key.
7. Taxation of Options Trading in India
Profits from option trading are treated as business income under Indian tax law. Traders must maintain proper records, pay GST in some cases, and file ITR with audit if turnover exceeds limits. This is often ignored by beginners.
8. Technology and Algo in Options
With algo trading, institutions dominate options using complex models (volatility arbitrage, delta-hedging). Retail traders now use option analytics platforms, scanners, and automation tools to compete. Speed and data-driven execution matter more today.
9. Common Mistakes in Option Trading
Buying cheap OTM lottery tickets.
Ignoring IV crush.
Selling naked options without hedge.
Overtrading on expiry days.
Neglecting stop-loss and money management.
Most retail losses come from these errors.
10. The Future of Option Trading
Option trading is growing rapidly in India with weekly expiries, retail participation, and technology. Innovations like zero-day options (0DTE) in the US may come to India. Education, discipline, and structured strategies will define success. The future promises wider accessibility but higher competition as retail meets institutional algos

Part 6 Learn Institutional Trading1. Advantages of Options Trading
Leverage: Control larger positions with smaller capital.
Flexibility: Numerous strategies to profit in rising, falling, or stagnant markets.
Hedging: Reduce risk of adverse price movements.
Income Generation: Selling options can generate additional income.
Defined Risk for Buyers: Buyers can only lose the premium paid.
2. Risks and Challenges in Options Trading
Complexity: Options require deep understanding; mistakes can be costly.
Time Decay (Theta): Options lose value as expiration approaches.
Market Volatility: Sudden moves can amplify losses for sellers.
Liquidity Risk: Some options have low trading volumes, making entry and exit difficult.
Leverage Risk: While leverage amplifies profits, it also magnifies losses.
3. Practical Steps to Start Options Trading
Open a Trading Account: With a SEBI-registered broker.
Understand Margin Requirements: Options may require initial margins for writing strategies.
Learn Option Greeks: Delta, Gamma, Theta, Vega, and Rho affect pricing and risk.
Practice with Simulations: Use paper trading before committing real capital.
Develop a Trading Plan: Define goals, strategies, risk tolerance, and exit rules.
Continuous Learning: Markets evolve, so staying updated is crucial.
4. The Greeks: Understanding Option Sensitivities
Option Greeks measure how the option price responds to changes in various factors:
Delta: Sensitivity to the underlying asset’s price change.
Gamma: Rate of change of delta.
Theta: Time decay impact on the option’s price.
Vega: Sensitivity to volatility changes.
Rho: Sensitivity to interest rate changes.
Greeks help traders manage risk and optimize strategies.
5. Real-World Examples of Options Trading
Example 1: Hedging with Puts
Investor holds 100 shares of a stock at ₹2,000 each.
Buys 1 put option at strike price ₹1,950 for ₹50.
If stock falls to ₹1,800, the put option gains ₹150, limiting overall loss.
Example 2: Speculation with Calls
Trader expects stock to rise from ₹1,000.
Buys a call at strike price ₹1,050 for ₹20.
Stock rises to ₹1,100, call’s intrinsic value becomes ₹50.
Profit = ₹30 per share minus premium paid.

Part 3 Learn Institutional Trading1. Introduction to Options Trading
Options trading is one of the most versatile and widely used financial instruments in modern financial markets. Unlike stocks, which represent ownership in a company, options are derivative contracts that give the holder the right, but not the obligation, to buy or sell an underlying asset at a predetermined price within a specified period.
Options trading can be used for speculation, hedging, and income generation. Due to their unique characteristics, options are considered advanced financial instruments that require a solid understanding of market dynamics, risk management, and strategy planning.
2. Understanding the Basics of Options
2.1 What Are Options?
An option is a contract between two parties – the buyer and the seller (or writer). The contract is based on an underlying asset, which could be:
Stocks
Indices
Commodities
Currencies
ETFs (Exchange Traded Funds)
Options come in two main types:
Call Options – Give the holder the right to buy the underlying asset at a predetermined price (strike price) within a specified period.
Put Options – Give the holder the right to sell the underlying asset at the strike price within a specified period.
2.2 Key Terms in Options Trading
Understanding options terminology is crucial:
Strike Price (Exercise Price): The price at which the underlying asset can be bought or sold.
Expiration Date: The date on which the option contract expires.
Premium: The price paid by the buyer to purchase the option.
In-the-Money (ITM): An option has intrinsic value (e.g., a call option is ITM if the underlying asset price is above the strike price).
Out-of-the-Money (OTM): An option has no intrinsic value (e.g., a put option is OTM if the underlying asset price is above the strike price).
At-the-Money (ATM): The option’s strike price is equal or very close to the current price of the underlying asset.
Intrinsic Value: The difference between the current price of the underlying asset and the strike price.
Time Value: The portion of the option’s premium that reflects the potential for future profit before expiration.
2.3 How Options Work
Options provide leverage, meaning a small amount of capital can control a larger position in the underlying asset. For example, buying 100 shares of a stock may cost ₹1,00,000, whereas purchasing a call option for the same stock may cost only ₹10,000, offering a similar profit potential if the stock moves favorably.
The profit or loss depends on:
The difference between the strike price and the market price.
The premium paid for the option.
The time remaining until expiration.

IRCTC 1 Day View📈 Key Intraday Levels
Opening Price: ₹722.05
Day’s High: ₹724.85
Day’s Low: ₹714.60
Closing Price: ₹719.20
🔍 Technical Indicators
Support Level: ₹719.20 – This level is backed by accumulated volume, suggesting it may act as a reliable support point.
Resistance Level: ₹729.30 – The short-term moving average indicates this as a potential resistance point.
Volatility: The stock exhibited a 1.25% intraday range, with average daily volatility around 1.12%, indicating relatively stable movements.
📊 Momentum Indicators
Stochastic RSI: Currently in a neutral zone, suggesting neither overbought nor oversold conditions.
Rate of Change (ROC): Indicates a neutral condition, with no strong momentum in either direction.
Commodity Channel Index (CCI): Also in a neutral range, reflecting a lack of strong trend.
🛡️ Risk Management
Suggested Stop-Loss: ₹683.68 – Given the stock's low daily volatility, this stop-loss level offers a conservative risk management approach.
📌 Summary
IRCTC's stock is currently trading within a defined range, with support at ₹719.20 and resistance around ₹729.30. Momentum indicators suggest a neutral stance, indicating a wait-and-watch approach may be prudent for short-term traders. For those considering a longer-term perspective, the stock's low volatility and established support levels could present opportunities for accumulation, especially if it maintains above the ₹719.20 support.
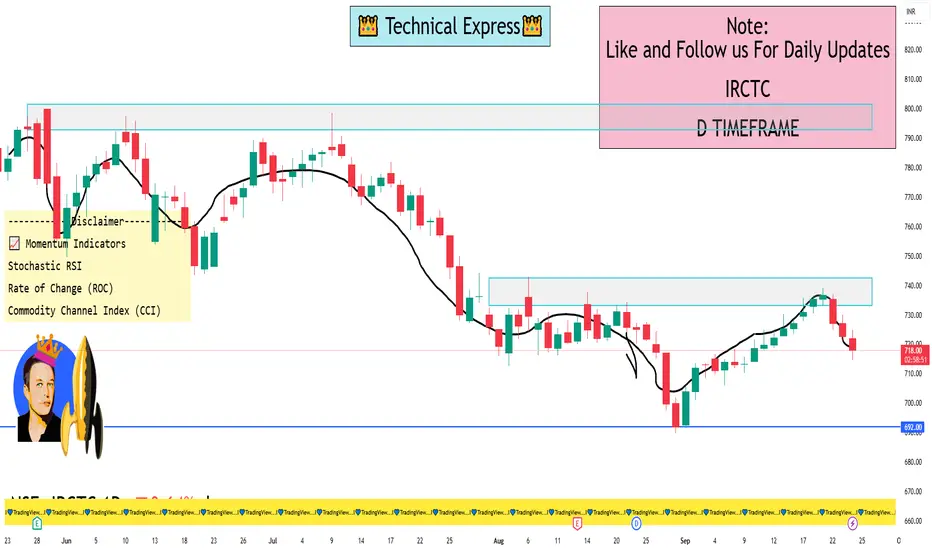
KERNEX 1 Day View📈 Technical Indicators (Daily Time Frame)
Overall Signal: Strong Buy
Moving Averages:
5-day: ₹1,113.28 (Sell)
50-day: ₹1,099.71 (Buy)
200-day: ₹1,087.01 (Buy)
Fibonacci Pivot Point: ₹1,114.13
Relative Strength Index (RSI): 52.5 — Neutral
MACD: +2.82 — Bullish
Technical Indicators: 3 Buy, 2 Sell
These indicators suggest a continuation of the current upward momentum, though the neutral RSI indicates caution against overbought conditions.
📊 Recent Price Action
The stock closed at ₹1,106.00 on September 23, 2025, marking a 0.89% increase from the previous day. The day's range was ₹1,082.00–₹1,125.00, with a volume of 65,740 shares.
🔮 Price Forecast
Short-term forecasts suggest a potential pullback to ₹1,075.70, possibly due to profit-taking or market consolidation.
📌 Conclusion
Kernex Microsystems India Ltd is currently in a strong bullish phase on the daily chart, supported by favorable moving averages and MACD. However, the neutral RSI and short-term price forecasts indicate a need for caution. Investors should monitor for any signs of reversal or consolidation before making further decisions.
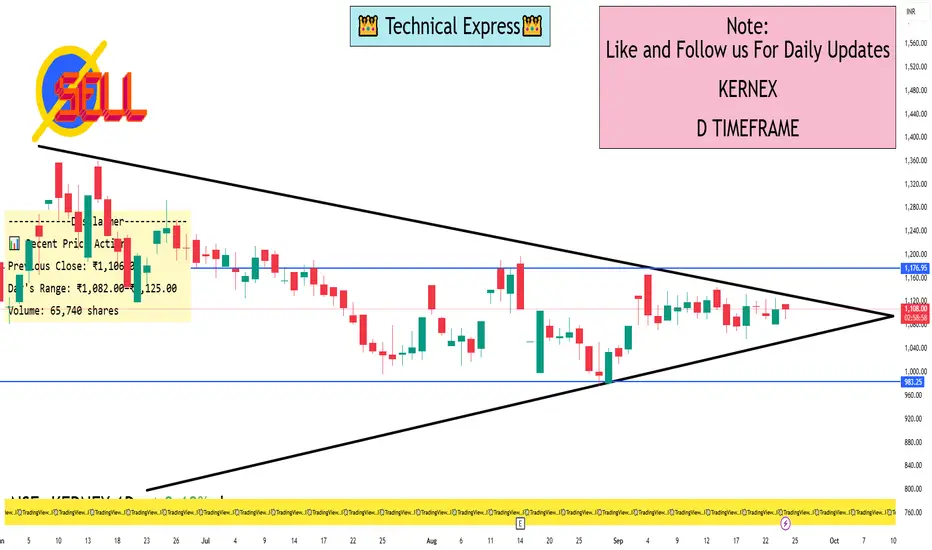
Understanding the Psychology of Trading1. The Role of Psychology in Trading
Trading is a mental battlefield. Financial markets are complex systems influenced by countless variables, from economic data and geopolitical events to investor sentiment. However, the human mind is inherently emotional, often reacting irrationally to market fluctuations.
Even the most robust trading strategies can fail if a trader cannot manage emotions such as fear, greed, overconfidence, or frustration. Psychological discipline ensures traders follow their plans consistently, avoid impulsive decisions, and maintain a long-term perspective. Studies suggest that over 80% of trading mistakes are rooted in poor psychological management rather than technical errors.
Key aspects of trading psychology include:
Emotional regulation: Maintaining composure in the face of gains and losses.
Cognitive control: Avoiding biases that cloud judgment.
Discipline: Following trading rules and strategies without deviation.
Resilience: Recovering quickly from losses and mistakes.
2. Common Emotional Traps in Trading
2.1 Fear
Fear is perhaps the most pervasive emotion in trading. Fear manifests in several ways:
Fear of losing: Traders may hesitate to enter positions, missing opportunities.
Fear of missing out (FOMO): Conversely, traders may impulsively enter trades to avoid missing profits, often at unfavorable prices.
Fear after losses: A losing streak can lead to panic and overly cautious behavior, reducing trading effectiveness.
Example: A trader sees a strong upward trend but hesitates due to fear of a sudden reversal. By the time they act, the price has already surged, causing frustration and regret. This cycle often leads to indecision and missed profits.
2.2 Greed
Greed is the desire for excessive gain, often leading to poor risk management. Traders may hold on to winning positions too long, hoping for unrealistic profits, or take excessive risks to recover previous losses.
Example: A trader makes a small profit but refuses to exit, hoping for a bigger gain. Suddenly, the market reverses, and the profit evaporates, turning into a loss.
2.3 Overconfidence
After a series of successful trades, traders may develop overconfidence, believing they are infallible. This often leads to reckless trades, ignoring risk management rules, and underestimating market volatility.
2.4 Impatience
Markets do not always move predictably. Impatience causes traders to enter or exit positions prematurely, deviating from their strategy. The result is frequent small losses that accumulate over time.
3. Cognitive Biases in Trading
Cognitive biases are systematic thinking errors that affect decision-making. Recognizing these biases is crucial for traders.
3.1 Confirmation Bias
Traders often seek information that confirms their existing beliefs while ignoring contrary evidence. This bias can lead to holding losing positions or entering trades without proper analysis.
3.2 Anchoring Bias
Anchoring occurs when traders fixate on specific price levels or past outcomes, influencing future decisions irrationally. For instance, a trader may refuse to sell a stock below their purchase price, even when fundamentals have deteriorated.
3.3 Loss Aversion
Humans are naturally more sensitive to losses than gains. In trading, loss aversion may prevent traders from cutting losses early, hoping the market will turn, which often worsens financial outcomes.
3.4 Recency Bias
Traders give undue weight to recent events, assuming trends will continue indefinitely. This bias can cause chasing performance or overreacting to short-term market moves.
4. The Importance of Discipline in Trading
Discipline is the bridge between strategy and execution. A disciplined trader follows a clear set of rules and adheres to risk management, regardless of emotional fluctuations.
4.1 Developing a Trading Plan
A trading plan is a blueprint that defines:
Entry and exit criteria
Risk-reward ratio
Position sizing
Trade management rules
Example: A trader may decide to risk only 2% of their account on a single trade and exit if losses reach that limit. Following this plan consistently prevents emotional decisions and catastrophic losses.
4.2 Sticking to Risk Management
Risk management is the cornerstone of psychological stability. Setting stop-losses, diversifying trades, and controlling leverage ensures that no single loss can devastate your account or trigger panic.
5. Emotional Control Techniques
Successful traders develop mental strategies to control emotions and maintain focus.
5.1 Mindfulness and Meditation
Mindfulness techniques improve awareness of thoughts and feelings, helping traders remain calm during volatility. Meditation has been shown to reduce stress and improve decision-making under pressure.
5.2 Journaling
Maintaining a trading journal helps identify recurring emotional patterns and mistakes. By recording each trade, the rationale behind decisions, and emotional states, traders can objectively review performance and refine their strategies.
5.3 Routine and Preparation
A structured daily routine reduces emotional fatigue. Preparation includes reviewing charts, setting alerts, and defining trading goals before market hours.
5.4 Breathing and Relaxation Techniques
Simple breathing exercises can reduce stress during high-pressure trading moments, preventing impulsive decisions.
6. Building a Resilient Trading Mindset
6.1 Accepting Losses as Part of Trading
Losses are inevitable in trading. Accepting them as a natural part of the process prevents emotional spirals and promotes learning from mistakes.
6.2 Focusing on Probabilities, Not Certainties
Markets are probabilistic. Traders must view each trade as a calculated bet, not a guaranteed outcome. Focusing on risk-reward ratios and statistical probabilities reduces emotional overreactions to individual trades.
6.3 Continuous Learning and Adaptation
Markets evolve, and so should traders. A resilient mindset embraces learning from both successes and failures, adapting strategies to changing market conditions.
7. Psychological Traits of Successful Traders
Through observation and research, several psychological traits consistently appear in successful traders:
Patience: Waiting for the right setup rather than forcing trades.
Discipline: Adhering to plans and strategies without deviation.
Emotional stability: Remaining calm under pressure.
Self-awareness: Recognizing personal biases and tendencies.
Confidence without arrogance: Trusting analysis without reckless behavior.
Adaptability: Adjusting strategies as markets evolve.
8. Avoiding Psychological Pitfalls
8.1 Overtrading
Overtrading is driven by boredom, greed, or the desire to recover losses. It usually results in higher transaction costs and emotional exhaustion. Limiting the number of trades and focusing on quality setups can mitigate this.
8.2 Revenge Trading
After a loss, some traders attempt to “win back” money through aggressive trades. This emotional reaction often leads to larger losses. Accepting losses calmly and returning to a plan is key.
8.3 Chasing the Market
Jumping into trades based on hype or short-term trends often results in poor entries and exits. Patience and adherence to trading plans prevent this behavior.
9. Developing Mental Strength Through Simulation and Practice
Simulation trading or “paper trading” allows traders to practice strategies without financial risk. This helps build psychological resilience, test reactions to losses, and develop disciplined trading habits. Reviewing simulated trades offers insights into emotional patterns and decision-making flaws.
10. Integrating Psychology Into Strategy
Successful trading requires the integration of psychological awareness into technical and fundamental strategies. Some approaches include:
Pre-trade checklist: A psychological and analytical checklist ensures readiness for trades.
Post-trade reflection: Assessing decisions objectively to identify emotional interference.
Routine review sessions: Weekly or monthly analysis of trades to refine strategy and mindset.
11. Real-World Examples of Psychological Trading
George Soros: Known for his high-risk trades, Soros emphasizes the importance of understanding one’s own psychology and the market’s reflexive behavior. His success stemmed from disciplined risk management and emotional control, even in volatile markets.
Jesse Livermore: Despite enormous successes, Livermore’s career was marked by the dangers of emotional trading, including overconfidence and revenge trading. His life highlights the balance between psychological mastery and the destructive power of unchecked emotions.
Retail Traders: Many retail traders fail due to emotional decision-making, overtrading, and lack of risk discipline. Psychological resilience differentiates consistent winners from occasional profitable traders.
12. Conclusion
Trading is as much a psychological pursuit as it is a technical or analytical one. Emotional regulation, cognitive control, discipline, and resilience are crucial for consistent success. Understanding one’s own mind, recognizing biases, and developing a disciplined, patient approach transforms trading from a high-stress gamble into a strategic, probabilistic endeavor.
Mastering the psychology of trading is an ongoing journey. It requires self-awareness, continuous learning, and practice. By integrating psychological insights into trading strategies, traders can navigate market volatility with confidence, make rational decisions, and achieve long-term profitability.
In short, the mind is the ultimate trading tool. Sharpen it, discipline it, and respect it, and the markets become not just a place of opportunity, but a mirror reflecting your mastery over fear, greed, and uncertainty.