HeranbaSwing Trade -
Look interesting at current level - still closing pending
If today close above break out level
Maybe we can see Good move upside.
Risk around 8-10% around
Target next resistance
Trade!

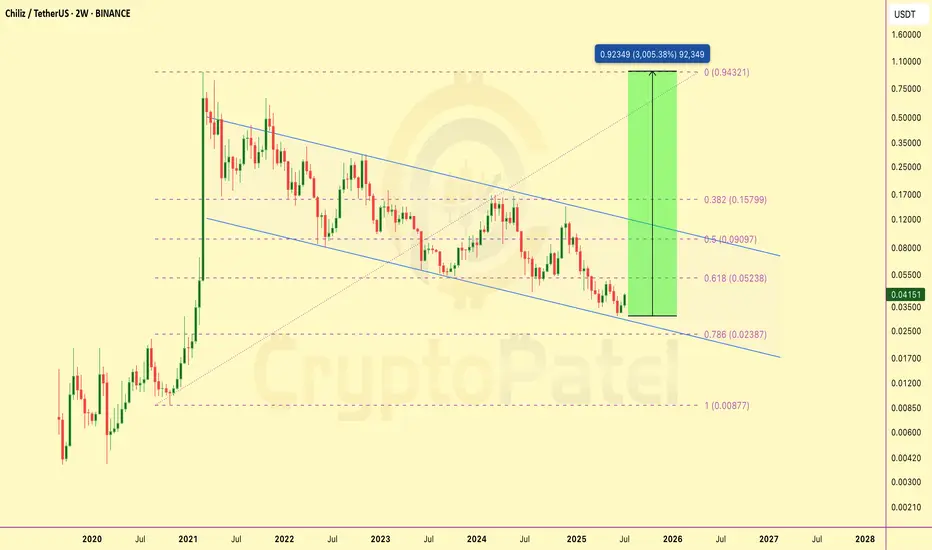
$CHZ did a 30x in 2021. Nobody cared until it was too lateBack in 2021, Chiliz ( GETTEX:CHZ ) delivered a 30x move — climbing from a $130M to $4B market cap in just a month. That move was fueled by strong fundamentals and massive hype around fan tokens.
Fast forward to now — price is sitting at the bottom of a multi-year falling wedge on the 2W timeframe. It just tapped the 0.786 Fibonacci retracement and showed a strong bounce with rising volume — a classic sign of potential reversal.
With solid partnerships, real-world utility, and a historical setup this clean, I’ve started building my position here. If the wedge breaks out, upside targets line up around $0.05 → $0.09 → $0.15 → $0.90 — back toward ATH levels.
Bottom might be in. Watch this closely.
Note: NFa & DYOR
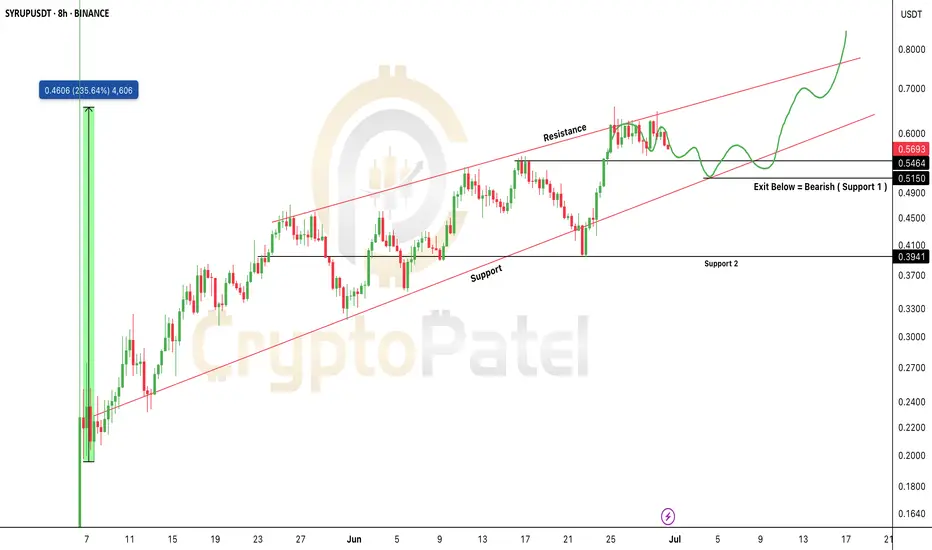
$SYRUP Price Prediction Analysis as per Ascending ChannelSYRUP/USDT – Technical Chart Update (8H Timeframe)
SYRUP is trading inside a clean ascending channel, showing a bullish structure with higher highs and higher lows.
Key Levels to Watch:
Support: $0.51
Resistance Targets: $0.70 → $0.80+
Exit Level: Bearish if price breaks below $0.51
Current Setup:
Price is respecting the lower trendline of the channel. A bounce here could lead to another leg up toward resistance.
Strategy:
Bullish bias as long as SYRUP holds above $0.51
Ideal zone to look for buy opportunities on dips
Exit or hedge if price closes below $0.51
Important Note:
If CRYPTOCAP:SYRUP holds the $0.51 support, it could soon enter the $1 club 🚀
But if it drops below $0.50, we may see a 30–50% retracement.
So always watch the chart closely before entering any trades.
Note: NFA & DYOR
Bitcoin Price Analysis 21-22 June 2025COINBASE:BTCUSD is in downtrend.
STRATEGY:
1. If the price breaks above the upper level, consider a long position. This is supported by the higher lows formation in a smaller timeframe, suggesting a continuation of the upward trend.
2. Bearish Scenario: If the price breaks below the lower level, consider a short position, targeting potential stop-loss orders or liquidity pools created during the higher lows formation.
AREA TO AVOID
Area between the upper and lower levels due to price consolidation.

NIFTY FINANCE H4, THERE'S POSSIBLITY OF SHORT THINGS FOUND
-T-LINE Breakdown & Retest
-Pending Liquidity
-Upside liquidity sweeped today
- HUGE GAP DOWN SIDE EXPECTED TO FILLED
TLL THEN , STAY FOCUSED

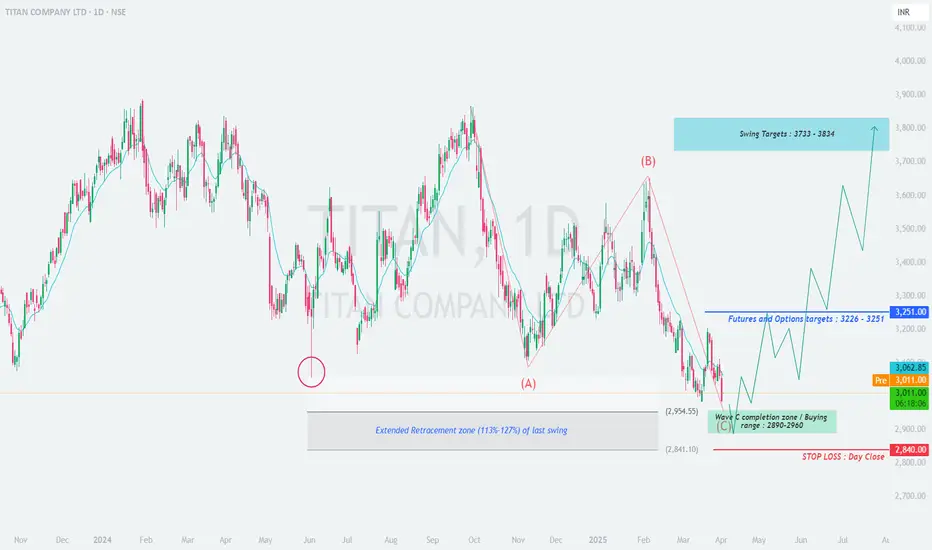
TITAN - High Probability Reversal SetupTITAN COMPANY LTD (NSE:TITAN) - High Probability Reversal Setup
Weekly Timeframe Analysis | Potential Swing Trade Opportunity
▲ BULLISH CASE
Elliott Wave Structure:
• Appears to be completing Wave C of correction (ABC pattern)
• Wave C = 1.272 extension of Wave A at ₹2,890-2,960 zone
• Typical reversal area for such corrections
Technical Confluences:
• Fibonacci Support:
1.127-1.272 retracement of prior uptrend
Aligns with 2023 swing high area
• Volume Profile:
High volume node at ₹2,920
Declining volume on recent downmove
Pattern Recognition:
• Potential falling wedge (bullish)
• RSI(14) weekly showing bullish divergence
• MACD histogram flattening near lows
▼ RISK FACTORS
• Breakdown below ₹2,840 invalidates setup
• Broader market weakness could delay recovery
• FIIs reducing positions in consumer sector
📊 Trade Plan
Entry Zone: ₹2,890-2,960 (scale-in approach recommended)
Stop Loss: Daily close below ₹2,840 (absolute)
Targets:
T1: ₹3,226 (61.8% retrace)
T2: ₹3,733 (previous high)
T3: ₹3,834 (127% extension)
Timeframe: 8-12 week hold for full targets
📌 Key Levels
Support
Resistance
₹2,960 (immediate)
₹3,100 (200 DMA)
₹2,890 (strong)
₹3,226 (F&O OI peak)
₹2,840 (absolute)
₹3,733 (ATH)
💡 Additional Notes:
• Watch for bullish reversal candle patterns in the zone
• FII derivative data shows put writing at ₹2,900 strike
• Consumer sector showing relative strength vs Nifty
Would you take this trade? Discuss in comments!
#TITAN,#NSE,#swingtrading,#elliottwave,#technicalanalysis
Explosive Price Action in Premier Explosives – The Name Says It 🧠 Key Technical Insights:
✅ Main Counter-Trendline (CT) Breakout:
A clean breakout above the white CT line with a strong, high-volume bullish candle. This confirms a reversal of the prior corrective structure.
✅ Hidden Resistance Cleared:
The breakout also pierced a WTF hidden line (dotted white), further validating momentum.
✅ SD Conversion Zone Flip:
The green zone highlights a supply-to-demand flip. Price has respected this zone multiple times and now turned it into strong demand support — a textbook S→D conversion.
✅ Candle Structure:
The breakout candle not only has volume and size, but also follows a healthy higher low structure — signifying smart accumulation.

EURGBP (2H) Technical AnalysisPair: EUR/GBP
Timeframe: 2H (2-hour)
Bias: Bearish
Structure: Bear Flag / Descending Channel
Current Price: ~0.8456
📐 Chart Breakdown
1. Bearish Descending Channel
Price has been respecting a clear descending channel with lower highs and lower lows.
The current move is a bearish breakout below the channel support line.
This shows strong selling pressure.
2. Breakout & Retest Structure
A breakout has already occurred, and price is now attempting to retest the broken support (which is now acting as resistance).
This is a textbook bearish continuation setup.
3. Key Supply Zone: 0.8485–0.8495
There's a strong supply zone above, confirmed by multiple rejections and wicks.
This acts as an ideal stop-loss zone.
4. Clean Target Zone (Demand): 0.8320–0.8375
A wide demand zone is seen around 0.8320–0.8375.
Previous bullish impulsive move originated from this area.
Perfect level to take profit as buyers may return here.
🧾 Trade Plan – Short Setup
Entry Stop Loss Take Profit Risk:Reward
0.8450–0.8465 (retest area) 0.8495 (above supply) 0.8375 (or partial at 0.8400) 1:2.5 to 1:3+
✅ Confluences Supporting the Bearish Setup
Confluence Details
✅ Descending Channel Market consistently making lower highs and lows.
✅ Breakout + Retest Price broke structure and is retesting the neckline.
✅ Supply Zone Above Perfect invalidation level at 0.8495.
✅ Momentum Shift Clean bearish candles and lack of bullish follow-through.
✅ Wide Clean Target Area 0.8320–0.8375 demand area visible and untested.
🚫 Invalidation
If price closes above 0.8495, bearish setup is invalid.
A strong bullish engulfing from here may signal a reversal back into the channel.
📊 Trade Management Tips
Aggressive Entry: Enter at 0.8455–0.8465 (current retest zone).
Conservative Entry: Wait for rejection candle (bearish engulfing or pin bar).
Trail SL after hitting 1:1.
Partial TP at 0.8400, final at 0.8375–0.8320.

XAUUSD Bullish Breakout with Retest & Rally Setup (1H Chart) Pair: XAUUSD (Gold vs US Dollar)
Timeframe: 1 Hour (1H)
Market Bias: Bullish
Strategy Type: Trendline Breakout + Order Block Retest + Liquidity Sweep + Momentum Continuation
📊 Technical Analysis:
🔹 1. Trendline Breakout:
A major descending trendline (bearish structure) was cleanly broken with strong bullish momentum.
This is a market structure shift and indicates potential trend reversal or at least a short-term bullish rally.
🔹 2. Break of Structure & Demand Zones:
Price broke above a key resistance zone (previous supply) around 3360, turning it into support/demand.
A new bullish order block (OB) is visible just below current price (~3340–3350), now acting as an entry zone.
A lower OB zone (~3300–3320) has been left unmitigated, which could act as a second deeper entry point if price retraces further.
🔹 3. Imbalance/Fair Value Gap (FVG):
There is a clean imbalance left between the current price and the lower OB. Price may wick into this zone before rallying.
This imbalance is acting like a magnet and could invite a retracement into the 3340–3320 zone.
🔹 4. Liquidity Engineering:
Buy-side liquidity was likely swept above the trendline break and recent highs.
Sellers trapped above the trendline may give fuel for a deeper push toward the next supply zone.
🔹 5. Target Supply Zone:
A clean and unmitigated supply zone lies between 3480–3500, the ultimate target for bulls if momentum sustains.
📍 Key Levels:
Type Price Range (Approx)
Current Price 3360.90
Entry Zone 1 (OB 1H) 3340 – 3350
Entry Zone 2 (OB 1H) 3300 – 3320
Target Supply Zone 3480 – 3500
Invalidation Below 3300
🎯 Trade Idea:
Entry: On bullish confirmation at 3340–3350 or deeper at 3300–3320
Stop Loss: Below 3300 (structure break + OB invalidation)
Target: 3480–3500 (clean supply zone above)
Risk-to-Reward (R:R): ~1:3 to 1:5 depending on entry zone
✅ Confluences Supporting This Setup:
✅ Trendline break + retest setup
✅ Price flipped previous resistance into support
✅ Strong bullish impulse breaking structure
✅ Bullish Order Block + Fair Value Gap (FVG) below price
✅ Clean upside liquidity pool in untested supply zone
✅ Momentum breakout candle confirms buyer strength
⚠️ Invalidation Criteria:
Breakdown and 1H close below 3300 invalidates the OB and bullish structure.
Be cautious around NFP or Fed-related news, which may spike volatility.
🔁 Potential Scenarios:
📈 Bullish Continuation:
Price retests OB (3340–3350), finds support, and rallies directly to 3480–3500.
🔁 Deeper Retracement:
Price may wick into the lower OB at 3300–3320 to grab liquidity, then rally.
❌ Invalidation:
Breakdown below 3300 = bearish reversal or deeper correction incoming.
📘 Summary Table:
Parameter Value
Bias Bullish
Entry Zone(s) 3340–3350 (primary), 3300–3320
Stop Loss Below 3300
Take Profit 3480–3500
Strategy Trendline Break + OB Retest + Imbalance
Confluences Break of Structure, Demand Zones, FVG, Trendline Break

ETH/USD Bearish Reversal Setup – Targeting $1,470 After ResistanPair: Ethereum / U.S. Dollar (ETH/USD)
Exchange: Coinbase
Timeframe: 15 minutes
Indicators:
EMA 30 (red line): ~1635.82
EMA 200 (blue line): ~1585.79
🟣 Key Levels & Zones
Resistance Zone (Purple Rectangle Top): Around $1,647 – previously tested and rejected.
Support Zone (Purple Rectangle Bottom): Around $1,470 – marked as the "EATARGET POINT".
Current Price: ~$1,645
📉 Bearish Breakdown Setup
Chart Pattern: There’s a potential double top or distribution zone forming near the resistance.
Projection: The price is expected to break below the smaller support zone and drop to the target zone around $1,470.67, representing an 11.13% drop.
Measured Move Tool: Indicates a bearish price target if the price breaks down from the current consolidation.
✅ Confluence
Price is currently hovering under resistance.
EMAs show short-term bullish momentum but could flatten if breakdown confirms.
Support near $1,635 is being tested – a break below could trigger the expected drop.
⚠️ Trading Implications
Short Setup: A trader might look to enter short around $1,647 if breakdown confirmation occurs.
Stop Loss: Just above the resistance zone (~$1,650+).
Take Profit: Near $1,470 zone.

#Bitcoin 30 Minutes Chart Scalp profit Update:#Bitcoin 30 Minutes Chart Scalp Profit Update:
That quick scalp move delivered a clean +3.60% — just as planned. Scalp trades are meant for small, fast targets, and this one hit perfectly. ✅
But If Still holding?
🔹 Move SL to Break Even to protect capital
🔹 Structure looks fine for now, but don’t get greedy — manage your risk.
Always trade with a plan.
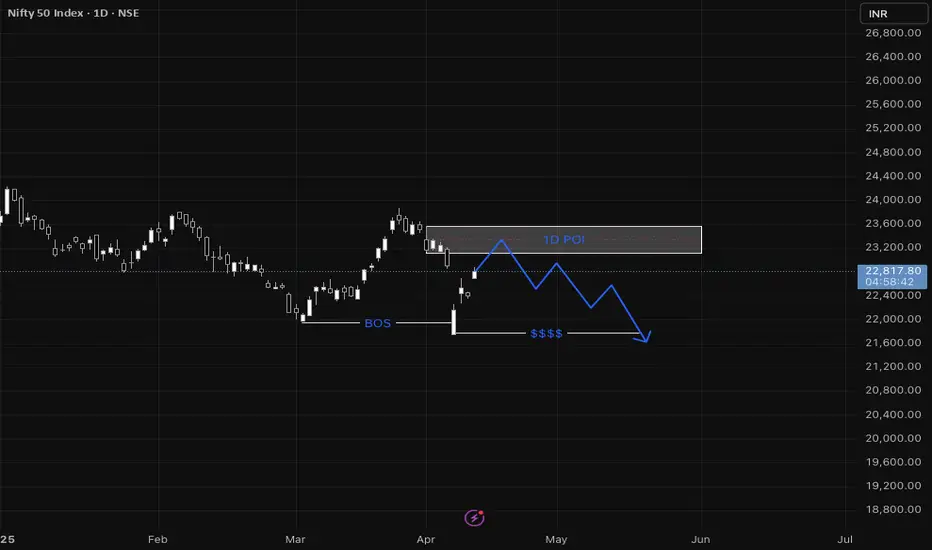
NIFTYNifty has broken structure on the daily timeframe. I’m now waiting for it to collect liquidity and retest the daily point of interest. Looking for confirmation on the one-hour timeframe is a strategic approach to refine the entry.
Gold 08 april morning trade explanationHello
It's a jayesh balar.
If you have a any "Questions"
Ask me in comment
If my analysis is helpful,
press booster bottom.

NIFTYAfter a meaningful descending triangle, an open expanding triangle has been detected. For Nifty to continue moving up, at least one support is required on this triangle, and this dip will be called as The TRUMP Effect. in.tradingview.com

BANKNIFTYBank Nifty has taken support and shown a change of character on the daily timeframe. I’m now waiting for it to collect liquidity and retest the daily point of interest. Seeking confirmation on the one-hour timeframe would also be a prudent approach.

Gold silver update next Our Spot #Gold Range Prediction from 31/03/2025 to 04/04/2025 is as under.
Gold Spot : 3023$-3126$
Gold INR : 88100-91050
Our Spot #Silver Range prediction from 31/03/2025 to 04/04/2025 is as under.
Silver Spot: 33.44$-35.05$
Silver INR: 98400-103200
It must be remembered that price of precious metal depends on so many world wide factors like inflation, Fed interest rate, trade barrier, geopolitical tension, demand, supply, bond yield, dollar index , GDP, payroll data, CPI, currency fluctuation, debt ceiling , expected tax & duty changes, other commodity price crude oil etc. etc. and hence there can not be any accurate barometer of predicting precious metal price.
Gold INR has been calculated taking Gold Spot international price and converting the same assuming fixed Indian rupee rate. However, this is not accurate method as change in rupee value to dollar can substantially impact Gold INR price. Pl. note that price of commodity doesn't depend upon performence of company but depend upon performence of world economy, hence it is extremely risky to trade in commodities. Commodities market also become more volatile during contract expiry.
These are not a recommendation for buy or sell. This view is only for educational purpose. You are requested to consult your financial advisor before entering in to any trade.

XAU#25: Is the correction over? What's next?Prices OANDA:XAUUSD stabilized around $3,022/ounce after a slight decline two days ago, reflecting strong safe-haven demand due to economic and geopolitical uncertainty. So is this correction over? Let's look at the next plan FOREXCOM:XAUUSD :
1️⃣ **Fundamental analysis:**
📊 Risks of economic recession and war conflict still exist:
🔹The Trump administration's reciprocal tariff policy may be more moderate than expected, reducing concerns about trade conflicts, but Wall Street is still betting on a 50% chance of a US recession due to slow currency circulation. This is one of the factors supporting Gold's rise
🔹 Risks from the Middle East and Ukraine are still unknown. Negotiations are still reaching certain agreements, but the impact on market confidence is insignificant. The fear psychology is still pushing money into Gold as a safe haven asset.
2️⃣ **Technical analysis:**
🔹 **D Frame**: The uptrend remains unchanged. Closing the session last Friday with a bearish candle is considered a profit-taking move after a series of days of gold price increase.
🔹 **H4 Frame**: The 3000 area is playing an effective support role when the price bounces back. However, the correction wave has not shown any signs of ending.
🔹 **H1 Frame**: The bearish price structure is very clear. If the 301x area is still held, the price may seek the resistance zones above to confirm the price reaction.
3️⃣ **Trading plan:*
✅ From the basic information to the reflected horizontal line, it can be seen that at the present time, the price can still continue to decrease. However, there are certain risks when FOMO establishes a SELL position in the current area. The price may not drop deeply to the lower area immediately but will sweep SL at both ends. We can wait for the price reaction in the upper resistance area to find a safer position.
💪 **Wishing you success in achieving profits!**

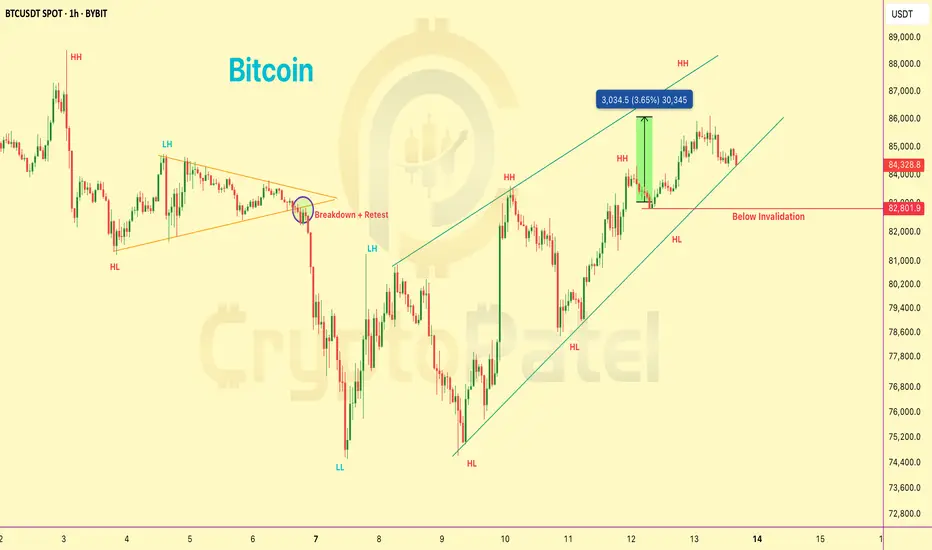
BTC#22: BTC recovers slightly. Is the bear wave over?
In the past few days, BINANCE:BTCUSD has been continuously SW in the 81~85k area. Is this a sign that BTC will rise again? Let's analyze in detail and plan a trade BINANCE:BTCUSDT :
1️⃣ **Fundamental analysis:**
📊 The IMF has included Bitcoin and other digital assets in the framework of the global economic report for the first time. This shows that BTC is being recognized as a real asset.
🚀 The probability that the US government will buy Bitcoin in 2025 is 30% with information that the Trump administration may use profits from Gold to increase Bitcoin reserves
2️⃣ **Technical analysis:**
🔹 **Frame D**: the bear wave has not shown any signs of ending. The price has been anchored in the 80~85k area for a long time, but there has been no significant fluctuation and the sign of recovery is still unclear.
🔹 **H4+H1 frame**: The current short-term price structure is temporarily increasing with the appearance of higher peaks and higher bottoms. However, the price has not surpassed the important key zone to change the main trend.
3️⃣ **Trading plan:*
📌 At the present time, the current price has no clear signs when BTC is still fluctuating continuously in the SW area. Currently, the price is in a recovery phase with the nearest target being the resistance area of 88~91k. The current area is also not good for seeking profit from BUY positions. We can wait for the price reaction to the resistance area to consider establishing a SELL position. Prioritize trading in accordance with the main trend.
💪 **Wish you success in making profits!**

XAU#24: Gold hits $3,000. Will there be a correction?💎 💎 💎 So OANDA:XAUUSD has successfully achieved the $3,000 mark thanks to tariffs and economic growth concerns. Let's continue to plan for gold FOREXCOM:XAUUSD : 💎 💎 💎
1️⃣ **Fundamental analysis:**
📊 The trade war due to tariffs as well as expectations of slowing inflation and concerns about economic growth will push the Federal Reserve to cut interest rates this year are the main drivers of gold's safe-haven demand.
2️⃣ **Technical analysis:**
🔹 **D Frame**: Gold broke through the resistance area of 2955 strongly and reached the 3000 mark the next day. The uptrend is very clear. Although the weekend closed with a pinbar, this is likely to be short-term profit-taking pressure as the market enters the weekend trading day and comes from the 3000 round mark
🔹 **H4+H1 frame**: the price returns to a strong uptrend after accumulating the 2900~292x area. The price reaction at the psychological level of 3000 is weak when the price does not have a clear corrective reaction.
3️⃣ **Trading plan:*
✅ There is still no clear sign of adjustment. Gold prices will continue to increase if trade tensions escalate from tariff retaliation orders. Although touching the psychological resistance of 3000, the price reaction is insignificant, showing that market sentiment is still optimistic about the prospect of gold's increase. The top priority is not to FOMO according to the price line. We can wait for the price to return to the support area to look for trading opportunities.
💪 **Wishing you success in achieving profits!**

BTC#21: Fear Index Rising. Will BTC Continue to Fall? 💎 💎 💎 BINANCE:BTCUSDT BTC's decline has somewhat slowed down in recent days with a recovery from 78k. We will plan for BINANCE:BTCUSD next 💎 💎 💎
1️⃣ **Fundamental Analysis:**
📊 The Fear and Greed Index dropped to 30 today, and the level is still fear
🚀 Cumulative net inflows into US spot Bitcoin ETFs have dropped to their lowest level since January 2
📌 The market is still in a pessimistic phase about BTC's bullish outlook. The outflow of money from the market is not only due to BTC's decline but also due to concerns about an economic recession due to Trump's unstable policies.
2️⃣ **Technical analysis:**
🔹 **D frame**: BTC's downtrend has shown signs of slowing down, but the main trend in frame D is still down. We will still need to wait for the price reaction in the resistance area to confirm.
🔹 **H4 frame**: The price trend is still down. The price reaction in the support area of 78K is not as strong as before, showing that market sentiment is still leaning towards the bears.
🔹 **H1 frame**: we are in a short-term correction. The target for this correction is the resistance area of 88-91K as you can see on the chart
3️⃣ **Trading plan:*
As you can see from the multi-frame perspective, the main trend is still down, but we are in a short-term correction. We can choose to wait for the price to return to the resistance area to trade in line with the main trend or if the price has a slight recovery, set up BUY to seek profit. However, because the main trend is down, we need to stop loss fully and not be greedy when the price hits resistance because the price can return to the main trend at any time.
💪 **Wish you success in achieving profits!**

XAU#23: Gold Continues SW – Waiting for a Boost from CPI News?🔥 Immediately after the decline FOREXCOM:XAUUSD , there was a recovery with a large amplitude. Looking at the price reaction, we will plan the next step OANDA:XAUUSD : 🔥
1️⃣ **Fundamental analysis:**
📊Gold rises on tariff concerns, but is under pressure from the Ukraine-Russia ceasefire agreement
🔹Gold prices rise on a weaker USD and increased demand for safe-haven, as concerns about a US economic recession become more evident.
🚀The US market faces risks from Trump's tax policy, Fed interest rates and slowing growth of large technology companies. Weak CPI & PPI data could prompt the Fed to ease policy, creating conditions for gold prices to continue to be supported.
📌 In recent days, trade wars and geopolitics have continuously coordinated the price of gold. Continuous declarations of tax imposition, response and withdrawal have caused the price to fluctuate strongly.
2️⃣ **Technical analysis:**
🔹 **Frame D**: The bullish price structure has not changed. Yesterday's price increase brought momentum to the prospect of gold's increase. However, to break out of the SW zone, we will need strong enough momentum from both news and price structure.
🔹 **Frame H4**: The downtrend has been confirmed when the price reacted strongly in the resistance zone. The price continues to be in the old SW zone. We will have to wait for confirmation from the price structure in this area to predict the trend and wait for the opportunity to establish a position.
🔹 **Frame H1**: The bearish price structure has been established and yesterday was a recovery to the resistance zone. It is too early to say that the price will break through the SW area.
3️⃣ **Trading plan:*
⛔ At the current price range, the price line is likely to SW waiting for today's CPI news. If we have not established a position, we should not FOMO at this time. Because the information given at this time can change at any time and the price line has not been clearly confirmed.
✅ An ideal scenario when the price has a correction to retest the H4 trendline. The upward momentum will be clearer when the price bounces from support. However, yesterday's price increase has not ended yet, so we should wait for the price structure to appear more clearly to place an order.
💪 **Wishing you successful trading!**

S&P 500 sliding down! Markets under pressure #SP500S&P 500 sliding down! Markets under pressure #SP500
📉 The S&P 500 is trending downward today as market volatility rises. Investors react to economic data, Fed policy expectations, and global uncertainties. Stay alert and manage risk accordingly! #SP500 #StockMarket #Investing #trade #markets #finance #money

XAU#22: Gold SW for 3 Days! What's Next?🔥 OANDA:XAUUSD has been SW for the past 3 days of the weekend. Today we will look at the next scenario for FOREXCOM:XAUUSD to look for trading opportunities: 🔥
1️⃣ **Fundamental analysis:**
📊Trump's erratic tariff policy increases uncertainty, boosting demand for safe havens.
🔹USD falls sharply to a 4-month low, making gold more attractive to international investors.
🚀India steps up investment in gold, with jewelers and retail investors using gold options for speculation and hedging.
📌Gold remains a safe haven asset, especially amid concerns about India's economic growth and global instability.
2️⃣ **Technical analysis:**
🔹 **D frame**: 3 consecutive SW days, however, it can be seen that the upward trend of gold has not changed. The SW price zone is also quite high compared to the most recent bottom, indicating an upward prospect for gold
🔹 **H4 frame**: The temporary bullish price structure was broken and there was a strong reaction at the most recent peak area with a previous pinbar.
🔹 **H1 frame**: In the H1 frame, we can see the hesitation more clearly. Although the previous price continuously set higher bottoms, the upward momentum is weakening. If the price breaks through 2905. There is a high possibility that we will see a correction to the lower support zone
3️⃣ **Trading plan:*
⛔The current area is no longer safe to establish a BUY position. We will wait for a clearer opportunity in the lower support zone
✅ The current priority is to look for a SELL position. The expected scenario is that if the price breaks through 2905, we can completely establish a position.
💪 **Wishing you successful trading!**
