CANBK 1 Month Time Frame 📌 Current Price Context
Canara Bank is trading around ₹149–₹150 on NSE.
52‑week high ~₹154.21 and low ~₹78.60.
📊 1‑Month Timeframe – Key Levels
🔹 Immediate Resistance Levels
These are the levels where price may struggle to move higher:
Level Description
₹150–₹151 Immediate resistance zone seen from pivot bands & recent highs.
₹152–₹153 Stronger resistance, break above suggests continued upside.
₹155+ 52‑week high area — key breakout zone.
🔸 Support Levels
These are important on pullbacks:
Level Description
₹147–₹148 Immediate support zone (short‑term pivot).
₹145–₹146 Next strong support on 1‑month moves.
₹143–₹144 Broader support zone if deeper retracement happens.
📈 1‑Month Technical Outlook (Summary)
🔄 Trend Indicators (Monthly View)
Monthly pivot point ~ ₹146.88 — this is a key center price for the past month’s activity.
Price currently above pivot, favoring mildly bullish/neutral short‑term tone.
📉 Momentum Summary
Multiple technical sites show mixed signals for short vs. long momentum, but daily/weekly signals often lean buy/strong buy.
📍 Practical Levels for 1‑Month Trading
Bullish Scenario
If price breaks and holds above ₹152–₹153, next upside target ~ ₹155–₹157+.
Neutral Zone
Between ₹147–₹152 — range trading possible.
Bearish Scenario
A break below ₹145 may open pathway to lower supports around ₹143–₹140.
Trade

Nifty & Bank Nifty Highs Understanding the Momentum, Drivers, and Market Implications
The Indian equity markets have repeatedly demonstrated resilience and growth over the years, with Nifty 50 and Bank Nifty often serving as the primary barometers of market sentiment. When these indices approach or create new highs, it is not just a technical milestone—it reflects deeper economic confidence, sectoral strength, liquidity flows, and investor psychology. Understanding why Nifty and Bank Nifty make highs, what sustains them, and how traders and investors should interpret such phases is crucial for navigating Indian markets effectively.
1. What Does “Highs” Mean in Market Context?
When analysts refer to Nifty or Bank Nifty making highs, they usually mean:
All-Time Highs (ATH): The highest level the index has ever reached.
52-Week Highs: The highest level in the past year.
Swing or Intermediate Highs: Important resistance zones on shorter or medium-term charts.
Each type of high carries different implications. ATHs often signal structural strength, while swing highs may be more tactical and prone to consolidation or pullbacks.
2. Nifty Highs: Broad Market Strength
The Nifty 50 represents India’s largest and most liquid companies across sectors such as IT, FMCG, energy, metals, pharma, and financials. When Nifty makes new highs, it usually indicates:
Broad-based participation: Multiple sectors contribute rather than just one or two heavyweights.
Stable macro environment: Controlled inflation, manageable interest rates, and stable currency conditions.
Strong earnings outlook: Corporate profits are growing or expected to grow sustainably.
Global confidence: Supportive global cues, such as stable US markets or easing global risks.
Nifty highs are often driven by long-term investors, including domestic institutions (DIIs), mutual funds, and retail investors through SIP inflows, making these rallies structurally stronger.
3. Bank Nifty Highs: Financial Sector Leadership
Bank Nifty is more volatile and directional than Nifty because it is concentrated in banking and financial stocks. When Bank Nifty makes highs, it usually sends a powerful signal about the economy.
Key reasons behind Bank Nifty highs include:
Credit growth acceleration: Rising loan demand from retail, MSMEs, and corporates.
Improving asset quality: Lower NPAs and better recovery cycles.
Stable or favorable interest rate outlook: Banks benefit from healthy net interest margins.
Strong PSU and private bank performance: Leadership from large banks like HDFC Bank, ICICI Bank, SBI, and Axis Bank.
Because banks form the backbone of economic activity, Bank Nifty highs often confirm the sustainability of a broader market rally.
4. Liquidity and Institutional Flows
One of the most critical drivers of highs in both indices is liquidity.
Domestic liquidity: Regular SIP inflows provide consistent buying support, especially during dips.
Foreign institutional investors (FIIs): When FIIs turn net buyers, index-heavy stocks rally sharply.
Low alternative yields: When bond yields or fixed-income returns are less attractive, equities become the preferred asset class.
Sustained highs are rarely formed without strong institutional participation.
5. Role of Derivatives and Market Positioning
In Indian markets, derivatives play a significant role in short-term highs:
Call writing at higher strikes indicates expectations of consolidation.
Put writing near support levels shows confidence in the uptrend.
Open Interest (OI) buildup along with price rise suggests strong bullish conviction.
Bank Nifty, in particular, often makes sharp highs due to short covering rallies, where traders forced to exit losing short positions push prices rapidly upward.
6. Psychology Behind New Highs
Markets making highs trigger mixed emotions:
Fear of missing out (FOMO): Late entrants rush in.
Profit booking by early buyers: Leading to volatility near resistance zones.
Media optimism: Reinforces bullish sentiment.
Contrary to common belief, markets often make highs in strong trends, not at the end of them. However, the pace and quality of participation determine whether highs will sustain or lead to consolidation.
7. Highs Do Not Mean Overvaluation Automatically
A frequent misconception is that new highs equal overvaluation. In reality:
Markets can remain overbought longer than expected.
Rising earnings can justify higher index levels.
Structural reforms, demographic advantages, and economic growth support higher valuations over time.
Nifty and Bank Nifty have historically spent significant time near highs during long-term bull phases.
8. Trading vs Investing Perspective at Highs
For Traders:
Focus on momentum stocks and sectors leading the index.
Avoid aggressive shorts against strong trends.
Use trailing stop losses to protect profits.
Watch divergence between price and indicators.
For Investors:
Stick to asset allocation discipline.
Accumulate quality stocks on corrections, not euphoric spikes.
Continue SIPs rather than timing the market.
Highs are more dangerous for emotional decisions than for disciplined strategies.
9. Risks Around Index Highs
While highs indicate strength, risks must be monitored:
Sudden global shocks (geopolitical tensions, US rate surprises).
Sharp rise in crude oil prices.
Unexpected inflation or policy changes.
Over-leveraged speculative positions.
Healthy markets often correct through time rather than price, forming ranges before the next leg up.
10. What Sustains Future Highs?
For Nifty and Bank Nifty to continue making higher highs:
Corporate earnings must grow consistently.
Banking sector asset quality must remain stable.
Domestic consumption and capex cycles must stay strong.
Policy continuity and macro stability must be maintained.
As long as these pillars remain intact, index highs should be viewed as milestones of growth rather than warning signs.
Conclusion
Nifty and Bank Nifty highs are not just numbers on a chart—they reflect the collective confidence of investors in India’s economic and corporate future. While volatility and corrections are natural near elevated levels, sustained highs usually indicate strength, not weakness. For market participants, the key lies in understanding the context behind the highs, aligning strategies with trend strength, and maintaining discipline rather than reacting emotionally.
In essence, highs reward preparation, patience, and perspective—qualities that separate successful market participants from the rest.

Technical Analysis vs Fundamental Analysis1. Conceptual Foundation
Technical Analysis is based on the belief that all known information—economic data, company performance, market sentiment, and global events—is already reflected in the price. Therefore, instead of focusing on why prices move, technical analysts focus on how prices move. They study historical price data, volume, and chart patterns to identify trends and predict future price movements.
Fundamental Analysis, on the other hand, seeks to determine the intrinsic value of an asset. It focuses on economic indicators, financial statements, management quality, industry conditions, and macroeconomic factors. Fundamental analysts aim to understand whether an asset is undervalued or overvalued relative to its true worth.
2. Core Philosophy
Technical Analysis Philosophy
Price discounts everything
Price movements follow trends
History tends to repeat itself
Fundamental Analysis Philosophy
Markets may misprice assets in the short term
True value is driven by economic and financial realities
Prices eventually converge to intrinsic value
This philosophical difference shapes how each method is applied in real-world trading and investing.
3. Tools and Methods
Technical Analysis Tools
Price charts (line, bar, candlestick)
Trendlines and channels
Support and resistance levels
Indicators (RSI, MACD, Moving Averages, Bollinger Bands)
Chart patterns (Head & Shoulders, Double Top/Bottom, Flags, Triangles)
Volume analysis
Momentum and volatility indicators
Technical tools are largely visual and mathematical, designed to capture market psychology and timing.
Fundamental Analysis Tools
Financial statements (income statement, balance sheet, cash flow)
Valuation metrics (P/E, P/B, PEG, EV/EBITDA)
Earnings growth and revenue trends
Industry and sector analysis
Macroeconomic indicators (GDP, inflation, interest rates)
Corporate governance and management assessment
Geopolitical and policy analysis
Fundamental tools are data-driven and focus on long-term economic sustainability.
4. Time Horizon
One of the most important distinctions lies in timeframe:
Technical Analysis
Short-term to medium-term
Used by intraday traders, swing traders, and short-term option traders
Emphasizes entry and exit timing
Fundamental Analysis
Medium-term to long-term
Used by long-term investors, portfolio managers, and value investors
Focuses on wealth creation over years rather than days or weeks
While technical analysis answers “when to trade”, fundamental analysis answers “what to buy or sell.”
5. Market Participants
Technical Analysis Users
Day traders
Swing traders
Derivatives and options traders
Algorithmic and quantitative traders
Fundamental Analysis Users
Long-term investors
Mutual funds and institutional investors
Value and growth investors
Wealth managers
Institutional investors often use fundamentals to select assets and technicals to fine-tune entry and exit points.
6. Data Dependency
Technical Analysis relies heavily on:
Historical price data
Volume and open interest
Market behavior patterns
It does not require deep knowledge of a company’s business model or financials.
Fundamental Analysis depends on:
Accurate financial reporting
Economic data reliability
Corporate disclosures and forecasts
It requires interpretation, assumptions, and long-term projections, which can be subjective.
7. Strengths and Advantages
Advantages of Technical Analysis
Effective for timing trades
Useful in volatile and sideways markets
Applicable across asset classes
Works even when fundamentals are unclear
Suitable for short-term trading and risk management
Advantages of Fundamental Analysis
Identifies long-term value opportunities
Helps understand economic and business risks
Builds conviction during market volatility
Supports portfolio allocation decisions
Ideal for wealth creation and capital preservation
8. Limitations and Risks
Limitations of Technical Analysis
Can produce false signals
Less effective during sudden news-driven events
Subject to interpretation bias
Does not explain underlying business value
Limitations of Fundamental Analysis
Slow reaction to market changes
Valuations may remain mispriced for long periods
Requires accurate and timely data
Less effective for short-term trading
Markets can remain irrational longer than expected, challenging purely fundamental views.
9. Application in Different Market Conditions
Trending Markets
Technical analysis performs well
Range-bound Markets
Technical indicators and oscillators excel
Economic Expansion
Fundamental analysis helps identify growth leaders
Economic Crisis or Policy Shocks
Technical analysis helps manage risk and volatility
Fundamentals explain long-term recovery potential
10. Technical vs Fundamental in Options and Derivatives
In derivatives trading:
Technical analysis is crucial for strike selection, timing, and volatility assessment
Fundamental analysis helps identify direction and long-term bias
Option traders often combine both—using fundamentals to decide bullish or bearish outlook and technicals to execute strategies.
11. The Combined Approach
Modern market participants increasingly adopt a hybrid approach, combining both analyses:
Fundamentals for asset selection
Technicals for trade execution and risk management
This approach reduces blind spots and enhances decision quality.
12. Conclusion
Technical analysis and fundamental analysis are not rivals but complementary tools. Technical analysis excels at understanding market behavior, timing, and psychology, while fundamental analysis provides insight into value, growth, and economic reality. Traders and investors who understand both can adapt to changing market conditions, manage risk more effectively, and improve consistency.
Ultimately, the choice depends on individual goals, time horizon, risk tolerance, and market participation style. Mastery comes not from choosing one over the other, but from knowing when and how to use each effectively.

Divergence Secrets Intrinsic Value and Time Value
An option premium has two parts:
Intrinsic Value
The actual profit you would make if option were exercised now.
Time Value
Extra value based on:
Time left to expiration
Volatility
Market expectations
As expiry gets closer, time value decays—this is why options depreciate faster near expiry.

Part 1 Support and Resistance What Are Options?
Options are derivative contracts—their value is derived from an underlying asset such as a stock, index, commodity, or currency.
Each option gives the buyer a right, but not an obligation, to buy or sell the underlying asset at a specific price (called the strike price) on or before a specific date (called the expiry date).
There are two types of options:
Call Options – Gives the right to buy the asset.
Put Options – Gives the right to sell the asset.
You pay a fee to purchase this right. That fee is called the premium.

RAJESHEXPO 1 Day Time Frame 📌 Current Price (Approx Intraday)
Price range today: ~ ₹187.72 – ₹211.85
Recent last close/quoted prices vary around ₹190–₹206 depending on data source — markets fluctuate intraday.
📍 Key Daily Pivot & Levels (1‑Day View)
🔹 Central Pivot
Daily Pivot: ~ ₹224.34 (near central)
🔸 Resistance Levels
(These act as potential targets on the upside)
R1: ~ ₹257.74
R2: ~ ₹277.61
R3: beyond ₹277+ (higher trend resistances)
(Standard pivot levels from pivot calculators)
🔹 Support Levels
(Key downside support zones possible today)
S1: ~ ₹210.81 – ₹224.34 (CPR midpoint)
S2: ~ ₹190.94 – ₹210.81
S3: ~ ₹177.41
(Standard pivot supports from daily pivot analysis)
⚡ Note: Because the market price today is trading significantly below the central pivot (~₹224+) and within ₹187–₹211, the immediate trading levels of interest for intraday are mostly between:
📌 Support: ~ ₹190 → ₹177
📌 Resistance: ~ ₹211 → ₹257+

GBP/USD Signals Trend Shift – Impulsive Upside ExpectedThe chart shows that GBP/USD has completed a full W–X–Y corrective pattern, with the final wave (y) and its C wave forming a clean bottom near the long-term support line. From that low, price has started a strong upward move, which looks like the beginning of a new impulsive Wave 1. The current pullback toward the 0.382–0.618 Fibonacci zone is typical behavior for a Wave 2 retracement before the next strong rally. As long as the price stays above the invalidation level at 1.30094 (the wave (y) bottom), the bullish scenario remains valid. This suggests that GBP/USD is preparing for a larger Wave 3 push to the upside.
Stay tuned!
@Money_Dictators
Thank you :)

Part 10 Trade Like Institutions The Premium and How It Works
To acquire an option, the buyer pays a premium to the seller (writer).
Premium is determined by:
underlying price
strike price
time to expiration
volatility
interest rates
For buyers:
Maximum loss = premium paid
Potential profit = high, theoretically unlimited for calls
For sellers (writers):
Maximum profit = premium received
Potential loss = very large or unlimited
This imbalance is why selling options requires margin and expertise.

Candle Pattern What Are Candlestick Patterns?
Candlestick patterns originate from Japanese rice traders and represent the open, high, low, and close of price. They are especially useful for identifying short-term reversals, continuations, and market indecision.
Common Mistakes Traders Make
Trading patterns without confirmation
Ignoring higher timeframes
Overtrading every pattern
Forgetting risk management
Ignoring market context and trend
Patterns work best when aligned with:
Trend direction
Support & resistance
Volume
Broader market sentiment

Chart Patterns What Are Chart Patterns?
Chart patterns are recognizable formations created by price movements on a chart. They develop over time and help traders identify trends, reversals, or continuation of trends. Chart patterns are usually formed by support and resistance levels, trendlines, and consolidation phases.
Types of Chart Patterns
Chart patterns are broadly classified into:
Reversal Patterns
Continuation Patterns
Bilateral (Neutral) Patterns

Small Account ChallengesNavigating the Market with Limited Capital
Trading or investing with a small account is one of the most demanding yet most common starting points for market participants. Whether in stocks, forex, commodities, or crypto, a small account magnifies every decision, emotion, and mistake. While the markets offer equal access to everyone, the reality is that account size significantly influences strategy, psychology, risk management, and growth potential. Understanding the challenges of a small account is essential to surviving early stages and building a sustainable path toward long-term success.
Limited Margin for Error
The biggest challenge of a small account is the lack of room for mistakes. A few bad trades can cause disproportionate damage. For example, a 10% loss on a ₹10,000 account feels manageable, but psychologically it can be devastating because recovery requires a higher percentage gain. Unlike large accounts, where losses can be absorbed and diversified across multiple positions, small accounts are fragile. This forces traders to be extremely precise with entries, exits, and position sizing—skills that usually take time and experience to develop.
Position Sizing Constraints
Small accounts face strict position sizing limitations. Many quality trades require a certain stop-loss distance to respect market structure. However, with limited capital, traders often feel compelled to reduce stop-loss size unrealistically or increase position size beyond safe limits just to make the trade “worth it.” This leads to overleveraging, premature stop-outs, or catastrophic losses. The challenge is balancing proper risk management with the desire to generate meaningful returns from a small base.
Overtrading and the Urge to Grow Fast
A common psychological trap for small account traders is overtrading. Because profits appear small in absolute terms, traders feel pressure to trade frequently, chase volatility, or jump into low-quality setups. This behavior is driven by impatience rather than strategy. Overtrading increases transaction costs, emotional fatigue, and exposure to random market noise. Instead of compounding steadily, the account often fluctuates wildly, making consistent growth nearly impossible.
Emotional Pressure and Psychological Stress
Small accounts carry intense emotional weight. Every trade feels important, sometimes even “make or break.” This pressure can cause fear of pulling the trigger, hesitation at key moments, or panic exits. On the other hand, a few winning trades may create overconfidence, leading to reckless risk-taking. Emotional swings are sharper because the account represents hard-earned capital and often personal savings. Managing psychology becomes as important—if not more important—than technical or fundamental analysis.
High Impact of Costs and Fees
For small accounts, brokerage fees, spreads, commissions, and taxes have a much larger relative impact. A trade that looks profitable on paper may yield minimal net gains after costs. Frequent trading further amplifies this issue. In markets like forex or crypto, spreads alone can eat into profits significantly. This makes strategy selection critical; traders must focus on setups with favorable risk-reward ratios rather than small, frequent scalps that may not survive costs.
Limited Diversification Opportunities
Diversification is a cornerstone of risk management, but small accounts struggle with it. Capital constraints often force traders to concentrate on one or two instruments or strategies. While focus can be beneficial, it also increases exposure to specific market conditions. If that instrument enters a choppy or unfavorable phase, the account suffers. Large accounts can rotate across sectors, assets, or time frames, but small accounts must rely heavily on timing and discipline.
Leverage: A Double-Edged Sword
Leverage is often seen as a solution for small accounts, but it is also one of their greatest threats. While leverage allows traders to control larger positions, it magnifies losses faster than gains. Many small accounts are wiped out not because the strategy was wrong, but because leverage was misused. The challenge lies in using leverage responsibly—as a tool, not a crutch—while respecting strict risk limits.
Information Overload and Strategy Confusion
Small account traders are frequently overwhelmed by too much information. Social media, trading courses, tips, and signals promise quick growth and “sure-shot” strategies. This creates confusion, constant strategy switching, and lack of consistency. A small account does not have the luxury to experiment endlessly. Every strategy change resets the learning curve, leading to losses that could have been avoided with patience and focus.
Slow Compounding and Unrealistic Expectations
One of the hardest realities to accept is that small accounts grow slowly when managed properly. Safe risk percentages (1–2% per trade) produce modest gains in the beginning. This clashes with unrealistic expectations of doubling accounts quickly. The challenge is mental: respecting the process, trusting compounding, and understanding that survival and consistency matter more than short-term growth.
Turning Challenges into Strengths
Despite these difficulties, small accounts also offer valuable advantages. They force traders to develop discipline, precision, and emotional control early. Losses, while painful, are usually smaller in absolute terms and serve as affordable lessons. Traders who successfully grow small accounts often build stronger habits than those who start large. The key is shifting the mindset from “making money fast” to building skill, consistency, and capital protection.
Conclusion
Small account challenges are real, intense, and unavoidable for most traders. Limited capital magnifies risk, emotions, and mistakes, while restricting flexibility and diversification. However, these same constraints can shape disciplined, resilient, and skilled market participants. Success with a small account is not about aggressive growth or constant action—it is about patience, risk control, psychological mastery, and long-term thinking. Those who respect these principles may not grow fast, but they grow strong, laying a foundation for sustainable success in the markets.

Option Trading Psychological Factors for Profit
a) Patience
Wait for setup confirmation.
b) Discipline
Follow risk rules.
c) Emotion Control
Avoid greed.
Book profits early.
d) Backtesting
Practice improves profitability.

Part 2 Candle Patterns Profit Potential in Buying Options
a) Unlimited Upside in Call Buying
Max profit can be extremely high if stock surges.
b) High Return on Small Investment
Low premium gives high leverage.
Example: ₹5,000 investment generating ₹25,000 profit.
c) Best for Momentum Trades
Short-term sharp moves create strong premium expansion.
d) Limited Risk
Maximum loss = premium paid.
This helps manage losses clearly.
e) News-Based Profit Opportunity
Earnings announcements
Budget events
Interest rate decisions

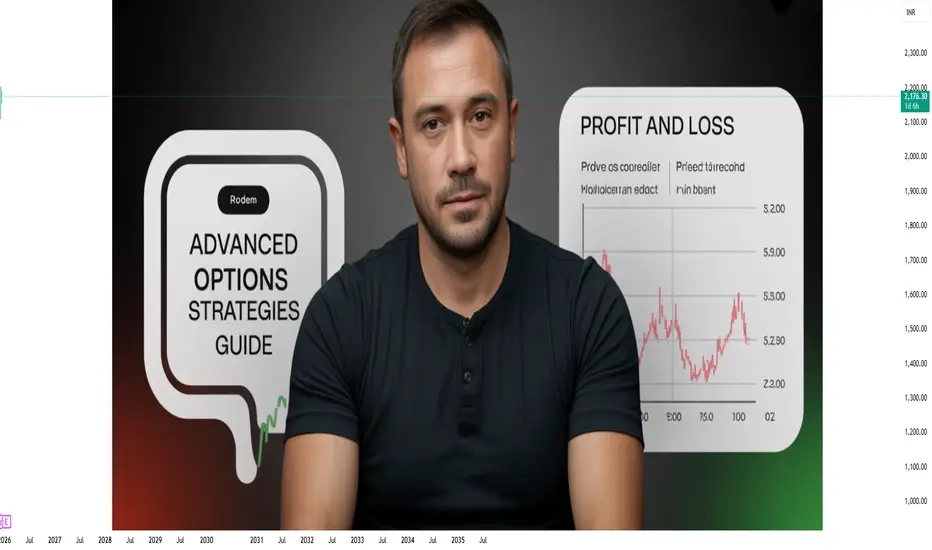
Mastering Complex Techniques for Consistent Market ProfitsAdvanced Option Strategies
Options trading goes far beyond simple call buying or put selling. While basic strategies help beginners understand direction-based trades, advanced option strategies are designed for experienced traders who want to profit from volatility, time decay, range-bound markets, and risk asymmetry. These strategies focus not just on predicting price direction, but on managing probability, risk, and reward with precision.
This guide explores advanced option strategies in a structured way, helping you understand when to use them, how they work, and why professionals rely on them.
1. The Philosophy Behind Advanced Option Strategies
Advanced option strategies are built on three core option variables, often called the Option Greeks:
Delta – sensitivity to price movement
Theta – impact of time decay
Vega – sensitivity to volatility
Professional traders don’t trade opinions; they trade probabilities. Advanced strategies aim to:
Control downside risk
Benefit from time decay
Capture volatility changes
Maintain flexibility under different market conditions
These strategies are especially effective in sideways, low-volatility, or event-driven markets, where simple directional trades fail.
2. Multi-Leg Option Structures
Advanced strategies typically involve multiple option legs (combination of calls and puts). These structures allow traders to:
Reduce capital required
Hedge risk efficiently
Improve probability of success
Generate steady income
Unlike naked options, multi-leg strategies define risk upfront, making them suitable for disciplined traders.
3. Iron Condor Strategy
The Iron Condor is one of the most popular advanced strategies for range-bound markets.
Structure:
Sell one out-of-the-money call
Buy one higher strike call
Sell one out-of-the-money put
Buy one lower strike put
Market View: Neutral
Profit Source: Time decay (Theta)
Risk: Limited on both sides
This strategy works best when:
Volatility is high and expected to fall
The underlying asset stays within a defined range
No major news or events are expected
Iron Condors are widely used by institutional traders to generate consistent income.
4. Butterfly Spread Strategy
A Butterfly Spread is designed for situations where the trader expects very low volatility and price consolidation.
Structure (Call Butterfly):
Buy one lower strike call
Sell two at-the-money calls
Buy one higher strike call
Market View: Neutral
Profit Zone: Near the middle strike
Risk: Very low, predefined
Butterflies offer:
High reward-to-risk ratio
Low capital requirement
Precision-based trading
However, timing is critical—this strategy performs best close to expiry.
5. Calendar Spread (Time Spread)
Calendar spreads exploit differences in time decay between near-term and far-term options.
Structure:
Sell a near-expiry option
Buy a far-expiry option at the same strike
Market View: Mild directional or neutral
Profit Source: Faster decay of short-term option
Best Environment: Low volatility, stable price
This strategy is commonly used before:
Earnings announcements
Economic events
Policy decisions
Traders benefit when the underlying price stays close to the strike while time passes.
6. Ratio Spread Strategy
A Ratio Spread involves unequal numbers of bought and sold options.
Example:
Buy one call
Sell two higher strike calls
Market View: Moderately bullish or bearish
Risk: Can be unlimited if unhedged
Ratio spreads are used when traders expect:
Controlled price movement
Volatility contraction
Strong resistance or support levels
This strategy demands active monitoring and deep understanding of risk.
7. Backspread Strategy
The Backspread is a volatility-focused strategy, often used ahead of major market moves.
Structure (Call Backspread):
Sell one at-the-money call
Buy two out-of-the-money calls
Market View: Strong directional move expected
Profit Source: Volatility expansion
Risk: Limited
Backspreads are ideal when:
Volatility is low but expected to rise sharply
Big news or events are approaching
Traders want asymmetric payoff
This strategy can deliver explosive profits if the market moves aggressively.
8. Diagonal Spread Strategy
Diagonal spreads combine different strikes and different expiries, offering more flexibility than calendar spreads.
Benefits:
Directional bias with time decay advantage
Adjustable risk profile
Better control over delta and theta
Traders use diagonal spreads for slow trending markets, where price moves steadily over time.
9. Advanced Volatility-Based Strategies
Professional traders focus heavily on volatility rather than direction.
Key volatility strategies include:
Long straddle/strangle (volatility expansion)
Short straddle/strangle (volatility contraction with strict risk control)
Vega-neutral portfolios
Understanding Implied Volatility (IV) is crucial:
Buy options when IV is low
Sell options when IV is high
This single principle separates amateurs from professionals.
10. Risk Management in Advanced Option Trading
No advanced strategy works without disciplined risk management.
Key rules:
Always define maximum loss before entry
Avoid over-leveraging
Adjust positions proactively
Exit when probabilities shift
Advanced traders treat option strategies like business setups, not gambling tools.
11. Common Mistakes Traders Make
Ignoring volatility environment
Holding short options into major events
Overtrading complex structures
Focusing only on profit, not probability
Simplicity with discipline often outperforms unnecessary complexity.
12. Final Thoughts: Becoming a Professional Option Trader
Advanced option strategies are not about predicting markets perfectly. They are about positioning intelligently based on probability, volatility, and time.
By mastering these strategies, traders can:
Generate income in sideways markets
Protect capital during uncertainty
Achieve consistent long-term performance
The real edge lies not in the strategy itself, but in execution, patience, and risk control. When used correctly, advanced option strategies transform options trading from speculation into a structured, professional trading approach.
Part 11 Trading Master ClassRole of Time and Volatility
Two critical forces dominate option trading:
Time Decay (Theta):
As expiry approaches, the time value of an option erodes. Option sellers often benefit from this decay, especially in sideways markets.
Implied Volatility (IV):
IV reflects market expectations of future price movement. High IV means expensive options; low IV means cheaper options. Buying options in low IV and selling in high IV is a common professional approach.

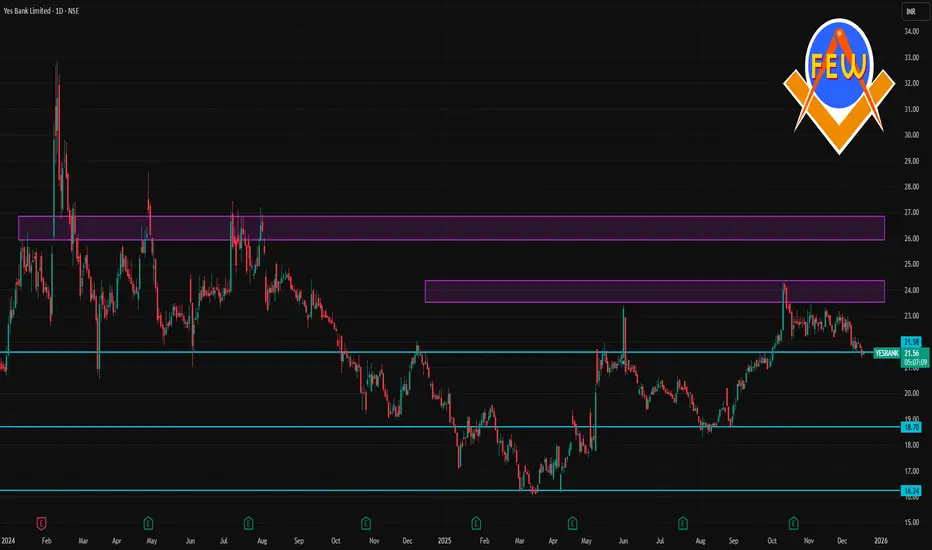
YESBANK 1 Day Time Frame 📊 Daily Time Frame Levels (1 D)
Current approximate price: ~₹21.7–₹22.7 (varies by source)
🔹 Pivot & Daily Reference Level
Daily pivot (Classic): ~ ₹22.58–₹22.60
🧱 Resistance Levels
Immediate resistance: ~ ₹24.00–₹24.03 (1st major upside barrier)
Above that, psychologically significant levels are near recent 52-week highs around ₹24.30
📉 Support Levels
Short-term support: ~ ₹22.22
Medium/stronger support: ~ ₹20.97
Lower support zones (broader view): ~ ₹19.17–₹18.50 (from broader multi-period analysis)
📈 Technical Indicator Snapshot (Daily)
RSI appears mid-range (neutral/slightly weak) on some chart summaries (~40–46), indicating no strong overbought/oversold condition on the daily chart.
Some aggregators still show a general sell bias based on moving averages and oscillator signals (especially if price < longer-term MAs).
🧠 How Traders Often Use These Levels
Bullish scenario: A sustained break above ₹24.00–₹24.30 with volume could target higher levels.
Bearish scenario: Failure below ₹20.97/₹20 may open the way toward ₹19–₹18 region.
Pivot plays: Near daily pivot (~₹22.58), intraday traders often watch for bounces or breaks for direction.
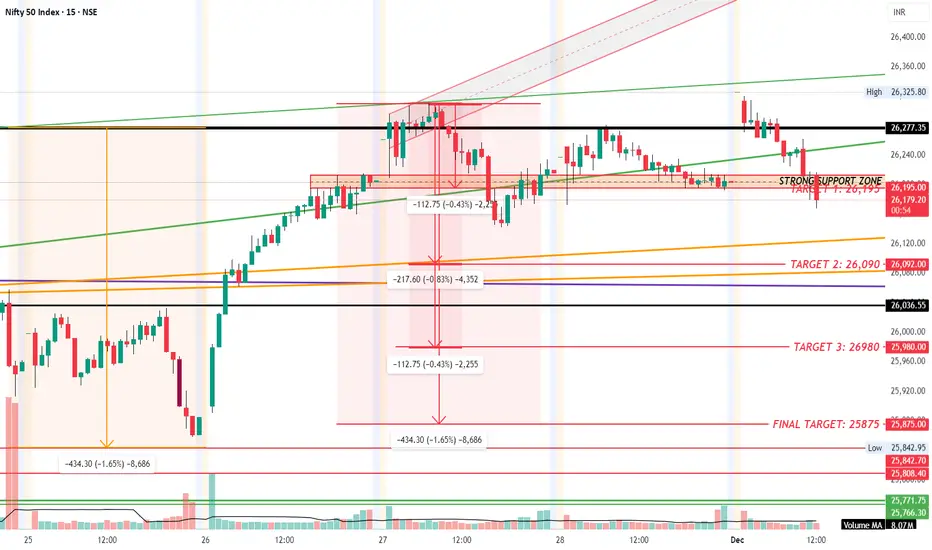
NIFTYNIFTY MADE HIGH WITH DOUBLE TOP along with DIVERGENCE, with stong support at 26200 level, if it breakdown this level we can expect NIFTY to fall below 26000 with final taget of 25,900
Part 2 Ride The Big Moves Iron Condor Strategy
Concept: Combination of bull put spread + bear call spread.
Profit: Limited
Risk: Limited
Best Market Condition: Range-bound market
Use Case:
Preferred by professional traders due to defined risk.

Part 1 Intraday Trading Master Class Covered Call Strategy (Moderately Bullish)
Concept: Hold shares and sell a call option.
Profit: Limited
Risk: Stock downside risk remains
Best Market Condition: Mild uptrend or sideways
Use Case:
Ideal for long-term investors to earn regular income.

Divergence Secrets Long Put Strategy (Bearish)
Concept: Buy a put option expecting the price to fall.
Maximum Loss: Premium paid
Maximum Profit: Large (limited by zero price)
Best Market Condition: Strong downtrend
Use Case:
Used during market crashes, breakdowns, or negative news events.

Option Trading Strategies for Smart Market Participation1. What Are Option Trading Strategies?
Option trading strategies are planned combinations of call and put options.
They are designed to control risk, reduce cost, and improve probability.
Each strategy matches a specific market condition—bullish, bearish, neutral, or volatile.
The goal is not prediction, but risk-adjusted profitability.
2. Core Building Blocks of Options
Call Option: Profits when price moves upward.
Put Option: Profits when price moves downward.
Strike Price: Pre-decided buy/sell price.
Expiry Date: Time limit for the option.
Premium: Cost paid or received for the option.
3. Bullish Option Strategies (Rising Market)
Long Call
Buy a call option when expecting strong upside.
Risk is limited to premium; profit potential is unlimited.
Bull Call Spread
Buy lower strike call, sell higher strike call.
Lower cost and controlled risk with limited profit.
Cash-Secured Put
Sell put to earn premium while planning to buy stock at lower price.
4. Bearish Option Strategies (Falling Market)
Long Put
Buy put when expecting sharp downside.
Limited risk with high profit potential.
Bear Put Spread
Buy higher strike put, sell lower strike put.
Ideal for moderate downtrend with reduced cost.
Call Credit Spread
Sell call spread to benefit from falling or stagnant prices.
5. Sideways Market Strategies (Range-Bound Market)
Covered Call
Hold stock and sell call for regular income.
Iron Condor
Sell out-of-the-money call and put spreads.
Profits from low volatility and time decay.
Short Strangle (Advanced)
Sell OTM call and put when market is stable.
6. Volatility-Based Strategies (Big Move Expected)
Long Straddle
Buy call and put at same strike.
Profits from strong movement in any direction.
Long Strangle
Buy OTM call and put; cheaper than straddle.
Calendar Spread
Profit from changes in volatility and time decay.
7. Option Selling Strategies (Time Decay Advantage)
Sellers benefit from Theta (time decay).
Credit Spreads offer limited risk with consistent income.
High probability strategies when market remains stable.
Requires strong risk management and margin control.
8. Role of Option Greeks in Strategies
Delta: Measures price sensitivity.
Theta: Measures time decay (favors sellers).
Vega: Measures volatility impact.
Gamma: Measures speed of Delta change.
Greeks help select, manage, and adjust strategies.
9. Risk Management in Option Trading
Always use defined-risk strategies.
Risk only 1–2% of capital per trade.
Avoid naked selling without protection.
Set predefined exit rules.
Adjust positions instead of panicking.
10. Capital Allocation & Position Sizing
Diversify across multiple strategies and expiries.
Avoid all-in trades.
Keep cash reserve for adjustments.
Focus on consistency, not jackpots.
11. Psychological Discipline in Options
Small frequent losses are normal.
Avoid revenge trading.
Follow strategy logic, not emotions.
Patience and discipline beat prediction skills.
12. Adapting Strategies to Market Conditions
High volatility → Prefer option selling after spike.
Low volatility → Buy options or calendar spreads.
Trending market → Directional spreads.
Sideways market → Income strategies.
13. Beginner vs Professional Approach
Beginners should start with spreads and hedged strategies.
Professionals focus on probability, risk-reward, and consistency.
Strategy selection matters more than market prediction.
14. Key Advantages of Option Trading Strategies
Limited and defined risk.
Profit in any market condition.
Lower capital requirement.
Multiple ways to adjust losing trades.
Income generation opportunity.
15. Final Conclusion
Option trading strategies are not about complexity—they are about structure, discipline, and probability. When used correctly, they allow traders to control risk, adapt to market behavior, and build consistent returns over time. Success in options comes from understanding strategy logic, respecting risk, and maintaining emotional discipline. Master these elements, and option trading becomes a powerful weapon in your trading journey.

ethereum longs activated im in long manage your riskim in eth longs from this level of entry and long targets risk your capital that ytou can lose and make profits as your levels its just a trade idea thats it

Part 12 Trading Master Class Call Option Explained
A Call Option gives the buyer the right to buy the underlying asset at a fixed price (strike price) before or on expiry.
Example:
If NIFTY is trading at 22,000 and you buy a 22,200 Call Option, you expect the market to move up.
If NIFTY goes to 22,400 → You profit
If NIFTY stays below 22,200 → Option may expire worthless
Maximum loss = Premium paid
Profit potential = Unlimited
Call options are generally used when traders are bullish on the market.
