Part 1 Ride The Big Moves Obligations of Option Sellers
Option sellers carry more responsibility:
a) Seller Must Follow Buyer’s Decision
If the buyer decides to exercise, the seller must honor the contract.
b) Unlimited Risk for Naked Sellers
Losses can be unlimited if markets move strongly against the seller.
c) Mandatory Margin Requirement
Sellers need to maintain margin balance to cover potential losses.
d) Mark-to-Market Loss Adjustments
Brokers deduct daily losses from the seller’s trading account.
e) Physical Delivery for Stock Options
For stock options close to expiry, sellers may have to deliver shares physically if the contract expires in-the-money.
Trade

Understanding Position Sizing in Trading in the Indian Market1. Importance of Position Sizing
Position sizing is often overlooked by novice traders who focus solely on entry and exit strategies. However, the size of the position directly impacts the risk of the trade. Key reasons why position sizing is important include:
Risk Management: A well-calculated position limits losses in case a trade goes against the trader’s expectations. For instance, allocating too much capital to a single trade can lead to significant drawdowns.
Capital Preservation: Protecting trading capital is essential for survival in the market. Indian markets, like the NSE and BSE, can experience volatility due to economic announcements, geopolitical events, or corporate earnings, making capital preservation critical.
Psychological Comfort: Traders are more confident when risk is controlled. Proper position sizing reduces stress and emotional decision-making, which often leads to impulsive trades.
Consistent Profitability: Correct position sizing ensures that even if some trades fail, profits from winning trades can compensate, leading to overall consistent performance.
2. Factors Affecting Position Sizing in India
Several factors influence how traders should determine their position size in Indian markets:
Total Trading Capital: The overall portfolio size is the starting point. A trader with ₹10 lakh should consider different risk parameters than someone trading with ₹1 lakh.
Risk Per Trade: Most professional traders risk 1-3% of their capital per trade. For example, with ₹10 lakh capital, risking 2% per trade means the maximum loss per trade should not exceed ₹20,000.
Volatility of the Asset: Indian stocks, especially mid-cap and small-cap stocks, can be highly volatile. Highly volatile stocks require smaller position sizes to limit risk.
Stop-Loss Level: The distance between entry price and stop-loss price determines the potential loss per share. A tight stop-loss allows a larger position, while a wider stop-loss requires a smaller position size.
Market Type: Equities, derivatives, and commodities have different leverage and risk profiles. Futures and options in NSE can amplify gains and losses, so position sizing must account for margin requirements and leverage.
3. Position Sizing Methods
Several methods are commonly used by traders in India to calculate position size:
a) Fixed Dollar/Fixed Rupee Method
This method involves risking a fixed amount per trade, regardless of the stock price. For example, a trader decides to risk ₹10,000 per trade. This ensures that losses remain controlled, but it may not adjust for the volatility of different stocks.
B) Volatility-Based Position Sizing
In volatile Indian stocks, traders adjust position size according to the stock’s volatility. Average True Range (ATR) is often used to measure volatility. Highly volatile stocks receive smaller positions, and low-volatility stocks allow larger positions.
C) Kelly Criterion
The Kelly formula is a mathematical approach to maximize capital growth while managing risk. It calculates the optimal fraction of capital to invest based on win probability and reward-to-risk ratio. While precise, it is complex and often adjusted downwards to reduce risk in real-world trading.
4. Position Sizing in Indian Equities
Equity trading in India involves direct stock purchases or trades in derivatives like futures and options. Key considerations include:
Large-Cap vs Mid/Small-Cap: Large-cap stocks like Reliance, HDFC Bank, and Infosys are relatively less volatile, allowing slightly larger positions. Mid-cap and small-cap stocks require smaller position sizes due to higher volatility.
Liquidity Consideration: Stocks with higher trading volumes on NSE or BSE are easier to enter and exit. Illiquid stocks require smaller positions to prevent slippage.
Earnings Announcements & News: Indian markets are sensitive to corporate earnings, RBI announcements, and macroeconomic policies. Position size should be smaller when such events are expected to avoid excessive risk.
5. Position Sizing in Indian Derivatives Market
Trading in futures and options introduces leverage, which magnifies both profits and losses. Therefore:
Futures Contracts: Each NSE futures contract represents a certain number of shares. Traders must calculate potential loss using stop-loss levels and margin requirements before deciding the number of contracts.
Options: Buying call or put options involves premium risk. Traders risk only the premium paid but can adjust the number of contracts to align with their risk tolerance. Writing options carries unlimited risk, so extremely conservative position sizing is required.
Margin Leverage: Indian brokers offer leverage in derivatives. Traders should avoid over-leveraging by keeping a fraction of capital as margin buffer.
6. Practical Tips for Indian Traders
Start Small: Beginners should trade small positions to understand market behavior and manage psychological pressure.
Use Stop-Loss Religiously: Position size is ineffective without a stop-loss. NSE and BSE allow intraday stop-loss orders for risk management.
Diversify: Avoid concentrating positions in a single stock or sector. Diversification reduces unsystematic risk.
Adjust for Volatility: Use ATR or standard deviation to modify position size according to stock volatility.
Review Regularly: Position sizing is not static. Recalculate it based on changes in portfolio size, market volatility, and trading performance.
Leverage Awareness: Avoid using maximum leverage in futures or options. Keep leverage proportional to risk tolerance.
7. Common Mistakes in Position Sizing
Overtrading: Taking large positions on multiple trades simultaneously increases portfolio risk.
Ignoring Volatility: Treating all stocks equally regardless of volatility can lead to excessive losses.
No Risk Assessment: Entering trades without calculating potential loss per trade is a common mistake.
Emotional Adjustments: Increasing position size impulsively after a winning streak often leads to severe drawdowns.
8. Conclusion
Position sizing is the backbone of successful trading in the Indian markets. Whether trading equities, futures, options, or commodities, controlling the size of your positions relative to risk ensures long-term sustainability and profitability. It combines risk management, market knowledge, and psychological discipline. By using percentage risk, volatility-based, or fixed-amount methods, Indian traders can optimize returns while protecting capital.
A disciplined approach to position sizing transforms trading from speculation into a structured and controlled activity. It ensures that no single trade can wipe out your portfolio and allows traders to withstand market volatility, ultimately leading to consistent growth in the Indian market.

Part 1 Support and Resistance Understanding the Foundation of Option Profits
Before diving into strategies, two basic forces determine profit in options:
A. Price Movement of the Underlying
If the underlying asset (stock, index, commodity) moves in the direction you expect, your option gains value.
Calls gain when price goes up
Puts gain when price goes down
B. Premium (Option Price)
Premium is the amount you pay (for buyers) or receive (for sellers/writers).
Profit/loss happens based on how this premium changes.

Big Mistakes Traders Must Avoid1. Trading Without a Strategy
One of the biggest mistakes beginners make is trading without a clearly defined plan. They enter trades based on gut feelings, social media tips, or random chart patterns. Without a structured system, the trader relies on luck — and luck is not a strategy.
A proper trading strategy should define:
Entry rules
Exit rules
Stop-loss placement
Profit targets
Risk per trade
Market conditions (trend, range, volatility)
Beginners often jump between strategies, copying YouTubers or Telegram channels, killing their consistency. A good trader tests one system, refines it, and masters it over time.
2. No Risk Management
Many beginners believe making money is all about finding perfect entries. In reality, risk management is 70% of trading success.
Common risk mistakes:
Trading without stop-loss
Risking too much capital on a single trade
Averaging losers
Over-leveraging
A general rule is to risk only 1–2% of capital per trade. But new traders often risk 10–50% hoping for fast profits, and the market punishes this instantly.
Professional traders survive because they preserve capital first and grow second. Beginners try to grow fast and lose everything quickly.
3. Overtrading
Overtrading happens when traders take too many trades, either out of excitement or boredom. Many beginners think more trades equal more profit — but in trading, quality matters more than quantity.
Reasons beginners overtrade:
Wanting to recover losses
Emotional rush of the market
Fear of missing out (FOMO)
Misunderstanding setups
Overtrading leads to mistakes, emotional decision-making, and burnout. Elite traders might take only 1–5 high-quality trades a week, while beginners take 30–50 impulsive ones.
4. Emotional Trading
The market is a mirror that reflects a trader’s emotions: fear, greed, impatience, and ego. Beginners often have emotional reactions such as:
Fear of missing a move
Greed for a larger profit
Fear of losing
Revenge trading after losses
Impulsive decisions when stressed
Trading emotionally leads to:
Early exits
Late entries
Ignoring stop-losses
Forced trades
Losses due to panic
Successful trading requires a calm, disciplined mind that follows predefined rules. Consistency comes from emotional stability, not excitement.
5. Lack of Patience
Beginners often want profits now. They enter trades prematurely or exit too soon. But the market rewards patience — waiting for the right setup, the right confirmation, and the right time.
Patience is needed in:
Waiting for the chart to reach key levels
Allowing trade to hit targets
Avoiding unnecessary trades
Backtesting and learning
Most losses come from impatience, not lack of knowledge.
6. Not Accepting Losses
A major psychological trap is refusing to accept small losses. Beginners often say:
“It will come back.”
“I’ll wait a little more.”
“I can’t close in loss.”
This leads to:
Blown accounts
Huge drawdowns
Emotional distress
Professional traders accept losses as a cost of doing business. They keep losses small and controlled. Beginners avoid losses emotionally and end up taking catastrophic ones.
7. Following Tips, News, and Others’ Opinions
Many beginners follow:
Telegram tips
YouTube signals
WhatsApp groups
Friends’ opinions
Influencer recommendations
This creates dependency and confusion because:
The tip provider may not share risk levels
Market conditions differ
Signals can be manipulated
No one understands your trading style better than you
The best traders rely only on their own analysis, not random noise from outside.
8. Unrealistic Expectations
New traders enter the market thinking:
They’ll double their capital in a month
They can turn ₹10,000 into ₹10 lakh quickly
Trading is easy money
They will never lose
This mindset leads to frustration, losses, and quitting. Trading is a marathon, not a sprint. Realistic expectations:
Consistent returns are usually 2–8% per month for skilled traders
Losses are part of the process
Skill takes months or years to build
The market rewards discipline, not fantasy
9. Ignoring Market Structure
Beginners focus too much on indicators and too little on price action and market structure. Indicators lag; the structure leads.
Ignoring structure means beginners miss:
Trends
Support and resistance
Breakouts and reversals
Liquidity zones
Demand and supply
Trading blindly based on indicators creates confusion. Smart traders combine structure + indicators + risk rules.
10. Not Keeping a Trading Journal
A huge mistake beginners make is not recording their trades. Without a journal, traders cannot track mistakes, improve patterns, or refine discipline.
A journal should include:
Entry/exit
Timeframe
Emotions felt
Mistakes
Screenshots
Lessons
Every professional trader documents their trades. Beginners often don’t — and remain stuck.
11. Using High Leverage
Leverage is a double-edged sword. Beginners see it as a shortcut to big profits. In reality, it multiplies losses faster than profits.
High leverage causes:
Sudden liquidation
Panic during volatility
Overconfidence
Overtrading
Using low, controlled leverage is safer and keeps the account alive.
12. Not Learning Continuously
Markets evolve. Strategies stop working. Volatility changes. Without ongoing learning, traders become outdated. Beginners often stop learning once they know basics — but basics don’t create long-term success.
Continuous learning includes:
Studying charts daily
Backtesting setups
Understanding macro concepts
Improving psychology
Reviewing mistakes
The best traders treat trading like a profession that requires constant improvement.
Conclusion
Beginners make these mistakes not because they are incapable, but because trading feels deceptively simple. The biggest errors come from emotions, lack of discipline, and unrealistic expectations. To succeed, a trader must:
Focus on strategy
Manage risk strictly
Control emotions
Trade fewer but high-quality setups
Accept losses
Learn continuously
Trading is not about being right — it’s about managing risk, controlling emotions, and building discipline over time. Those who avoid the above mistakes build long-term, consistent profitability and survive the challenges that wipe out others.

Trade Rate Sensitive Assets: A Comprehensive OverviewIntroduction
In the global financial markets, assets are often influenced by fluctuations in trade rates, currency values, and interest rates. Trade rate sensitive assets are those whose valuations, returns, or profitability are significantly affected by changes in trade rates or related economic variables. Understanding these assets is crucial for investors, traders, and policymakers, as shifts in trade rates can impact everything from corporate earnings to sovereign debt sustainability. In this discussion, we will explore what trade rate sensitive assets are, the types of assets affected, the mechanisms of sensitivity, and practical strategies for managing associated risks.
Definition of Trade Rate Sensitive Assets
Trade rate sensitive assets are financial or physical assets whose value is directly or indirectly influenced by trade rates, exchange rates, or global trade dynamics. In this context, “trade rate” refers to the cost of importing or exporting goods and services, often mediated by currency exchange rates and tariffs. When trade rates fluctuate due to changes in currency valuations, trade policies, or global demand, the cash flows and profitability of these assets can be materially affected.
For example, a company that exports electronics from India to the United States may find that its revenue in Indian Rupees rises or falls depending on the USD/INR exchange rate. Similarly, bonds issued in foreign currency, commodities, or equity of export-driven companies are considered trade rate sensitive.
Categories of Trade Rate Sensitive Assets
Equities of Export-Oriented Companies
Companies engaged in global trade, particularly exporters, are highly sensitive to changes in trade rates. For instance:
Exporters: Revenue depends on foreign currency inflows. A stronger domestic currency reduces the local-currency value of foreign revenue, negatively impacting profits.
Importers: Firms reliant on imported raw materials may face higher costs if the domestic currency weakens, squeezing profit margins.
Examples include:
Technology companies exporting software or hardware.
Commodity companies exporting metals, agricultural products, or chemicals.
Foreign Currency Bonds
Bonds issued in foreign currency expose investors to trade rate and currency risk. When trade rates impact currency valuations:
The local-currency value of coupon payments and principal changes.
Investors holding USD-denominated bonds in emerging markets may gain or lose value depending on the USD exchange rate relative to their home currency.
Commodities
Many commodities are globally traded, so trade rate fluctuations directly influence pricing. For instance:
Oil and gas prices are denominated in USD globally; any currency depreciation in importing countries increases local costs.
Agricultural products, metals, and rare earth minerals are affected similarly, with global trade dynamics impacting supply and demand.
Derivative Instruments
Derivatives such as futures, options, and swaps on foreign currencies, commodities, and trade-sensitive indices also qualify as trade rate sensitive assets. They are particularly useful for hedging or speculating on trade rate movements. For example:
Currency futures can hedge export revenue against domestic currency appreciation.
Commodity futures allow exporters and importers to manage cost volatility.
Real Assets with Trade Exposure
Some physical assets, like factories, warehouses, or ships, are indirectly trade rate sensitive. For example, a shipping company’s revenue is tied to freight rates, which are influenced by global trade activity and currency movements.
Mechanisms of Sensitivity
Trade rate sensitivity arises from several interconnected mechanisms:
Exchange Rate Fluctuations
Exchange rates are a primary determinant of trade rate sensitivity. Assets that generate foreign revenue or require foreign inputs experience profit volatility when exchange rates shift.
A depreciation of the domestic currency improves export competitiveness, potentially increasing revenue.
Conversely, it raises the cost of imported inputs, affecting margins.
Tariffs and Trade Policies
Changes in trade tariffs, quotas, and regulations can directly impact asset value:
Increased tariffs on imported components may raise production costs for domestic manufacturers.
Export restrictions in foreign markets can limit revenue potential.
Global Economic Cycles
Trade-sensitive assets react to changes in global economic growth, as demand for exports fluctuates with industrial production, consumer spending, and investment cycles.
Commodity Prices
Many trade-sensitive assets, especially in resource-driven economies, are influenced by global commodity prices. For example:
Oil exporters benefit from rising crude prices in USD terms.
Agricultural exporters face revenue shifts based on international demand and currency-adjusted prices.
Interest Rate Differentials
Trade-sensitive assets in foreign currency can be indirectly affected by interest rate differentials. Higher domestic interest rates may strengthen the currency, impacting export competitiveness and asset valuations.
Risk and Volatility
Trade rate sensitive assets carry inherent risks due to their exposure to multiple dynamic factors:
Currency Risk: Volatile exchange rates can significantly alter asset values.
Trade Policy Risk: Sudden policy changes, sanctions, or tariffs can disrupt revenue streams.
Commodity Price Risk: Export-driven commodity firms face fluctuations in global prices.
Liquidity Risk: Assets with concentrated trade exposure may be harder to sell during economic shocks.
Investors must recognize that trade rate sensitivity introduces higher volatility compared to domestic-only assets, making risk management essential.
Investment and Hedging Strategies
Investing in trade rate sensitive assets requires careful assessment of global trade trends, currency movements, and economic indicators. Some practical strategies include:
Diversification
Spread investments across regions, sectors, and asset classes to reduce exposure to a single trade-sensitive factor.
Currency Hedging
Use forward contracts, options, or swaps to mitigate currency risk in foreign revenue or bonds.
Commodity Hedging
Exporters and importers can lock in prices via commodity futures or swaps to reduce volatility from global market fluctuations.
Monitoring Policy Developments
Stay informed on tariffs, trade agreements, and geopolitical developments that may affect asset valuations.
Active Portfolio Management
Adjust allocations dynamically based on macroeconomic indicators, exchange rate forecasts, and trade volume trends.
Examples in Real-World Markets
Apple Inc.: Generates significant revenue from exports; USD appreciation can affect international earnings.
Reliance Industries: Exposed to crude oil prices and global trade flows; currency and commodity risks are significant.
Emerging Market Bonds: Sensitive to USD movements and global interest rate changes, affecting repayment in local currencies.
Shipping Companies (e.g., Maersk): Revenue depends on global trade volumes and freight rates, which fluctuate with global economic conditions.
Conclusion
Trade rate sensitive assets form a crucial component of global financial markets, linking macroeconomic trends, currency movements, and international trade dynamics. These assets—ranging from equities, bonds, commodities, derivatives, to physical trade-linked assets—require careful monitoring due to their susceptibility to exchange rates, trade policies, and global demand cycles. Successful investment and risk management in these assets involve a combination of hedging, diversification, and close attention to macroeconomic and geopolitical indicators. Understanding the mechanisms and strategies related to trade rate sensitivity enables investors and policymakers to navigate volatility, optimize returns, and mitigate potential losses in a highly interconnected global economy.
Super Cycle Outlook: The Big Picture in Financial MarketHistorical Perspective of Super Cycles
Historically, super cycles have often been observed in commodities, stock markets, and global trade patterns. For instance:
Commodity Super Cycles: The industrialization of the United States and Europe during the 19th century created the first global commodity super cycle, driven by massive demand for coal, iron, and raw materials. Similarly, the post-World War II economic expansion, especially between the 1950s and 1970s, fueled a commodities boom, creating a super cycle for oil, metals, and agricultural products. More recently, China’s industrial rise in the 2000s led to a demand-driven super cycle in base metals such as copper, iron ore, and aluminum.
Equity Market Super Cycles: Stock markets also experience long-term super cycles, often reflecting sustained technological innovation, demographic transitions, or globalization. The U.S. stock market experienced a super cycle from the 1980s through 1999, driven by technology adoption, financial deregulation, and globalization. Similarly, emerging markets like India and China have seen multi-decade super cycles as rapid urbanization, rising middle-class income, and industrial expansion drove sustained economic growth.
Drivers of Super Cycles
Super cycles are not random—they are typically fueled by a combination of structural factors that persist over decades:
Demographics: Population growth and urbanization play a central role in super cycles. A young, growing population increases labor force participation, consumer demand, and investment in infrastructure. For instance, Asia’s rapid urbanization in the early 2000s drove a long-term commodity super cycle.
Technological Innovation: Revolutionary technologies can create long-term growth trends in equity markets and certain sectors. The rise of the internet, renewable energy, electric vehicles, and artificial intelligence has the potential to fuel new super cycles, reshaping the global economic landscape.
Globalization and Trade Expansion: The integration of emerging economies into global supply chains often creates decades-long growth trends. China’s entry into the World Trade Organization (WTO) in 2001 triggered a commodity super cycle and reshaped global trade flows.
Monetary and Fiscal Policies: Low interest rates, expansive fiscal spending, and accommodative monetary policy can extend super cycles by encouraging investment and consumption. The post-2008 period of global quantitative easing, for example, contributed to sustained equity market rallies in developed countries.
Geopolitical Shifts: Wars, sanctions, and trade agreements can have long-lasting effects on commodity prices and market sentiment. For instance, oil price super cycles have often coincided with geopolitical disruptions in the Middle East or shifts in OPEC strategies.
Phases of a Super Cycle
Super cycles generally progress through distinct phases, each with unique characteristics:
Emergence Phase: This is the initial stage, marked by structural change, technological breakthroughs, or demographic shifts. Asset prices may begin rising slowly as markets recognize long-term trends.
Acceleration Phase: During this period, growth becomes more visible and widely accepted. Investor optimism builds, demand outpaces supply, and markets often experience rapid price appreciation. Commodities or equities enter a strong upward trajectory.
Peak Phase: At this stage, growth reaches its maximum. Prices are often overextended relative to historical norms, speculation may increase, and market volatility can rise. Structural imbalances, such as overproduction or inflated valuations, often become apparent.
Decline or Correction Phase: After the peak, the super cycle gradually cools. Prices may decline sharply or stabilize at a lower growth trajectory, often influenced by macroeconomic corrections, demographic slowdowns, or shifts in policy.
Consolidation or Reversal: In some cases, super cycles may transition into new cycles or periods of stagnation. For instance, a commodities super cycle might end as demand stabilizes and supply chains normalize, paving the way for a new cycle in another sector or geography.
Implications for Investors
Understanding super cycles is crucial for both short-term traders and long-term investors:
Long-Term Asset Allocation: Super cycles influence which asset classes are likely to outperform over decades. For example, during commodity super cycles, investing in metals, energy, or infrastructure stocks can yield substantial returns.
Risk Management: Super cycles often bring higher volatility in the mid-term. Being aware of the stage of a super cycle allows investors to adjust portfolios and hedge risks effectively.
Sector Rotation: Super cycles create sector-specific opportunities. In the technology-driven super cycle of the 1990s, tech and internet companies outperformed traditional sectors. Similarly, emerging markets outperform during demographic-driven cycles.
Global Diversification: Super cycles are often regional or sector-specific. By diversifying globally, investors can capture growth in regions or sectors that are entering new super cycles while mitigating risks from declining cycles elsewhere.
Current Super Cycle Outlook
As of 2025, several analysts believe the global economy may be entering a new super cycle driven by:
Green Energy Transition: The global shift toward renewable energy, electric vehicles, and decarbonization efforts is creating a new long-term demand pattern for commodities like lithium, cobalt, copper, and rare earth metals.
Technological Advancement: AI, robotics, cloud computing, and biotechnology are transforming productivity and creating multi-decade growth opportunities in equities and specialized sectors.
Demographics and Urbanization in Emerging Markets: Africa, Southeast Asia, and parts of Latin America are experiencing rapid urbanization and population growth, potentially fueling new super cycles in infrastructure, consumer goods, and financial services.
Monetary Policy Evolution: Central banks are navigating the post-pandemic environment with cautious monetary policy, balancing inflation control and growth stimulation, which may influence the timing and intensity of super cycles.
Challenges and Risks
While super cycles present opportunities, they also carry inherent risks:
Speculative Excess: Long-lasting uptrends can encourage excessive speculation, leading to bubbles and abrupt corrections.
Geopolitical Uncertainty: Conflicts, trade wars, or sanctions can disrupt supply chains and derail super cycle expectations.
Technological Disruption: While technology can drive growth, it can also render existing industries obsolete, creating winners and losers in the market.
Environmental Constraints: Resource depletion, climate change, and sustainability issues may cap the potential of certain super cycles, especially in commodities and energy markets.
Conclusion
Super cycles are among the most influential drivers of long-term financial market trends. Unlike normal market cycles, they reflect deep structural shifts in economies, technologies, demographics, and global trade patterns. Understanding super cycles allows investors to make strategic long-term decisions, manage risks, and identify sectors poised for decades of growth. While predicting the exact timing and magnitude of super cycles is challenging, analyzing macroeconomic trends, demographic shifts, technological innovation, and geopolitical developments can provide valuable insights into where the next long-term opportunities may lie.
In 2025, the global outlook suggests a transition into a super cycle shaped by green energy, technological transformation, and emerging market growth. Investors, policymakers, and strategists who recognize and adapt to these long-term trends are likely to capture the maximum benefits of the next multi-decade expansion, while carefully managing the risks inherent in any large-scale structural market movement.
Part 7 Trading Master Class Why Traders Use Options
1. Hedging
Investors use options to protect their portfolios from downside risk.
Example: Buying a put option acts like insurance.
2. Speculation
Options allow traders to take directional bets with limited capital.
3. Income Generation
Selling options (covered calls, cash-secured puts) generates regular income through premium collection.
4. Leverage
Options enable traders to control large positions with small capital.

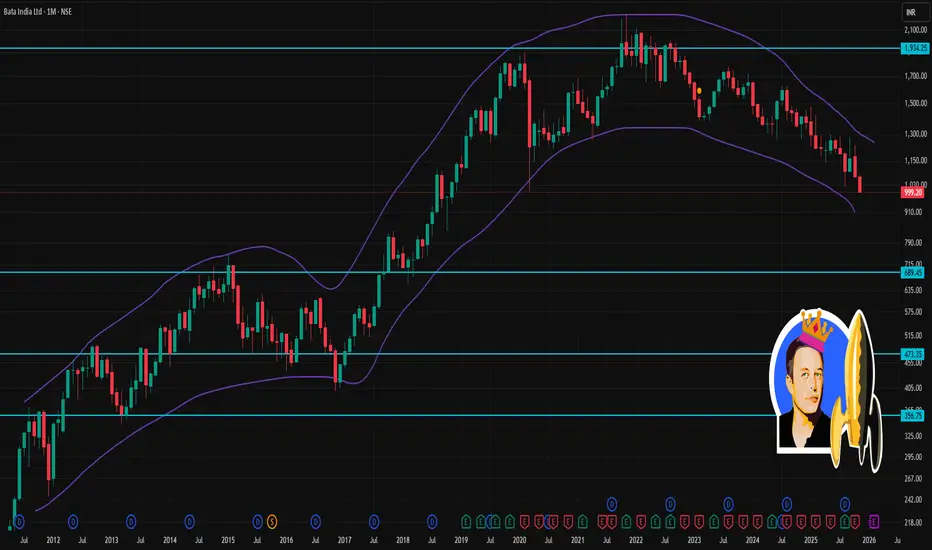
BATAINDIA 1 Month Time Frame 📌 Recent Price & Context
The stock has recently traded around ₹1,000–₹1,010 levels.
The 52-week high is ~₹1,479; 52-week low is ~₹996–₹1,005 (depending on the source) — so recent levels are close to the lower end of the 52-week range.
The stock has been under pressure lately, partly due to weak Q2 FY26 results which dragged sentiment.
⚠️ Key Risks & What’s Dragging the Stock
Weak recent financial performance — recent quarter’s poor results have weighed on sentiment.
Technical picture remains weak: price below all major moving averages, multiple sell signals on daily charts.
High volatility and lack of clarity on demand — any bounce may be shallow unless firm positive triggers come (e.g. good sales data, broader market up-move, sector tailwinds).
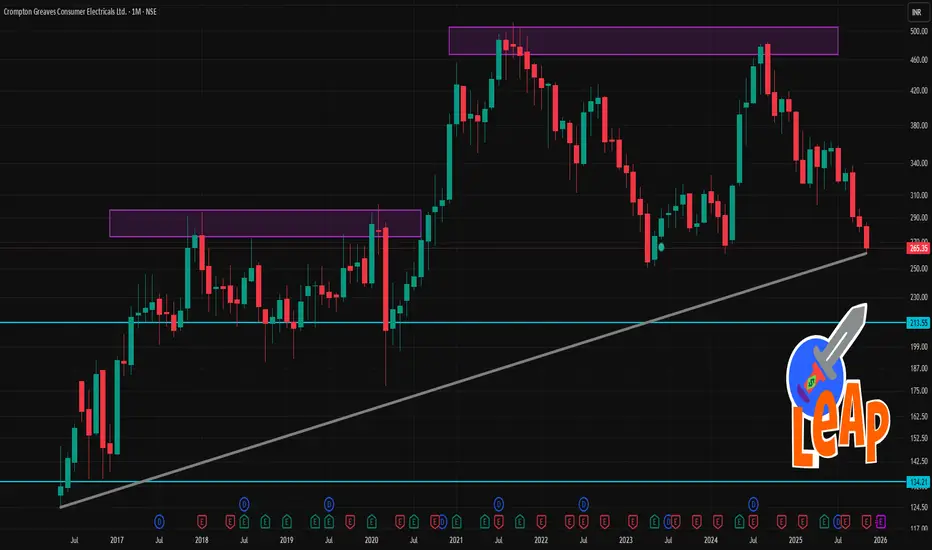
Crompton 1 Month Time Frame 📉 Recent context & background
The stock recently hit a fresh 52-week low — around ₹267.5–₹271.25.
Latest quarter (Q2 Sep-2025) saw a sharp profit drop: net profit fell ~43% YoY, with EBITDA margin under pressure due to commodity cost inflation and restructuring costs.
On the flip side, the company’s broader business mix (like pumps / small domestic appliances / solar-rooftop orders) and some analyst estimates still see potential for recovery.
🧭 What could move the price in next 1 month
Positive triggers: Any signs of margin recovery, easing of commodity inflation, good order wins (e.g. solar-segment orders or domestic appliance demand), supportive news or institutional interest.
Negative triggers: Continuation of margin pressure, weak demand in core categories, negative macro / interest-rate or inflation environment, or broader investor risk-off sentiment.
🎯 My Base-Case 1-Month Scenarios
Bearish to neutral scenario: Price may hover or drift around ₹260–₹285, possibly bouncing between support (₹265–₹270) and resistance (₹280–₹290).
Bullish/recovery scenario: If sentiment improves, stock could aim for ₹300–₹330 over the next 3–4 weeks — especially if company provides encouraging updates or sector environment improves.
Upside breakout scenario (less likely in short 1-month): A push toward ₹340 is possible only if there’s a strong catalyst (e.g., margin rebound, big orders, broadly bullish market) — but that feels optimistic for just 1 month.
Part 1 Intraday Trading Master ClassWhat Are Options?
Options are financial contracts that give you the right, but not the obligation, to buy or sell an underlying asset (like Nifty, Bank Nifty, a stock, etc.) at a fixed price within a specified time.
There are two types of options:
Call Option (CE) – Gives the right to buy
Put Option (PE) – Gives the right to sell
In India, all index and stock options are European style, which means they can be exercised only on expiry day, but they can be bought or sold (squared off) anytime before expiry.

Core Principles of Intraday Scalping Strategy1. Precision in Entry and Exit Timing
The heart of scalping lies in flawless timing. Since each trade aims to capture only a few ticks or points, even a slight delay can turn a winning trade into a losing one. Scalpers rely heavily on lower time frames such as the 1-minute, 3-minute, or 5-minute charts to pinpoint micro-trends and volatility spikes.
To achieve precision, traders often utilize tools such as:
Level 2 market depth
Order flow analysis
Volume-profile clusters
Price action patterns like micro pullbacks, breakouts, and retests
Perfect timing means entering before the move accelerates and exiting as soon as momentum shows signs of exhaustion. Overstaying in a position almost always leads to unnecessary risk.
2. Emphasis on Liquidity and Tight Spreads
Liquidity is the lifeblood of scalping. To get in and out quickly at favorable prices, a trader must operate in markets where buyers and sellers are constantly active. High liquidity reduces slippage, ensures tight bid-ask spreads, and allows traders to execute multiple positions efficiently.
In equities, scalpers usually pick:
High-volume large-cap stocks
Liquid index constituents
Instruments with narrow spreads
In forex or commodities, they prefer major pairs or index futures like NIFTY, BANKNIFTY, S&P500, gold, etc.
The tighter the spread, the easier it becomes for scalpers to break even and lock in small profits.
3. Risk Management Above Everything
Even though scalpers aim for small profits, the risk can escalate quickly if stops are not strictly executed. A single large loss can wipe out the gains of 20–30 successful scalps. Hence, risk management is not optional—it is the foundation.
Key risk principles include:
Fixed stop-loss orders for every single trade
Using smaller position sizes relative to capital
Defining daily maximum loss limits (stop trading after it hits)
Risk-to-reward ratios tailored for frequent exits, often 1:1 or even slightly lower, because the win rate compensates for it
Professional scalpers also avoid revenge trading and never compound losses by adding to a losing position.
4. High Win Ratio with Controlled Losses
Scalping depends on high trade accuracy. Unlike position trading where a few large wins can overcome many small losses, scalping thrives on consistency. A win-rate of 60–75% is typical among successful practitioners.
The core principle is simple:
Take small, consistent wins and cut losing trades instantly.
Losing trades must be kept extremely small, often exiting within seconds if the price does not move as expected. The edge lies not in the size of the profit but in the frequency and accuracy.
5. Reading Momentum and Micro-Trends
Momentum is everything in scalping. Traders must develop the ability to sense the strength of price movement in real time. This involves:
Watching consecutive green or red candles
Observing volume surges
Tracking sudden imbalances in buying or selling pressure
Identifying micro pullbacks and continuation setups
Momentum trading is especially effective during:
Opening market hours
Breakouts of key intraday levels
News releases
Strong trending sessions
Scalpers avoid sideways, choppy markets because the probability of whipsaws increases significantly.
6. Clear and Repeatable Strategy Setup
Successful scalpers do not improvise on the spot. They follow one highly refined setup or at most two. Their repeatable strategy might involve:
Breakout scalping
VWAP bounce/reversal scalping
Order-flow imbalance scalping
EMA crossover with momentum confirmation
Liquidity sweep and immediate reversal entry
The more precise and repetitive the setup, the quicker the execution. Scalpers aim for muscle-memory trading, where they instantly recognize setups with minimal hesitation.
7. Discipline and Emotional Stability
Scalping can be psychologically intense. Trades open and close within seconds. Markets can reverse rapidly, and rapid-fire decision-making can trigger emotional responses like fear, greed, and frustration.
Core psychological principles include:
Avoiding FOMO entries
Remaining patient until the perfect setup appears
Not increasing position size to recover losses
Maintaining calm during rapid market movements
Mental discipline is what separates consistent scalpers from impulsive traders who burn out quickly.
8. Technology and Speed of Execution
Since scalping requires ultra-fast entries and exits, traders depend on high-quality trading infrastructure:
Low-latency internet connection
High-performance trading platform
Hotkeys for quick order execution
Advanced charting tools
Direct market access (DMA) brokers when available
Even a one-second delay in order execution can significantly affect profitability.
9. Focus on Market Structure and Key Intraday Levels
Scalpers must understand the structure of the market at a micro level. Before trading, they identify key levels such as:
Previous day’s high/low
Opening range breakout (ORB) levels
VWAP and standard deviations
Fibonacci intraday zones
Fair value gaps (FVGs)
Supply and demand zones
Trading around these levels provides natural liquidity, momentum bursts, and clearer direction.
10. Small Profit Targets, but High Frequency
Scalpers aim for 0.1% to 0.5% price movements. The strategy works because trades are frequent. Instead of chasing a big move, they accept whatever the market offers quickly and consistently.
A typical scalper may aim for:
10–50 trades per session
5–10 points in index futures per trade
0.05–0.2% move in stocks
Frequent partial exits to secure gains
Small wins accumulate rapidly, resulting in steady returns.
11. Adaptability to Changing Market Conditions
Markets behave differently across sessions. Some days are trending strongly; others are range-bound or news-driven. A scalper must adapt:
Trade more aggressively in high momentum
Reduce size during consolidation
Avoid trading before major news if spreads widen
Block trading during highly unpredictable spikes
Adaptability is a key edge because scalping cannot be performed blindly.
12. Strict Trading Journal and Performance Review
Data is the scalper’s ultimate teacher. Keeping a detailed trading journal helps identify:
Win/loss patterns
Best performing setups
Error tendencies
Psychological weaknesses
Times of day with highest accuracy
Weekly reviews allow scalpers to continuously refine their strategy and improve execution.
Conclusion
Intraday scalping is a skill-based, high-concentration trading method that demands discipline, speed, and a systematic approach. Its core principles revolve around precision, risk management, liquidity, momentum reading, and psychological control. While the profits per trade are small, the cumulative gains can be significant when the strategy is executed consistently. By mastering these principles and maintaining emotional stability, traders can turn scalping into one of the most rewarding—yet challenging—forms of intraday trading.
NUVAMA 1 Day Time Frame 📈 Current Price & Setup
NUVAMA is trading around ₹7,480–7,550 lately.
Over the past 52 weeks the stock’s range is roughly ₹4,735 (low) to ₹8,508 (high).
🔎 Technical Outlook (1‑day timeframe)
On daily chart indicators (moving averages + oscillators), many third‑party sources mark NUVAMA as a “Strong Buy” today.
Short‑term technical bias appears bullish, with recent momentum favouring upside over downside.
⚠️ Important Considerations & Fundamentals
The company’s valuations appear relatively rich: the price‑to‑book (P/B) ratio is elevated.
Promoter pledge status is non‑trivial — as per recent data, a significant portion of promoter holding is pledged.
As always: on a 1‑day timeframe the stock can be volatile — technical signals are strong, but broader market conditions (macro, sector sentiment, news, flows) will matter a lot.

Best Timeframes for Chart PatternsHow to Trade Chart Patterns
Here is a simple, structured approach:
1. Identify the pattern early
Use clean charts, avoid too many indicators, and focus on structure. Patterns become clearer with practice.
2. Mark support and resistance levels
These levels act as breakout zones. Always confirm with a trendline or neckline.
3. Wait for a breakout
Never assume. Patterns are confirmed only when price breaks key levels.
4. Check volume
Higher volume on breakout adds confidence. Without volume support, avoid entering.
5. Set stop-losses
Place SL beyond pattern boundaries—e.g., outside triangles or below neckline.
6. Use target projections
Most patterns have measurable targets:
Flags → height of flagpole
Head and Shoulders → distance from head to neckline
Triangles → widest part of the formation

Divergence Secrets Tips for Successful Option Trading
Always use stop-loss
Track IV and IV percentile
Learn market structure (trend, range, breakout)
Avoid buying options in low IV environments
Avoid selling options in highly trending markets
Maintain proper risk-to-reward
Never hold naked options till expiry if inexperienced
Focus on quality setups, not quantity

Impact of Geopolitical Risks on Indian Financial MarketsIntroduction
Geopolitical risks have emerged as a significant determinant of financial market behavior across the globe. Defined as the potential for political, social, or military events to disrupt the stability of economies and financial markets, these risks can profoundly impact investor sentiment, capital flows, and asset prices. India, as one of the fastest-growing emerging economies, is particularly sensitive to geopolitical developments due to its strategic location, dependency on energy imports, and integration with global trade networks. From regional conflicts in South Asia to global trade tensions, geopolitical events create volatility in Indian financial markets and influence both domestic and international investors’ decision-making processes.
Channels Through Which Geopolitical Risks Affect Markets
The impact of geopolitical risks on Indian financial markets occurs through several interlinked channels:
Investor Sentiment and Market Volatility:
Geopolitical instability can trigger uncertainty among investors, leading to sudden sell-offs in equity markets. Fear of potential disruptions in economic activity prompts investors to adopt risk-averse strategies, often reallocating capital to safe-haven assets such as gold, U.S. Treasury securities, or currencies like the Swiss Franc. In India, major geopolitical shocks have historically led to heightened volatility in the Bombay Stock Exchange (BSE) and the National Stock Exchange (NSE).
Foreign Institutional Investment (FII) Flows:
India relies significantly on foreign institutional investors (FIIs) to provide liquidity and drive equity market growth. Geopolitical tensions can prompt FIIs to withdraw or reduce investments in emerging markets due to perceived risks, adversely affecting stock indices. For instance, conflicts in the Middle East impacting oil prices often lead to capital outflows from Indian markets, weakening the rupee and exerting downward pressure on equity valuations.
Commodity Prices and Inflation:
India is heavily dependent on imports for critical commodities, particularly crude oil. Geopolitical disruptions in oil-producing regions, such as the Middle East, directly impact crude oil prices, influencing inflation and fiscal policy. Rising crude prices increase production and transportation costs, squeezing corporate margins and reducing disposable income for consumers. This ripple effect negatively impacts stock markets, especially sectors like transportation, manufacturing, and consumer goods.
Currency Fluctuations:
The Indian rupee is highly sensitive to global geopolitical developments. Crises in oil-rich regions, U.S.-China trade tensions, or conflicts affecting major global economies can lead to capital flight from emerging markets, depreciating the rupee. Currency depreciation increases import costs, fuels inflation, and heightens uncertainty for foreign investors, creating further pressure on equity and bond markets.
Interest Rates and Monetary Policy:
Geopolitical shocks can indirectly influence monetary policy decisions. Rising inflation due to higher commodity prices or currency depreciation can compel the Reserve Bank of India (RBI) to adopt a tighter monetary stance, raising interest rates to stabilize prices. Higher interest rates may dampen investment and consumption, affecting corporate earnings and stock market performance.
Historical Examples of Geopolitical Risk Impact on Indian Markets
Gulf Wars and Oil Price Shocks:
During the Gulf War in 1990-1991, crude oil prices surged due to conflict in the Middle East, creating inflationary pressures in India. The Indian stock market experienced volatility, and capital outflows intensified due to investor concerns about the country’s balance of payments and economic stability. The rupee depreciated significantly, and sectors dependent on imported oil and petrochemicals were hit hardest.
U.S.-China Trade Tensions:
Although primarily affecting global markets, trade wars between the U.S. and China had spillover effects on India. Investor apprehension about global growth slowdown led to FII outflows from Indian equities. Export-oriented industries in India, such as IT and manufacturing, faced uncertainty regarding demand and pricing, impacting their stock performance.
Russia-Ukraine Conflict (2022):
The Russia-Ukraine war caused a global energy crisis and disrupted commodity markets. India faced rising crude oil and gas prices, leading to inflationary pressures and fiscal stress. Indian equities reacted with short-term volatility, particularly in energy-intensive sectors and industries heavily reliant on imports. Currency depreciation and bond market stress were also observed as global risk sentiment deteriorated.
Border Tensions with China and Pakistan:
Regional conflicts have historically influenced investor sentiment in India. Escalating tensions along the India-China border or cross-border skirmishes with Pakistan often create uncertainty regarding domestic stability, prompting investors to temporarily reduce equity exposure, resulting in short-term market corrections.
Sectoral Impacts of Geopolitical Risks
The impact of geopolitical risks is often sector-specific:
Energy and Oil & Gas: Directly affected due to import dependency and global supply disruptions.
Defense and Infrastructure: Geopolitical tensions often increase defense spending, benefiting defense contractors and infrastructure companies.
IT and Exports: Trade disruptions and sanctions affect export-oriented businesses, including IT and pharmaceutical sectors.
Banking and Financial Services: Volatility affects investor confidence, credit growth, and risk-weighted assets, impacting banking profitability.
Strategies Adopted by Investors and Policymakers
Portfolio Diversification:
Investors often diversify across asset classes and geographies to hedge against geopolitical risks. Gold and other safe-haven assets are popular choices during periods of heightened uncertainty.
Derivative Hedging:
Hedging using futures, options, and currency swaps allows investors and corporates to mitigate exposure to market and currency volatility induced by geopolitical developments.
Policy Interventions:
The Indian government and RBI actively monitor global developments. Strategic petroleum reserves, currency interventions, and monetary policy adjustments are tools used to manage external shocks. For instance, during periods of oil price spikes, the government has reduced excise duties to contain inflationary pressures.
Long-Term Investment Outlook:
While short-term market movements are highly sensitive to geopolitical shocks, long-term investors often focus on India’s underlying growth potential, robust domestic consumption, and reform-driven policies to maintain confidence.
Challenges and Risks
Despite strategies to mitigate geopolitical risks, certain challenges persist:
Unpredictability: Geopolitical events are inherently uncertain and often occur suddenly, making it difficult for investors and policymakers to respond immediately.
Global Interconnectedness: India’s integration with global financial markets amplifies the impact of distant geopolitical events.
Inflationary Pressures: Persistent inflation due to commodity price shocks can undermine economic stability and erode investor confidence.
Currency Depreciation: Continuous volatility in the rupee can create uncertainty for foreign investors and corporates with significant external debt exposure.
Conclusion
Geopolitical risks represent a complex and multifaceted challenge for Indian financial markets. They affect market sentiment, investment flows, commodity prices, currency stability, and monetary policy decisions. Historical evidence demonstrates that both global and regional geopolitical events have significant short-term impacts, often causing volatility and sector-specific repercussions. However, India’s robust economic fundamentals, strategic policy interventions, and long-term growth potential provide a cushion against sustained market disruption. For investors, a careful blend of risk management strategies, diversification, and a long-term outlook remains essential to navigate the uncertainties posed by geopolitical risks. As India continues to integrate further into global markets, understanding and managing these risks will remain a crucial aspect of financial market strategy.
Trading Styles in the Indian Market1. Intraday Trading
Intraday trading, commonly known as day trading, is one of the most popular styles in India due to high volatility and leverage availability. It involves entering and exiting trades within the same trading day. The primary objective is to capture small price movements across large volumes.
Key Features
Short time frames: 1–5 minutes, 15 minutes, or hourly charts.
High leverage: Brokers offer margin for intraday trades.
Targets are small: 0.3% to 1.5% moves.
Risk management is crucial due to high volatility.
Popular Strategies
Momentum trading during market opening.
Breakout and breakdown strategies.
VWAP-based institutional flow tracking.
Reversal trades at key supply-demand zones.
Best Suited For
Traders with quick decision-making skills, emotional discipline, and the ability to monitor charts during market hours.
2. Swing Trading
Swing trading is ideally suited for the Indian market because stocks often move in short-term trends driven by news, earnings expectations, institutional flows, and sector rotation. Swing traders typically hold positions for 2–20 days.
Key Features
Higher timeframe analysis: Daily and weekly charts.
Lower stress compared to intraday.
Ideal for people with jobs who cannot monitor the market all day.
Uses technical patterns like flags, triangles, pullbacks, and breakouts.
Popular Swing Indicators
Moving averages (20, 50, 200)
RSI divergences
Fibonacci retracement zones
MACD crossovers
Best Suited For
Traders who prefer moderate risk, medium-term profits, and structured analysis without minute-to-minute monitoring.
3. Positional Trading
Positional trading involves holding trades for weeks to months based on broader market trends. This style is popular among experienced traders and investors who understand macro trends, sectoral cycles, and company fundamentals.
Key Features
Focus on major trends, not minor fluctuations.
Requires patience and conviction.
Uses weekly and monthly charts.
Less stressful than intraday/swing.
Approach
Use fundamentals for selection and technicals for timing.
Sectors like banking, FMCG, pharma, and IT respond well to positional plays.
Key tool: trendlines, moving averages, sector rotation analysis.
Best Suited For
Working professionals, medium-capital traders, and long-term thinkers.
4. Scalping
Scalping is one of the fastest and most advanced trading styles. The goal is to book very small profits (0.05%–0.3%) multiple times throughout the day. Scalping is extensively used in index derivatives—especially NIFTY, BANK NIFTY, and FINNIFTY—because liquidity and depth are extremely high.
Key Features
Extremely quick trades lasting seconds to minutes.
High frequency, low risk per trade.
Requires stable internet and low-latency execution.
Works best during high liquidity periods—opening hour and closing hour.
Tools
Option order flow
VWAP
Depth of market (DOM) data
Tick charts and footprint charts (for advanced scalpers)
Best Suited For
High-skill professional traders with strong reflexes, emotional control, and advanced tools.
5. Algorithmic and System-Based Trading
Algo trading has grown rapidly in India with the availability of APIs, platforms like Zerodha Streak, Tradetron, and custom Python systems. Algorithmic trading uses rules, automation, and backtesting instead of emotional decision-making.
Key Features
Mechanical, rule-based execution.
Removes emotions from trading.
Can handle high-frequency signals.
Backtesting helps refine strategies.
Popular Algo Styles
Trend-following systems.
Mean-reversion systems.
Statistical arbitrage.
Option selling with hedges.
Market-neutral strategies.
Advantages
Consistency and discipline.
Ability to trade multiple symbols simultaneously.
Works even for part-time traders.
Best Suited For
Tech-savvy traders, engineers, data scientists, or those who prefer automation over discretion.
6. BTST / STBT Trading (Buy Today, Sell Tomorrow / Sell Today, Buy Tomorrow)
BTST and STBT trading styles focus on overnight price movements influenced by global cues, economic announcements, or corporate news.
Key Features
BTST: Carry equity positions overnight to capture gap-up openings.
STBT: Mostly used in F&O due to short selling restrictions.
Trades depend on global markets—Dow, SGX NIFTY, crude oil, and currency moves.
Best Suited For
Swing traders who want to avoid intraday volatility but profit from overnight reactions.
7. Options Buying (Directional)
Options trading has exploded in India due to low capital entry and high reward potential. Directional option buyers predict sharp short-term moves.
Focus Areas
ATM/OTM calls and puts.
Breakout-based entries.
Trend days with strong momentum.
Expiry day (Thursday) trades.
Challenges
High theta decay.
Requires accuracy in direction and timing.
Best Suited For
Experienced traders who understand volatility, Greeks, and market structure.
8. Options Selling (Non-Directional or Semi-Directional)
Option selling is preferred by professional traders because it offers consistent income through premium decay.
Popular Strategies
Straddles & strangles.
Iron condor.
Bull/bear spreads.
Calendar spreads.
Advantages
High probability trades.
Beneficial during low-volume consolidations.
Risks
Requires strict hedging.
Black swan events can cause large losses.
Best Suited For
Capital-rich traders with risk-management experience.
9. Trend Following
Trend following is timeless and works well in trending markets like India. Instead of predicting tops and bottoms, trend followers ride the big wave.
Key Features
Use moving averages (20/50/200).
Enter after confirmation, not prediction.
Works extremely well in bull markets.
Requires fewer but high-quality trades.
Psychology
Trend following is simple but emotionally challenging because you must hold winners and cut losers quickly.
10. News-Based and Event Trading
Event traders focus on volatility around:
RBI policy
Budget announcements
Earnings results
Global macro events
Corporate announcements
Approach
Predict volatility, not direction.
Often uses straddles/strangles.
Fast execution is required.
Conclusion
The Indian market provides opportunities for every type of trader—from beginners to advanced professionals. Each trading style has its strengths, weaknesses, and ideal market conditions. To succeed, traders must choose a style that matches their personality, risk tolerance, time availability, and capital. Mastery comes from specialization, risk management, and continuous learning.

Part 1 Intraday Trading Master ClassIndex Options vs Stock Options
Index Options
Extremely liquid
Weekly expiry
Less manipulation
Ideal for intraday traders
Stock Options
Monthly expiry only
Higher margin for selling
Less liquid compared to index
Better for positional strategies

Part 1 Support and Resistance What Are Options?
Options are derivative contracts, which means their value is derived from an underlying asset such as stocks, indices, commodities, or currencies. In India, the most traded options revolve around:
Nifty 50
Bank Nifty
FinNifty
Stocks in the F&O list
An option contract gives a trader a right but not an obligation. This is what separates option buyers from option sellers.

MARUTI 1 Month Time Frame 📊 Key Metrics
Current price around ₹16,000 region.
One-month return: approximately –2.5% to –3%.
52-week high around ~₹16,660 and low around ~₹10,725.
🔍 Approximate Support & Resistance Levels (1-month timeframe)
From recent charts and technical data:
Immediate resistance: ~ ₹16,172 (R1), then ~ ₹16,368 (R2) and ~ ₹16,585 (R3)
Immediate support: ~ ₹15,759 (S1), then ~ ₹15,542 (S2) and ~ ₹15,346 (S3)
Pivot zone: ~ ₹15,955

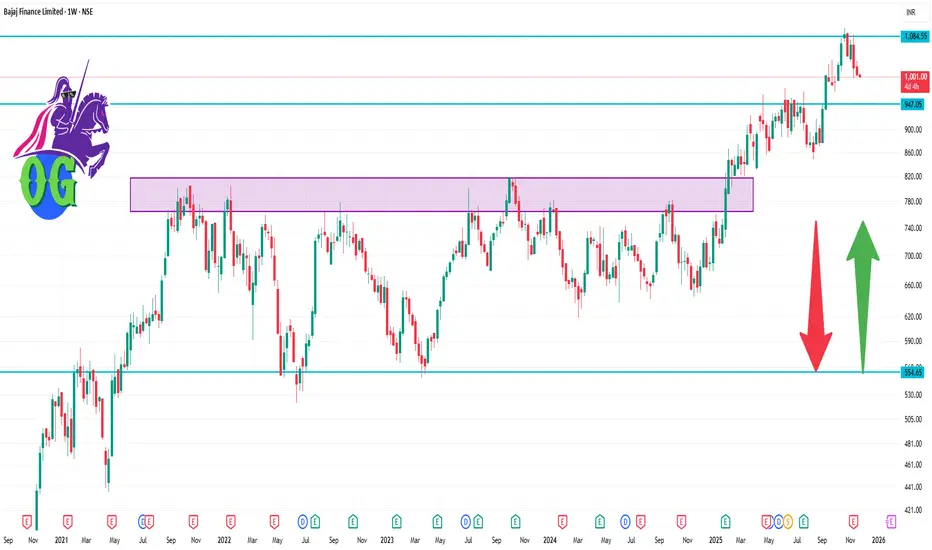
BAJFINANCE 1 Week Time Frame📊 Key Technical Levels
- Current price: ~ ₹1,004 (per Moneycontrol quote)
- Support zone:
~ ₹960-₹970 appears a meaningful near-term support (recent consolidation area)
If breakdown happens, a deeper support around ₹920-₹930 could become relevant
- Resistance zone:
~ ₹1,050-₹1,060 is the first hurdle (recent highs + psychological round number)
A stronger resistance around ₹1,100 (near the 52-week high ~₹1,102.50)
- Range estimate for week:
If neutral: ₹960-₹1,050
If bullish breakout: toward ₹1,100
If bearish breakdown: toward ₹920-₹930 or lower
Why Candlestick Patterns Matter in Trading🔸 Types of Candlestick Patterns
Candlestick patterns can be broadly classified into:
A. Single-Candle Patterns
Hammer
Hanging Man
Inverted Hammer
Shooting Star
Doji
Spinning Top
Marubozu
B. Double-Candle Patterns
Bullish Engulfing
Bearish Engulfing
Piercing Pattern
Dark Cloud Cover
Tweezer Top
Tweezer Bottom
Harami
Harami Cross
C. Triple-Candle Patterns
Morning Star
Evening Star
Three White Soldiers
Three Black Crows
Three Inside Up
Three Inside Down

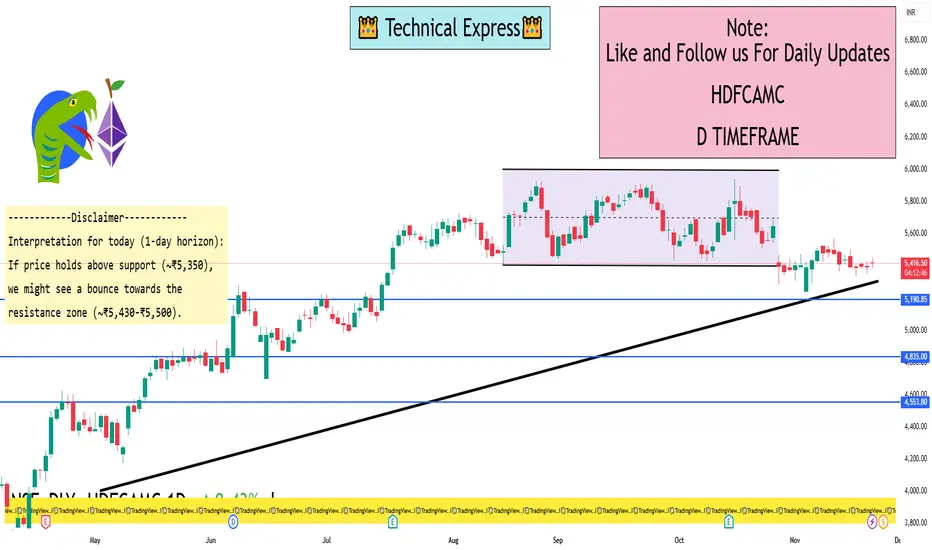
HDFCAMC 1 Day View Current price (approx): ₹5,444.50 as of 10:48 AM IST on 24 Nov 2025.
Day’s range: Low ~ ₹5,385.00, High ~ ₹5,447.00.
Recent support zone: ~ ₹5,354-₹5,316 (based on 5Paisa pivot levels)
Immediate resistance zone: ~ ₹5,428.83-₹5,502.83 (from same pivot table)
Interpretation for today (1-day horizon):
If price holds above support (~₹5,350), we might see a bounce towards the resistance zone (~₹5,430-₹5,500).
If price breaks below support decisively, downside risk opens up toward ~₹5,280 or lower.
Conversely, a breakout above the resistance zone could open further upside beyond ~₹5,500.
Trading with Volume1. What is Volume in Trading?
Volume is the total number of shares, contracts, or lots traded in a market during a particular period. Every time a buyer and seller make a transaction, it adds to the volume count.
For example:
If 10,00,000 shares of a stock are bought and sold during a day, that stock’s daily volume is 10 lakh.
If Bitcoin has 50,000 transactions in a 1-hour timeframe, that is its hourly volume.
Volume acts as the pulse of the market. When market participants are active, volume increases. When they lose interest, volume shrinks.
2. Why is Volume Important for Traders?
Volume helps traders answer critical questions:
a. Is the trend strong or weak?
A price trend supported by high volume is considered trustworthy. A trend on low volume is often weak and may collapse.
b. Is the breakout real or fake?
Strong volume during breakouts confirms genuine market interest. Low-volume breakouts often fail.
c. Is a reversal coming?
Volume spikes at tops or bottoms often indicate exhaustion and potential reversal.
d. Where are big players active?
Institutional traders like banks, funds, and smart money leave “footprints” through volume surges.
Thus, volume is a confirmation tool that helps traders avoid traps and make informed decisions.
3. Understanding Volume in Different Market Conditions
a. Volume in Uptrends
When volume rises along with price, the uptrend is considered healthy. Buyers are active and willing to buy at higher levels.
Signs of strong uptrend:
Price ↑ and Volume ↑ → Strong bullish trend
Pullback with low volume → Healthy correction
Signs of weakening uptrend:
Price ↑ but Volume ↓ → Weak trend, risk of reversal
b. Volume in Downtrends
In downtrends, high volume indicates strong selling pressure.
Strong downtrend signals:
Price ↓ and Volume ↑ → Strong bearish trend
Pullback with low volume → Continuation likely
Weak downtrend signals:
Price ↓ but Volume ↓ → Bear trend losing strength
c. Volume in Ranging Markets
In sideways markets, volume generally remains low. A sudden volume spike during range breakout signals trend formation.
4. How to Use Volume for Trading – Practical Techniques
Technique 1: Volume Breakout Trading
Breakouts are powerful signals but also come with fake moves. Volume confirms the authenticity.
Bullish breakout confirmation:
Price breaks resistance
Volume rises above average
Candle closes above breakout level
Bearish breakout confirmation:
Price breaks support
Volume spikes downward
Close is below the support level
Without volume confirmation, breakouts often fail and trap traders.
Technique 2: Volume Divergence
Divergence occurs when price and volume move opposite.
Examples:
Price making higher highs but volume making lower highs → Bullish trend weakening
Price making lower lows but volume decreasing → Bearish trend weakening
Such divergence often signals trend reversal.
Technique 3: Volume Spike Analysis
Sudden large volume spikes can mean:
A big player entering or exiting a position
Market turning point
Start of strong trend
At market bottoms, huge buying volume often appears. At tops, big selling volume may signal reversal.
Technique 4: Using Volume with Indicators
Some popular volume-based indicators:
a. Volume Moving Average (VMA)
Shows average volume to identify when current volume is unusually high or low.
b. On-Balance Volume (OBV)
Adds volume on up days, subtracts on down days to show accumulation/distribution.
c. Volume Weighted Average Price (VWAP)
Used by institutional traders; shows average price weighted by volume.
d. Money Flow Index (MFI)
Combines price and volume to detect overbought/oversold zones.
Using these indicators with price action increases trading accuracy.
5. Volume and Candlestick Patterns
Volume adds strength to candlestick signals.
Examples:
Bullish engulfing with high volume → Strong reversal
Hammer with high volume at support → Buyers entering
Doji with high volume → Indecision among big players
Volume validates candlestick reliability.
6. Volume and Support/Resistance Levels
Support and resistance zones are crucial. Volume helps confirm their strength.
At Support:
Price touches support with low volume → Support likely to hold
Price breaks support with high volume → Strong breakdown
At Resistance:
Price hits resistance with low volume → Resistance holding
Breaks resistance with high volume → Breakout confirmed
Volume acts as the deciding factor in whether levels hold or break.
7. How Smart Money Uses Volume
Institutional traders use volume to accumulate or distribute positions quietly.
Accumulation phase:
Price stays in range
Volume gradually increases
No big price movement
This indicates smart money buying.
Distribution phase:
Price stops rising
Volume spikes at peaks
Smart money selling to retail traders
Recognizing these phases helps traders identify big trends early.
8. Common Mistakes Traders Make with Volume
a. Believing every volume spike means breakout
Volume should be analyzed with price action, not in isolation.
b. Ignoring trend context
High volume in a range is meaningless unless combined with price breakout.
c. Misreading low-volume pullbacks
These are actually healthy for trends, not signs of weakness.
d. Trading without confirming volume
Entering trades based on price alone increases risk.
9. Best Practices for Volume Trading
Compare volume with average volume, not previous candles
Combine volume with trendlines, levels, and patterns
Avoid trading false breakouts without volume confirmation
Watch volume at key supports/resistances
Use volume indicators only as a supplement
Focus on multi-timeframe volume behavior
These practices significantly improve trading accuracy.
Conclusion
Trading with volume gives traders an edge by revealing the hidden strength behind price movements. Volume confirms trends, validates breakouts, identifies reversals, and exposes the actions of big players. When used correctly with price action, support/resistance, and technical indicators, volume becomes one of the most reliable tools in trading. For both beginners and advanced traders, mastering volume analysis is essential for smart, confident, and profitable trading decisions.