Part 8 Trading Master Class With ExpertsOptions Trading Styles in Markets
1. Intraday Option Trading
Fast movements
High leverage
Requires quick decision-making
2. Positional Options Trading
Holding for days or weeks
Less stressful than intraday
3. Weekly Expiry Trading (India-specific)
NIFTY & BANK NIFTY weekly options
Very popular among retail traders
Weekly options bring rapid time decay, which benefits option sellers but hurts buyers.
Trade

Premium Chart Pattern Understanding Chart Patterns
Every chart pattern represents crowd psychology—fear, greed, uncertainty, accumulation, or distribution. Institutional traders leave their footprint on charts, and patterns help retail traders align with their moves.
Patterns are formed across all time frames:
1-minute charts for scalping
5–15 minutes for intraday
1 hour for swing trading
Daily/weekly charts for positional trading
The bigger the time frame, the more reliable the pattern.

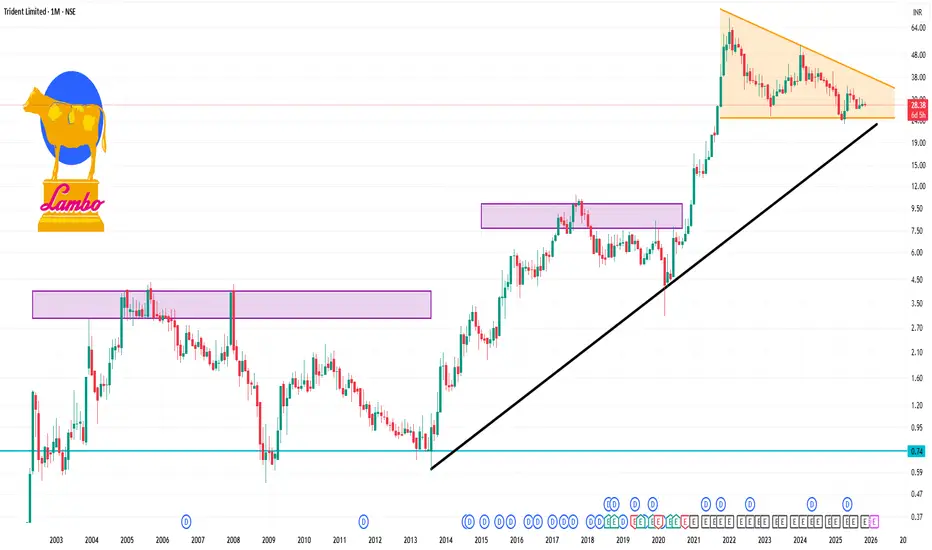
TRIDENT 1 Month Time Frame ✅ What we see
Fundamentals
Current price ~ ₹28.38.
Market cap ~ ₹14,462 cr, P/E ~32.8×, P/B ~3.15×.
ROE quite low (~8-10% range) and growth over past years has been muted.
52-week high ~ ₹40.20, 52-week low ~ ₹23.11.
Recent quarterly figures: sales up modestly; profits under pressure.
Technical / Price context
The share is nearer to its 52-week low than high, which may offer perceived value to some.
Some moving-average crossovers (per reports) flagged “sell signals” in short term.
Short-term return in past month has been very small (~0.64% 1-month return).
Part 2 Intraday Master Class1. Option Buying
Low capital
Limited risk
Unlimited profit
Requires strong movement
Suffers from time decay
2. Option Selling
High capital
Limited profit (premium)
High or unlimited risk
High probability trades
Theta decay works in favor

Option Trading Strategies Put Buyer
Pays premium
Expects price to fall
Risk limited to premium
Profit increases as price goes down
Put Seller
Receives premium
Expects price to stay flat or go up
Risk large if market crashes

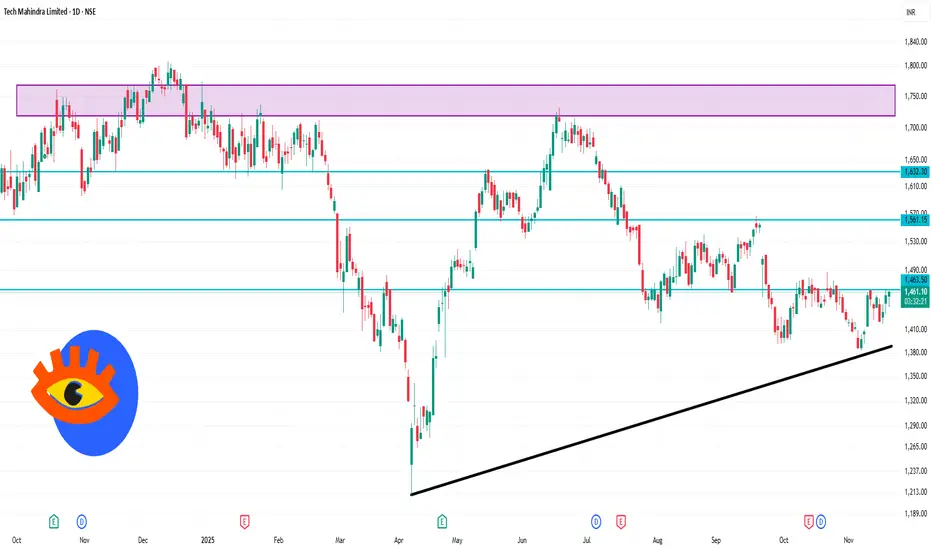
TECHM 1 Day Time Frame 📌 Current Snapshot
Last traded price: ~ ₹1,461.30 (as of ~11:54 AM IST)
Day’s range: ~ ₹1,440 (low) to ~ ₹1,461 (high)
52-week range: low ~ ₹1,209.40, high ~ ₹1,807.70
🔍 Short-term Levels to Note
Support zone: ~ ₹1,440 — this is near the day’s low.
Resistance zone: ~ ₹1,465–₹1,470 — given the current price is ~₹1,461, this is where some upward friction may occur.
If price breaks below support (~₹1,440), next support could be around ~ ₹1,420–₹1,430 (based on recent intraday lows).
If it breaks above the resistance zone (~₹1,470+), the next meaningful level could be ~ ₹1,500 (psychological + round number) or higher.
Part 2 Master Candle Stick PatternsWhat Drives Option Prices Intraday?
Several factors affect option prices every minute:
1. Underlying price movement (Delta)
2. IV changes (Vega)
3. Time decay (Theta)
4. Liquidity
5. Market sentiment
6. Hedge adjustments by institutions
Understanding these micro-dynamics helps you avoid false breakouts.

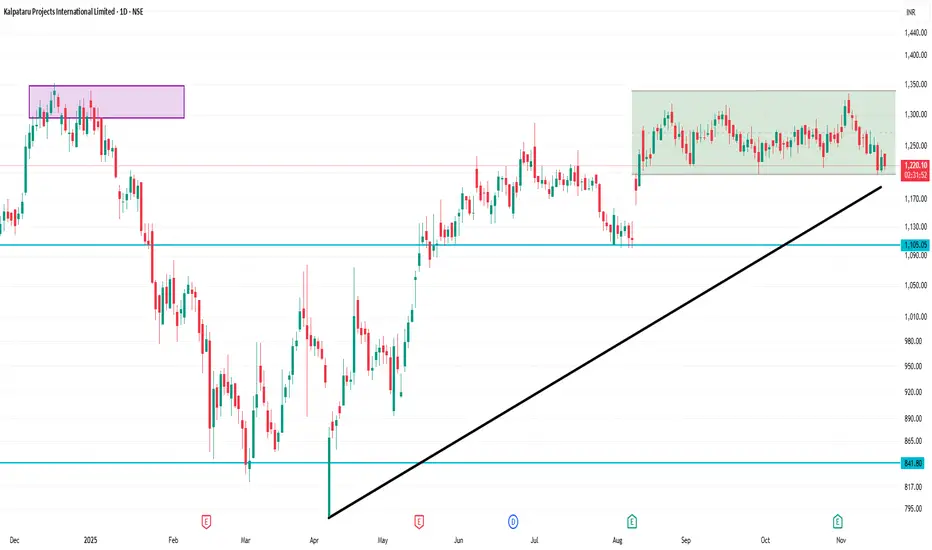
KPIL 1 Day Time Frame 📊 Current Price
Last traded around ₹1,226.90 (as of about 11:58 AM IST on 20 Nov 2025) on NSE.
Day’s low ≈ ₹1,213.10, day’s high ≈ ₹1,239.30.
52-week range: Low ~ ₹786.30, High ~ ₹1,352.85.
✅ Interpretation & Notes
The stock is hovering near the ~₹1,225 level — which is near the 100-day MA, so it’s at a kind of technical crossroads.
With the price range for the day being relatively narrow (~₹1,213 to ~₹1,239), it suggests limited intraday volatility so far.
The gap between recent price and 52-week high (~₹1,352) indicates potential upside but that will depend on catalyst and momentum.
However, if the stock fails to hold above the ~₹1,200 support zone, it could drift toward weaker levels.
Advanced Hedging Techniques1. What Makes Hedging “Advanced”?
Basic hedging uses straightforward tools like:
Buying puts to protect long positions
Selling futures against a portfolio
Using simple covered calls
Advanced hedging goes several steps deeper, using:
Multi-leg derivatives
Volatility-based adjustments
Dynamic delta/gamma balancing
Cross-asset risk offsets
Market-structure aligned protection
Time decay and IV crush advantage
Partial, rolling, and ratio hedging
The idea is simple: Instead of eliminating risk completely, advanced hedging balances risk and return to improve profitability over time.
2. Dynamic Delta Hedging
One of the core concepts in advanced hedging is delta hedging, primarily used by option writers, institutions, and algorithmic traders.
How it works:
Every option has delta, which measures how much the option’s price moves relative to the underlying.
A trader continuously adjusts futures or stock positions to keep the overall delta close to zero.
For example:
You sell a call option with delta +0.4
To hedge, you short 40 shares (or equivalent futures)
As the market moves, delta changes, so you rebalance (buy/short) to stay delta-neutral.
Why it’s advanced:
Requires constant monitoring
Involves forecasting volatility shifts
Needs strong understanding of Greeks
Delta hedging is the backbone of market-neutral strategies, used heavily by HFTs, prop desks, and market makers.
3. Gamma Scalping
Gamma scalping is an advanced extension of delta hedging.
Key idea:
When you buy options, you gain positive gamma.
Positive gamma lets you profit from intraday price swings, provided you adjust delta actively.
Example:
You buy a straddle (long gamma).
When market moves up, you sell futures at higher price.
When market dips, you buy futures at lower price.
Even if the option decays, this scalping around volatility can outperform theta loss.
Why advanced?
Requires rapid execution and discipline
Depends on volatility forecasts and market structure
Works best in high VIX environments
Many algorithmic strategies use gamma scalping to capture volatility spikes.
4. Ratio Hedging
Instead of a 1:1 hedge, advanced traders use ratio hedging to reduce cost and maximize coverage efficiency.
Example
You hold:
100 shares of a stock
Instead of buying 1 put, you buy:
0.75 puts (3/4th hedge) to reduce premium cost
Or in F&O:
You hedge an equity portfolio with Nifty futures at 0.7 ratio
This covers systemic risk while leaving room for upside.
Why it’s useful:
Cheaper than full hedging
Maintains bullish bias
Helps outperform in rising markets
Professional hedgers rarely hedge 100%—they target optimal hedge ratio, statistically between 0.5 to 0.8.
5. Calendar (Time-Based) Hedging
This technique uses different expiry cycles to hedge positions.
Example
Long monthly futures
Short weekly futures
Or long far-month options and short near-month options
This helps exploit:
Time decay differences
Volatility mispricing
Event-driven risk (Budget, RBI policy, earnings)
Effectiveness:
Calendar hedging allows traders to create income from theta while keeping long-term directional protection.
6. Volatility Hedging (Vega Hedging)
For traders dealing with events like:
Elections
Monetary policy
Global uncertainty
Result season
Volatility hedging becomes essential.
How Vega hedging works:
You neutralize exposure to changes in implied volatility.
Example:
Short straddle = short vega
To hedge, you buy options with similar vega but different strikes or expiries
Or use VIX futures to counter volatility spikes
Why advanced?
Vega moves are unpredictable and can explode during sudden news. Vega hedging is crucial for premium sellers.
7. Cross-Asset Hedging
Institutions and advanced traders hedge positions using different but correlated assets.
Examples:
Hedge HDFC Bank equity risk using Bank Nifty futures
Hedge crude oil exposure with USDINR (as crude affects currency)
Hedge Nifty positions with SGX/GIFT Nifty
Hedge IT stocks using Nasdaq futures
Hedge gold with USD or 10-year bond yields
Why it works:
Market correlations are powerful, especially in globalized trading.
Cross-asset hedging reduces:
Volatility shock
Black swan impact
Sectoral divergence
8. Protective Options Structures
Instead of buying simple puts, advanced traders use multi-leg structures to reduce cost and improve payoff.
a) Collar Hedge
Long stock
Long put
Short call
Reduces cost of put = low-cost downside protection.
b) Put Spread Hedge
Buy ATM put
Sell OTM put
Lower cost than outright put, ideal for event hedging.
c) Synthetic Futures
Long call + short put
or
Short call + long put
Used to replicate or hedge futures efficiently.
d) Risk Reversal
Sell OTM call
Buy OTM put
Used extensively by institutions during bearish phases.
These structures protect against downside while keeping cost manageable.
9. Tail-Risk Hedging
Tail-risk hedging protects against rare, unexpected, but massive crashes (e.g., COVID crash, 2008, sudden geopolitical tension).
Popular tools:
Deep OTM puts
VIX futures / options
Long strangles on low IV days
Black Swan hedges (long gamma long vega)
Though expensive, tail hedging saves portfolios during extreme volatility.
10. AI-Driven Hedging Models
Modern hedging integrates machine learning for:
Volatility prediction
Correlation breakdown detection
Regime identification
Market-structure shifts
Auto delta/gamma adjustments
AI-based hedging can:
Reduce reaction time
Improve precision
Adjust dynamically to liquidity
Detect early signs of volatility expansion
This is used heavily by institutional options desks and large quant funds.
11. Market-Structure Based Hedging
Advanced traders hedge based on:
Liquidity zones
POC levels
Volume profile
VWAP zones
Break of structure (BoS)
Premium/discount zones
For example:
Hedging when price approaches a high-volume node
Hedging intraday longs near previous day high liquidity traps
Scaling hedges based on market structure weakness
This creates context-based hedging, not blind hedging.
12. Rolling Hedges
Instead of static positions, advanced traders roll hedges:
To next strike
Next expiry
Different ratio
Different structure
Rolling helps:
Lock profits on hedges
Reduce premium cost
Maintain continuous risk protection
Adjust to trend changes
Example:
Your protective put becomes profitable after a fall
→ Roll down and capture gains while maintaining coverage.
Conclusion
Advanced hedging is not about eliminating risk—it’s about controlling it intelligently. From delta-gamma management to cross-asset protection, option structures to AI-driven adjustments, the goal is simple: survive volatility, protect capital, and ensure consistent profitability.
Unlock Stock Market Gains1. The Foundation: Market Structure Is Everything
Before trying to earn profits, a trader must understand how markets move.
Market structure shows the journey of price through phases—accumulation, markup, distribution, and markdown.
1. Accumulation Phase
Institutions slowly build positions at discounted prices.
Volume is low but stable.
Retail traders usually ignore this zone because nothing exciting happens.
Signs:
Tight range movements
Higher lows on volume spikes
Long consolidation after a fall
This is where smart traders quietly prepare.
2. Markup Phase
A strong breakout happens as demand increases.
Prices rise faster than before.
Signs:
Breakout above resistance
Volume expansion
Strong bullish candles
This is the best phase for trend traders.
3. Distribution Phase
Institutions start selling while retail investors keep buying.
Signs:
Flat top structure
Divergence in volume
High volatility
Many retail traders get trapped here, believing the trend will never end.
4. Markdown Phase
Strong downtrend begins after supply overwhelms demand.
Signs:
Breakdown of support
Series of lower highs
Panic selling
To unlock gains, a trader must learn:
Buy during accumulation and early markup
Exit during distribution
Avoid trading during markdown (unless shorting)
This alone can transform trading performance.
2. Volume Profile: The Secret Tool for Spotting Smart Money
Volume Profile shows where big players are interested—not just how much they buy, but at which price they build positions.
Key levels:
1. Value Area High (VAH)
Upper boundary of heavy-volume zone.
Price above VAH = breakout potential.
Price below VAH = selling pressure.
2. Value Area Low (VAL)
Lower boundary of heavy-interest zone.
Price bouncing from VAL often triggers rallies.
3. Point of Control (POC)
The single most traded price level.
Acts like a magnet—price often revisits it.
Volume Profile tells you:
Where institutions accumulate
Where stop losses of retailers sit
Where breakouts have real conviction
Mastering volume adds huge clarity to entries and exits.
3. Sector Leadership: The Engine Behind Big Market Moves
Stock market gains come fastest when you ride the strongest sectors.
Every market cycle has sector rotation:
When the economy expands → Banks, Autos, Capital Goods rise
When global liquidity improves → IT, Pharma, FMCG move
When government spending rises → Infra, Defence, PSU stocks rally
When risk appetite increases → Smallcaps, Midcaps explode
To unlock gains, always ask:
Which sector is leading right now?
If Bank Nifty is strong, choose financial stocks.
If Nifty Metal is strong, choose steel/aluminum stocks.
If Nifty IT is strong, choose large-cap tech stocks.
Following sector momentum gives you:
Faster returns
Stronger trends
Higher breakout success rate
4. Institutional Behavior: Follow the Big Money
Retailers react to news.
Institutions plan months ahead.
The stock market moves according to:
FII flows (Foreign Institutional Investors)
DII flows (Domestic institutions & mutual funds)
Proprietary desk positions
HNI activity
When big money enters a stock:
Breakouts become cleaner
Trends sustain longer
Pullbacks are shallow
You unlock gains by aligning with big investors, not fighting them.
How to track this?
Look at volume during breakouts
Observe bulk deals and block deals
Track FII and DII daily inflow/outflow
Watch open interest built during consolidation
This creates confidence in your trades.
5. Chart Patterns & Candlestick Mastery: Timing Your Entries Perfectly
A trader with poor entries struggles even in trending markets.
A trader with perfect entries can outperform even in sideways markets.
The best patterns for unlocking gains are:
Cup and Handle
Bull Flag
Ascending Triangle
Double Bottom
Rounding Bottom
Breakout + Retest
Candles that strengthen your confidence:
Bullish Engulfing
Hammer
Marubozu
Inside Bar breakout
Doji at support
Patterns + volume = high conviction trades.
6. Risk Management: The Real Key to Unlocking Gains
Most traders lose money not because of bad trades, but because of:
Oversized positions
No stop loss
Emotional trading
Chasing breakouts
Averaging down
Revenge trading
To consistently unlock gains:
Risk 1–2% of capital per trade
Use stop losses religiously
Maintain good risk-reward ratios (1:2 or 1:3)
Book profits partially on strength
Avoid trading during high-volatility events (Fed, RBI, Budget)
Without risk control, no strategy works.
7. Psychology: The Missing Piece in Most Traders’ Journey
The stock market tests emotions more than intelligence.
The top psychological rules:
Trade plans > Emotional reactions
Patience during consolidation
Discipline during entries
Zero attachment to stocks
No fear during breakout opportunities
No greed during profitable trades
A calm mind sees opportunities clearly.
A stressed mind sees risks everywhere.
8. Position Sizing & Capital Allocation: Multiply Gains Safely
Smart position sizing ensures long-term growth.
Allocation blueprint:
50% in strong trending stocks
20% in sector leaders
20% in high-risk high-reward smallcaps
10% in hedge or defensive stocks
Diversification protects you, but over-diversification kills gains.
Position sizing rules:
Add to winners, not losers
Pyramid only after confirmation
Scale out on signs of distribution
9. Following Market Sentiment & Global Cues
Modern markets are globally interconnected.
Sentiment drivers:
GIFT Nifty
US indices (Dow, Nasdaq, S&P 500)
Dollar index (DXY)
Crude oil prices
India VIX
Bond yields
Geopolitical news
Positive sentiment = higher accuracy in long trades.
Negative sentiment = better opportunities for short trades.
10. Building a Consistent Trading System
A profitable trader uses a structured approach:
Your system should include:
Setup – what pattern/structure you trade
Trigger – the exact candle or signal
Entry – breakout/POC bounce/sector strength
Stop Loss – technical, volatility-based, or structural
Target – R:R-based or trailing stop methodology
Exit signals – rejection, distribution, divergence
A consistent system = consistent gains.

GIFT NIFTY: INDIA’S GLOBAL FUTURES BENCHMARK1. What is GIFT Nifty?
GIFT Nifty is a futures contract based on the Nifty 50 Index, traded on NSE IX (NSE International Exchange) located in GIFT City (Gujarat International Finance Tec-City).
It allows global and Indian institutional investors to trade Indian index futures for nearly 21 hours a day. Previously, these contracts were traded in Singapore under the name SGX Nifty, which was one of the largest offshore derivative products linked to India.
In July 2023, SGX and NSE integrated their liquidity and migrated the contract to GIFT City, giving birth to GIFT Nifty. This made GIFT City the official global gateway for trading Nifty futures.
2. Why Was GIFT Nifty Created? (Background Story)
For many years, Indian index derivative trading was happening outside India through SGX Nifty, which traded in Singapore Exchange. Foreign investors widely used SGX Nifty to hedge Indian market exposure and take directional bets before Indian markets opened.
This led to:
Loss of trading volumes outside India
Loss of tax revenues
Limited control over trading data
Strategic disadvantage since India’s index was traded overseas
To resolve this, NSE International Exchange (NSE IX) in GIFT City collaborated with the Singapore Exchange (SGX). After a long process, liquidity was shifted from Singapore to India.
The result:
GIFT Nifty became the global benchmark gateway for international participation in Indian markets.
3. Where is GIFT Nifty Traded?
GIFT Nifty trades exclusively on:
NSE International Exchange (NSE IX)
located in
GIFT City – Gujarat International Finance Tec-City, India’s first global financial hub.
GIFT City provides:
Tax incentives
Global-standard regulatory environment
Ease of international clearing and settlement
USD-denominated trading
This transforms India into a preferred centre for offshore financial activities.
4. Trading Hours: Almost 21-Hour Trading Cycle
One of the biggest advantages of GIFT Nifty is its near-round-the-clock trading window, making it extremely attractive to global traders.
Trading Hours:
Session 1: 6:30 AM IST to 3:40 PM IST
Break: 3:40 PM–4:35 PM
Session 2: 4:35 PM IST to 2:45 AM IST (next day)
These extended hours allow:
European market overlap
US market overlap
Asian market overlap
Thus, GIFT Nifty reacts instantly to global events such as US inflation data, FOMC meetings, geopolitical events, Fed rate changes, or macroeconomic news.
5. Types of GIFT Nifty Contracts
Currently, GIFT Nifty offers four key futures contracts:
GIFT Nifty 50 Futures
— Based on India’s benchmark Nifty 50.
GIFT Nifty Bank Futures
— Based on Nifty Bank Index, preferred by high-volume traders.
GIFT Nifty Financial Services Futures
— Tracks financial, banking, and NBFC stocks.
GIFT Nifty Midcap Select Futures
— Targets mid-cap performance.
These contracts allow global investors to trade multiple Indian market segments.
6. Why is GIFT Nifty Important for Global Investors?
A. Hedging Indian Market Exposure
Foreign institutions and hedge funds use GIFT Nifty to:
Protect portfolios
Manage currency risk
Adjust positions during global events
React when the Indian market is closed
This makes it a powerful risk management tool.
B. Pre-Market Signal for India
Like SGX Nifty earlier, GIFT Nifty acts as:
India’s opening indicator
because it trades before NSE opens at 9:15 AM.
Traders watch GIFT Nifty to predict:
Gap up or gap down opening
Market sentiment
Global reactions to overnight events
C. USD-Denominated Trading
GIFT Nifty trades in US Dollars, eliminating INR volatility risk for foreign traders.
D. Lower Transaction Costs and Tax Benefits
GIFT City offers incentives such as:
Tax exemptions
Reduced transaction charges
Global settlement infrastructure
This improves liquidity and encourages foreign participation.
7. Advantages of GIFT Nifty for India
A. Boosts India’s Global Financial Position
By hosting the world’s primary trading hub for Indian index futures, India:
Captures revenue
Gains global visibility
Strengthens its financial ecosystem
B. Increases Trading Volumes
Liquidity that once belonged to Singapore has now moved to India.
GIFT Nifty is already seeing rising:
Participation
Volumes
Institutional activity
High-frequency trading (HFT)
C. Helps Build GIFT City as Global Hub
GIFT City aims to become:
India’s version of Dubai IFC
A global financial and tech ecosystem
A zone free from heavy domestic regulations
GIFT Nifty is its flagship achievement.
8. Impact on Indian Retail Traders
Even though GIFT Nifty is designed mainly for global players, Indian retail traders benefit indirectly:
A. Stronger Pre-Market Analysis
GIFT Nifty offers reliable cues for:
Market opening
Overnight sentiment
Global macro impact
This helps traders prepare strategies before NSE opens.
B. Better Volatility Understanding
Since GIFT Nifty reacts to global data instantly, it signals:
How big events may move Nifty
Expected risk levels
Next-day volatility zones
C. Improved Liquidity in Main Nifty Contracts
With global volumes migrating to GIFT Nifty, institutional hedging becomes more efficient, indirectly supporting NSE liquidity.
9. Comparison: GIFT Nifty vs SGX Nifty
Feature SGX Nifty GIFT Nifty
Location Singapore GIFT City, India
Currency USD USD
Trading Hours ~16 hours 21 hours
Settlement SGX NSE IX
Liquidity Earlier highest Now shifted to GIFT
Regulatory Foreign Indian global zone
Result: GIFT Nifty is now the official global benchmark for Nifty futures.
10. Role in Global Financial Markets
GIFT Nifty plays a significant role in the global market ecosystem:
Helps global funds include India in their derivatives portfolios
Enhances India’s market visibility
Acts as a hedge instrument for emerging markets exposure
Allows cross-border arbitrage strategies
As India rises economically, GIFT Nifty strengthens its position in global finance.
11. Future Growth Potential
GIFT Nifty is expected to grow due to:
Increasing foreign portfolio investment (FPI)
India’s rising GDP ranking
More indices being added (IT, Auto, FMCG, etc.)
Growing participation from global institutions
GIFT City plans to add:
Options contracts
More currency derivatives
More global settlement links
This will convert GIFT City into a global derivatives powerhouse.
Conclusion
GIFT Nifty is more than just a futures contract—it represents India’s emergence as a global financial centre. By shifting index derivative trading from Singapore to GIFT City, India has strengthened control over its markets, increased participation, expanded trading hours, and built a powerful financial ecosystem aligned with international standards.
For traders, GIFT Nifty remains a crucial indicator of market sentiment. For institutions, it is an efficient hedging and speculative tool. For India, it is a milestone showcasing financial modernization and global ambition.

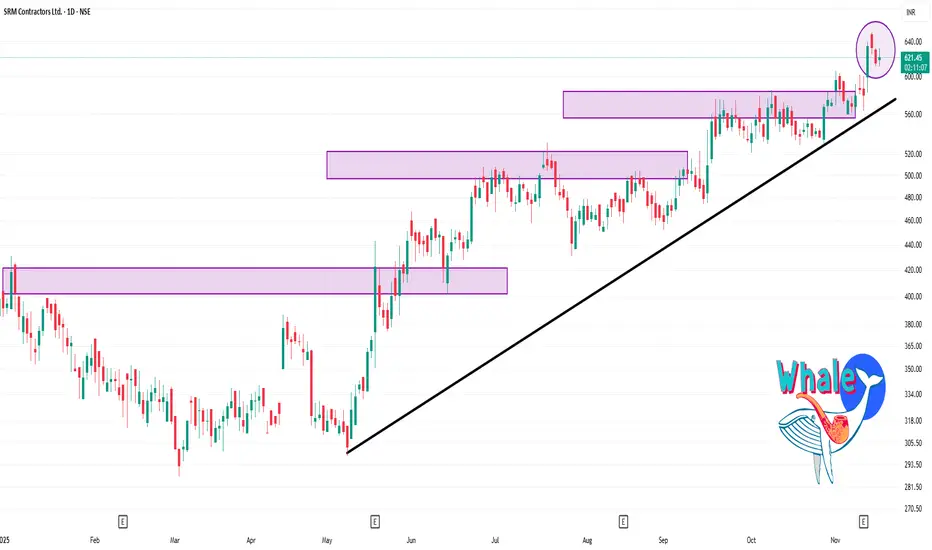
SRM 1 Day Time Frame 🔍 Key Levels (Daily Pivot / Support / Resistance)
Based on classic pivot calculations from recent prices:
Pivot: ~ ₹626.4 approx.
Resistance Zones:
R1 ~ ₹636.8
R2 ~ ₹645.3
R3 ~ ~ ₹655.7
Support Zones:
S1 ~ ₹617.99
S2 ~ ~ ₹607.6
S3 ~ ~ ₹599.1
🎯 My Short-Term View
Bullish setup: If the stock holds above the pivot ~₹626 and the support zone near ~₹617-620, it has room to test ~₹636-645 and potentially ~₹655.
Risk / caution area: If price drops back below ₹617-620 convincingly, then support near ~₹607-600 becomes important.
Ideal buy: A pull-back to the ~₹620 region with confirmation (volume/support) could offer a good risk/reward. Alternatively, a breakout above ~₹645 with strong volume could trigger further upside.
Stop / risk control idea: For a long trade, one could consider a stop below ~₹600-607 depending on risk tolerance.
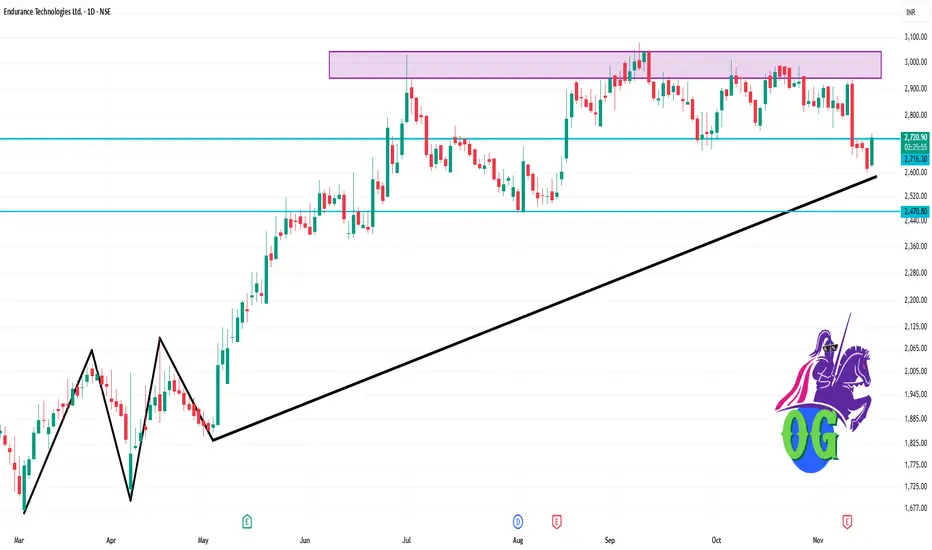
ENDURANCE 1 Day Time Frame 📌 Key Price Data
Last traded price: ~ ₹2,720.50 (as of 19 Nov 2025, ~11:57 AM IST)
Day’s high ~ ₹2,729.90, day’s low ~ ₹2,616.10
Previous close: ~ ₹2,615.10
📉 Daily Support & Resistance Zones
Based on the intraday range and recent levels:
Immediate support zone: ~ ₹2,620 – ₹2,650 (just above the day’s low)
Second support: ~ ₹2,580 – ₹2,600 (below current trading, potential break level)
Immediate resistance zone: ~ ₹2,730 – ₹2,760 (near day’s high)
Higher resistance: ~ ₹2,900 – ₹3,000+ (a more medium-term zone)
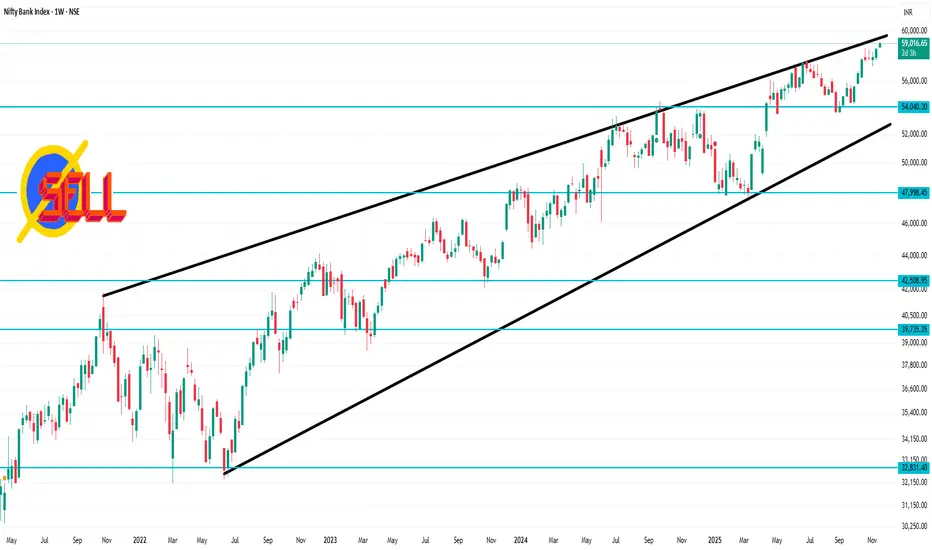
Bank Nifty 1 Week Time Frame🔍 Current snapshot
The index is trading around ~ 58,900-59,000 points.
It recently hit a fresh all-time high of around 59,100 points in recent sessions.
The structure shows it is near upper-resistance territory and signs of short-term exhaustion appear.
✅ Key Weekly Time-Frame Levels
Resistance zones
~ 59,100 – 59,300 points: This is the immediate upper resistance (recent ATH level) which bulls need to clear for a fresh leg up.
On a breakout above ~59,300, the next psychological target zone might be ~59,500-60,000+.
Support zones
~ 58,600 – 58,300 points: A key near-term support zone. Breakdown below ~58,800 may trigger weakness toward this zone.
A stronger support below that is around ~ 57,500 – 57,200 points, which becomes relevant if heavy selling or structural break occurs.
Candle Patterns 1. Buyers
Push price upward
Create green candles
Long wicks show rejection of low prices
2. Sellers
Push price downward
Create red candles
Long top wicks indicate weakening buying strength
3. Indecision
Appears in dojis and spinning tops
Market is waiting for direction
4. Reversals
Appear when buyers overpower sellers or vice-versa
Engulfing, hammer, shooting star signal possible turning points
5. Continuation
Patterns like Rising Three Methods show temporary rest before trend resumes

Basics of MCX Trading1. What is MCX?
MCX is a regulated commodity exchange established in 2003 and is supervised by the Securities and Exchange Board of India (SEBI). Its main role is to provide a secure and transparent platform where commodity derivatives are traded. Unlike the stock market, where shares of companies are traded, MCX deals with commodities in financial form—mostly through futures and options contracts rather than physical goods.
MCX provides:
Real-time price data
Clearing and settlement services
Risk management systems
Standardized contracts
2. What Are Commodity Derivatives?
Commodity derivatives are financial instruments whose value depends on the price of an underlying commodity. On MCX, the two main derivatives are:
a) Futures Contracts
A futures contract is an agreement to buy or sell a commodity at a predetermined price on a specific future date. However, most MCX futures are not held until expiry; traders usually square off positions earlier to book profit or cut loss.
b) Options Contracts
In MCX options, the buyer pays a premium to obtain the right, but not the obligation, to buy or sell the commodity futures contract. Options help traders manage risk with controlled loss.
3. Common Commodities Traded on MCX
MCX offers a wide range of commodities across different sectors:
Bullions
Gold
Silver
Energy
Crude Oil
Natural Gas
Base Metals
Copper
Zinc
Lead
Nickel
Aluminum
Agricultural Commodities
Cotton
Crude Palm Oil (CPO)
Mentha Oil (sometimes available)
These commodities are offered in different contract sizes, such as:
Gold (1 kg)
Gold Mini (100 grams)
Silver (5 kg)
Crude Oil (100 barrels)
Natural Gas (1,250 mmBtu)
Mini versions for smaller traders
4. How MCX Trading Works
MCX trading functions just like stock trading, but there are some key differences due to the nature of commodities.
(1) Trading Hours
MCX operates longer hours compared to stock exchanges:
Monday to Friday
9:00 AM to 11:30 PM (or 11:55 PM depending on US daylight saving)
This allows Indian traders to align energy and metal prices with global commodity markets.
5. Margin System in MCX
To trade on MCX, traders must deposit an initial margin—a percentage of the contract value. This makes MCX trading highly leveraged.
Types of Margin:
Initial Margin
Required to open a position.
Exposure Margin
Charged to cover additional volatility risk.
MTM (Mark-to-Market) Margin
Daily profit or loss adjustment to maintain position.
Span Margin
Calculated using SPAN software based on risk.
Because of leverage, traders can control large commodity positions with relatively small capital, but risk also increases.
6. Lot Size and Tick Size
Every MCX contract has:
a) Lot Size
The fixed quantity of commodity in each contract.
Example:
Crude Oil: 100 barrels
Gold Mini: 100 grams
b) Tick Size
The minimum price movement allowed.
Example:
Gold: ₹1 per 10 grams
Crude Oil: ₹1 per barrel
Understanding these is important for calculating profits and stop-loss levels.
7. Settlement Mechanism
MCX contracts typically settle in two ways:
a) Cash Settlement
Most contracts, especially energy and metals, are settled in cash based on final settlement prices.
b) Physical Delivery
Some contracts (like gold and silver) allow physical delivery if the position is held until expiry. Retail traders generally square off positions before expiry to avoid delivery obligations.
8. Key Participants in MCX
Hedgers
Businesses like jewelers or oil companies hedge against price risk.
Speculators
Traders who aim to profit from price movements.
Arbitrageurs
Exploit price differences between markets.
Speculators form the majority, and they contribute to liquidity.
9. Factors Influencing MCX Prices
Commodity prices depend on global and domestic factors. Major ones include:
a) Global Market Prices
MCX follows international commodity price trends (like NYMEX for crude oil and COMEX for gold).
b) USD/INR Exchange Rate
A weaker rupee increases commodity prices in India.
c) Demand and Supply
Economic cycles, industrial demand, and agricultural output affect prices.
d) Geopolitical Events
Wars, sanctions, and oil-exporting countries’ decisions impact energy prices.
e) Inventory Data
Weekly crude oil inventory reports from the US influence energy markets.
10. Types of MCX Trading
MCX traders use different trading styles depending on their experience:
1. Intraday Trading
Squaring off positions within the same day.
High volume
Quick profits (and losses)
Needs charts and indicators
2. Swing Trading
Holding positions for a few days.
Based on trend-following strategies
Lower stress compared to intraday
3. Positional Trading
Long-term holding until contract expiry or for weeks.
Based on macroeconomic factors
11. Tools and Charts for MCX Trading
Successful MCX trading requires studying:
Technical Analysis Tools
Candlestick patterns
Moving averages (MA)
RSI (Relative Strength Index)
MACD
Bollinger Bands
Support & Resistance
Fundamental Analysis
Global market trends
Economic releases
Inventory reports (for crude & natural gas)
MCX traders often combine both analyses for accuracy.
12. Risks in MCX Trading
While MCX offers high profit potential, the risks are equally high:
High Volatility
Energy markets like crude oil move rapidly.
Leverage Risk
Small capital can lead to big losses.
Global News Impact
Prices react instantly to global events.
Over-trading
Beginners often trade too frequently.
Proper stop-loss and risk management are essential.
13. Benefits of MCX Trading
High liquidity
Transparent and regulated market
Low capital requirement due to margin system
Hedging opportunities
Long trading hours
Conclusion
MCX trading is a dynamic and exciting arena where traders can participate in global commodity markets right from India. Whether you trade gold, crude oil, or base metals, understanding the basics—such as contract types, margins, lot sizes, market hours, and global price influences—is crucial to becoming a successful trader. With proper analysis, discipline, and risk management, MCX offers significant opportunities for profit and portfolio diversification.
Part 9 Trading Master Class with Experts In-the-Money, At-the-Money, Out-of-the-Money
Call Options
ITM: Market price > strike
ATM: Market price ≈ strike
OTM: Market price < strike
Put Options
ITM: Market price < strike
ATM: Market price ≈ strike
OTM: Market price > strike
OTM options are cheap but risky.
ITM options are safer but cost more.

Part 6 Learn Institutional Trading Why Trade Options?
Options are extremely popular because they offer:
1. Leverage
You can control a large position using a small amount of money (the premium).
Example: Buying a stock may cost ₹1,00,000, but a call option may cost only ₹3,000.
2. Hedging
Investors use options to protect their portfolios from losses during market corrections.
3. Income Generation
Option sellers generate regular income through premium collection strategies.
4. Flexibility
You can build strategies that make money in rising, falling, or sideways markets.

Part 3 Learn Institutional Trading What Are Options?
Options are derivative contracts, meaning their value is derived from an underlying asset. The underlying asset may be stocks, indices, commodities, currencies, ETFs, or even cryptocurrencies.
There are two main types of options:
Call Option – Gives the buyer the right, but not the obligation, to buy the underlying asset at a specific price before a specific date.
Put Option – Gives the buyer the right, but not the obligation, to sell the underlying asset at a specific price before a specific date.
The specific price is called the strike price, and the last day the contract is valid is the expiry date.

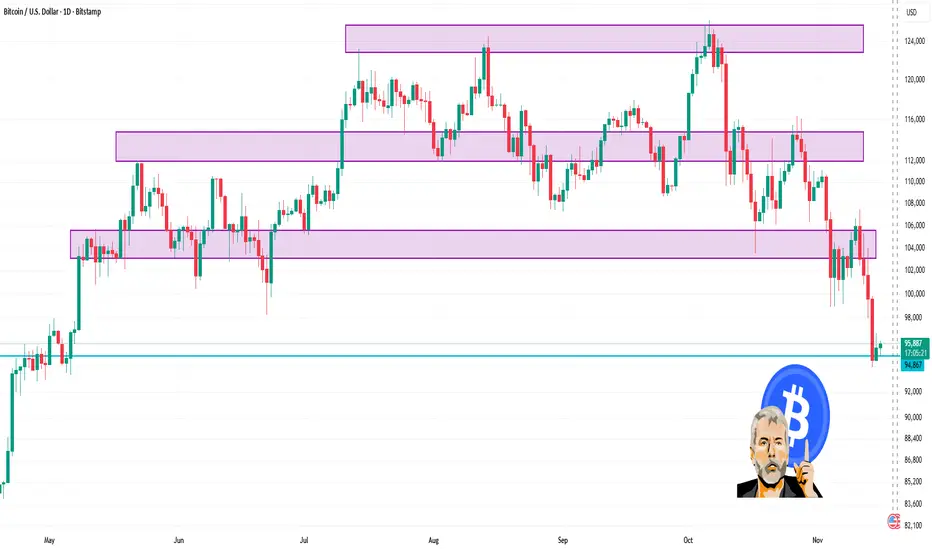
BTC 1 Day Time Frame 🔍 Price snapshot:
1. It’s trading in the vicinity of ~US$95,900 (as per latest data) per coin.
2. Daily range (roughly) sits between ~US$94,800 and ~US$96,400 (depending on source).
3. Technical summary on the daily timeframe is leaning toward a “Strong Sell / Sell” bias per one analytics page.
📌 Key levels to watch (daily chart):
1. Support zone: Around the US$94,000–95,000 area (recent lows)
2. Resistance zone: Around the US$100,000 + region (psychological + prior highs)
3. Because the data shows price trading below ~US$100,000 and bouncing near US$95,000, the latter areas act as important anchors.
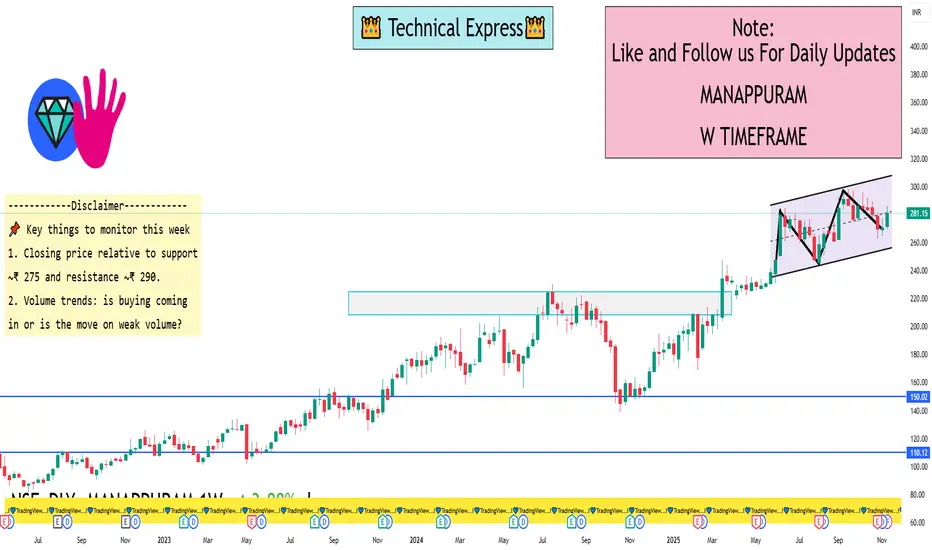
MANAPPURAM 1 Week View✅ Current state & context
The stock is trading around ₹ 281.15 as of 14 Nov 2025.
Recent technical scan shows a “Buy” to “Strong Buy” rating in the 1-week horizon via trading-view style indicators.
From the weekly performance note: the 20-day moving average crossover appeared recently, which historically has seen a ~3.9% average gain in ~7 days (on this stock) when that signal appears.
On the fundamental side, the stock is trading at relatively high valuations (P/E ~ 50+ times) and has seen significant price appreciation in recent months.
🎯 Key support & resistance levels for the next week
From the recent price action and technical indicators:
Support zones to watch
Near the recent swing low / consolidation area around ₹ 270-275. If price pulls back, this zone could act as first buffer.
Next deeper support around ₹ 260-265, which might catch if a stronger correction shows up.
Resistance zones to watch
Immediate resistance around the recent high ~ ₹ 290-295 (given the 52-week high is ~₹ 298).
If momentum continues, a break above ~₹ 300 might open further upside, but that would require strong volume and favourable catalyst.
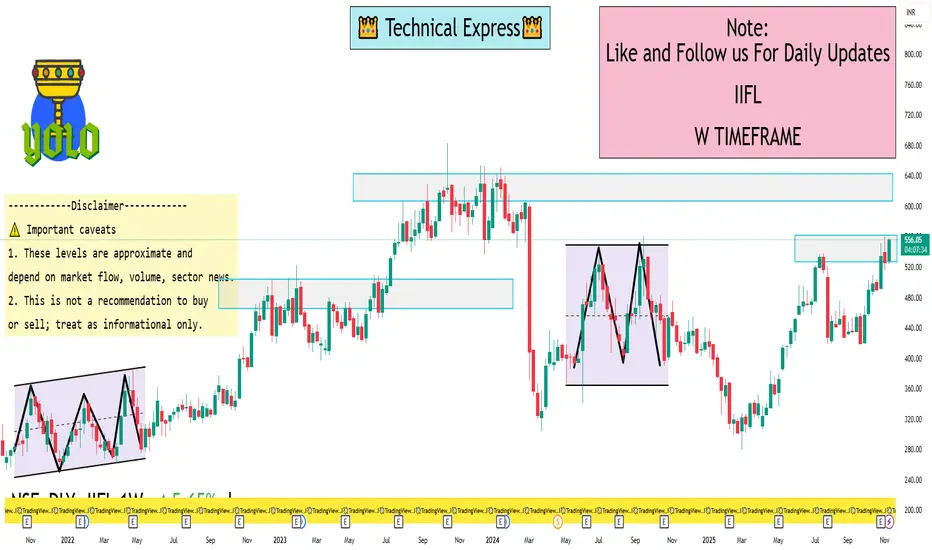
IIFL 1 Week View📊 Current snapshot
Last quoted price: approx ₹540.75 (as of 11 Nov 2025).
1-week return: ~ +0.09%.
52-week high / low: ~ ₹559.75 / ~ ₹279.80.
🔍 1-Week level view
Given the current price and recent behaviour, here are some approximate support/resistance zones for the coming week:
Support zone: around ₹ 520-530. (if price dips, this may be an area where buyers step in)
Resistance zone: around ₹ 555-560. (near the recent high end of the range)
Neutral range: ~₹ 530-550 — staying in this band if no strong momentum emerges.
Upside breakout scenario: if it convincingly breaks above ~₹ 560, the next target may be ~₹ 570-580.
Downside break scenario: if it falls below ~₹ 520, it could test ~₹ 500 or lower in the short term.
⚠️ Important caveats
These levels are approximate and depend on market flow, volume, sector news.
This is not a recommendation to buy or sell; treat as informational only.
NBFC stocks like IIFL can be sensitive to credit/regulation news, which can quickly shift the technicals.
The “1-week” view means the horizon is short; volatility could cause levels to be breached.
Part 8 Trading Master Class With ExpertsRisks in Option Trading
While options offer great potential, they also come with risks, especially for sellers.
Time Decay: The value of an option decreases as it nears expiry.
Volatility Risk: Unexpected drops in volatility can reduce premium value.
Unlimited Loss (for Writers): Option sellers can face huge losses if the market moves sharply against them.
Complexity: Understanding option behavior and Greeks requires knowledge and experience.
Therefore, beginners should start small and practice on demo accounts or low-risk strategies before committing large capital.
