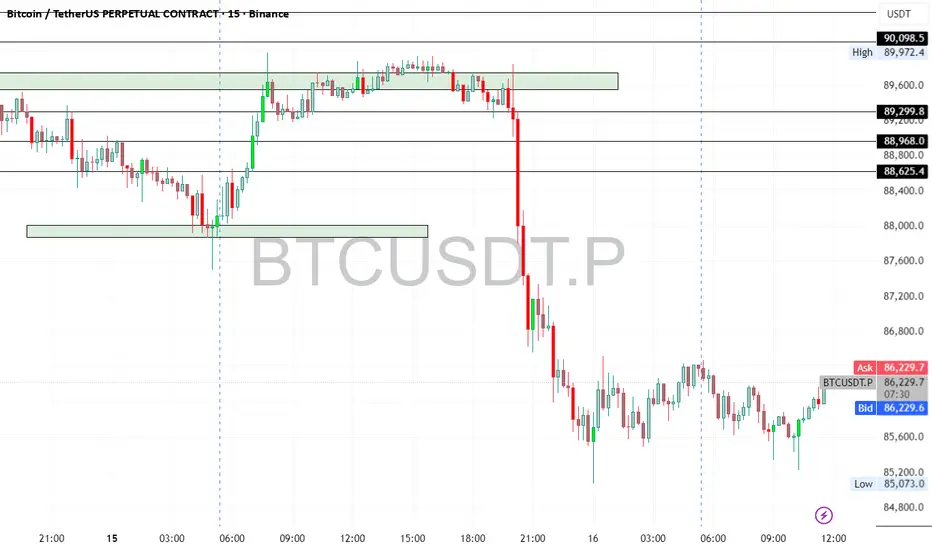
Bitcoin UpdateBTC is down ~2% today but has recovered from the lows and is holding above key support at $86,180 — showing strong respect for the trendline.
Key Levels:
🟢 Support: $86,180 → if this breaks, next major support is $75,000
🔵 Resistance: ~$92,000
🟩 Major Resistance: ~$100,000
Positioning:
I remain long from $86.2K and plan to add near $75K if price drops.
Trend structure remains intact.
Tradesetup
What BTC has to offer now - Swing Trade opportunityBINANCE:BTCUSDT.P
DELTAIN:BTCUSD.P
BYBIT:BTCUSDT.P
BTC played our level perfectly giving about 8.5% return in three days
Now what can be done next - LETS DISCUSS
After touching our level 94000 which was a 0.5 retracement zone BTC is down 1500 points
I am expecting bearish momentum in the upcoming days
LOGIC - To sustain the upwards trend in the long term BTC has to test its 0.6 retracement zone in 1 month tf which is around 74700 level, I could be 100% wrong but the global environment is not so good which might act as a catalyst for the downwards momentum.
Leverage recommended 5x or below (Level based on Delta Exchange Chart)
Short at Current market price = 92600
Stop loss = 97600
Target 1 = 87500 (RR 1:1)
Target 2 = 80608 (RR 1:2.4)
Target 3 = 74700 (RR 1:3.6)
RR ratio = 1:3.6
Total point to capture = 17850
Stop loss point = 5050
Disclaimer: The content is for educational purposes and should not be considered a recommendation to buy or sell any security.

DRAGONFLY LTDDRAGONFLY INC, as per chart view it formed FALLING WEDGE PATTERN and made breakout with entry level $6.88 with EMA crossover. We can expect the Final target to $13.

DRAGONFLY INCDRAGONFLY INC, as per chart view it formed FALLING WEDGE PATTERN and made breakout with entry level $6.88 with EMA crossover. We can expect the Final target to $13.

Sensex INDEXSensex is in bearish trend
We can see strong RESISTANCE in between 84,800 & 85,000 range. If SENSEX breaksdown 84,800 level we can expect sensex at 84,600 and further down side till 83,100 level
Strong support regions are at 84,900, 84,500, and 83,950.
After reaching 84,600 we can expect retracement till 84,900 and if resistance was not taken then only it can move till 84,000 level
This is just my analysis to best of my knowledge

FLUENCE ENERGYFLUENCE ENERGY MADE DOUBLE BOTTOM with DIVERGENCE in monthly chart and also in process of forming CUP & HANDLE FORMATION, and it is at resistence level at $24, if it breaksout resistance at $24 we can expect to reach $30 & $44.
Chart analysis done on best of my knowledge, it may reach or may not reach targets :-)

KOTAKBANK – Strong Call Long Build-Up________________________________________________________________________________
📈 KOTAKBANK – Strong Call Long Build-Up Signals Possible Upside Attempt
🕒 Chart: 15-Min | 📆 July 8, 2025
________________________________________________________________________________
🔍 What’s Catching Our Eye:
Buyers are aggressively building positions in multiple Call strikes from ₹2200 to ₹2320, hinting at bullish sentiment returning.
________________________________________________________________________________📌 What We’re Watching For:
If price sustains above ₹2240–₹2241.5, we may see a move toward ₹2300+ in the short term.
________________________________________________________________________________📌 OI Inference:
Call side is witnessing Long Build-Up (2240–2320, even 2400 CE), while Put side is under Short Build-Up, showing Put sellers are confident the downside is limited.
________________________________________________________________________________🔁 Trend Bias:
🟢 Bullish to Range-Bound – as long as price holds above ₹2200 with rising Call OI and falling PE premiums.
________________________________________________________________________________🧠 Trade Logic / Reasoning:
• Major Call strikes like 2240, 2260, 2300 under Long Build-Up
• 2200 CE shows Short Covering – a sign of prior bearish positions being exited
• Puts are mostly under Short Build-Up = downside cushion building
• Volatility is low = option buyers betting on directional breakout
________________________________________________________________________________📍 Important Levels to Mark:
🔺 Top Range (Resistance): ₹2241.5
🔻 Bottom Range (Support): ₹2111
🟢 Demand Zone: NA
🔴 Supply Zone: NA
________________________________________________________________________________🎯 Trade Plan (Educational Purpose Only):
✅ Buy (Equity): Above ₹2241.5 with strength and follow-through
✅ Sell (Equity): Only below ₹2200 if fresh PE Long Build-Up appears
✅ Best CE to Buy: ₹2240 CE or ₹2260 CE if price sustains above ₹2240
❌ Avoid Put Buying: Most Put options are under Short Build-Up (bearish bets getting closed)
📌 Strategy Idea (Low Risk):
Bull Call Spread – Buy ₹2240 CE, Sell ₹2300 CE
→ Works well if stock rises, and risk stays limited
________________________________________________________________________________⚠️ Invalidation Levels:
🔻 Below ₹2200 = Long view weakens
🔺 Above ₹2241.5 = bullish breakout confirmed
________________________________________________________________________________
⚠️ Disclaimer:
This is only for educational purposes.
STWP is not a SEBI-registered advisor.
Please consult a financial advisor before making trades.
STWP is not responsible for any trading decisions based on this content.
________________________________________________________________________________
💬 Will KOTAKBANK break out above ₹2240 or stay stuck?
⬇️ Share your view in the comments!
🔁 Repost this if you’re tracking the zone
✅ Follow STWP for clean Options + Price Action setups
🚀 Let’s trade with clarity and confidence!
________________________________________________________________________________

Solana 4H Swing Long Entry Setup - Solana is currently trading at 128.8$
- Solana is trying to shift its market structure to bullish, and this will be confirmed once we see a flip above 136-139$
- Solana on a 4H TF is trying to build a consolidation base which should eventually lead to a larger expansion
- Solana and the whole crypto market is currently waiting for a bullish catalyst in order to move higher
- We have 4 central banks speaking this week all eyes on what Jerome Powell will comment and this will dictate the price action for the upcoming weeks.
- Manage risk properly and don't over risk

Mastering the Head & Shoulders Pattern: A Powerful Chart PatternHello Traders!
Today, we’ll be diving into one of the most powerful chart patterns — the Head & Shoulder Pattern . It’s widely used by traders to spot trend reversals, particularly from bullish to bearish trends. If you’re looking to refine your technical analysis, understanding this pattern will significantly boost your trading edge.
Understanding the Head & Shoulder Pattern
The Head & Shoulders pattern consists of three peaks: the Left Shoulder , the Head (the highest peak), and the Right Shoulder . It indicates a trend reversal , usually occurring after a strong uptrend.
Left Shoulder : The price rises to a peak, then declines.
Head : The price rises higher, forming the highest peak, before pulling back again.
Right Shoulder : The price rises again but fails to reach the height of the Head , followed by a decline.
Key Elements for Confirmation:
Neckline : A key support level formed by connecting the lows of the left shoulder and right shoulder.
Breakout : Once the price breaks below the Neckline , the pattern is considered complete, signaling a potential sell-off.
Trade Setup Based on Head & Shoulders:
Entry Point : Enter a trade when the price breaks below the Neckline , confirming the pattern’s completion.
Stop Loss : Place your stop loss just above the Right Shoulder to limit risk.
Targets : Measure the distance from the Head to the Neckline and project it downward from the point of breakout for the target levels.
Example: Nifty 50 Head & Shoulder Pattern
In the chart, we can see the Nifty 50 forming a Head & Shoulders pattern . After the breakdown below the Neckline , the target levels are identified on chart please follow same if you see this chart pattern anywhere, indicating a potential move downward.
Why is This Pattern Effective?
The Head & Shoulders is highly regarded because of its clear structure and reliability in predicting bearish reversals. It helps traders identify when the market is likely to turn, giving you the opportunity to enter trades at the right time.
Conclusion:
The Head & Shoulders pattern is a powerful tool for identifying trend reversals. When used with additional tools like volume analysis and support/resistance levels , it can enhance your trading decisions. Always remember to use a stop loss to protect your capital and consider multiple timeframes for confirmation.
Happy Trading! 😎📉

IPCA Lab Short IntradayIPCA is weak with volume. On critical price junction. We will wait for breakout for intraday shorts.
Trade Signal is 1503.4. Stock has taken support at this exact level multiple time.
Once break 1500 stock is weak and short trade get confirmation. We can keep target 1585-80
Once stock goes to 1590 we move our SL to 1501.
All levels are mentioned in stock.

GSPL - Gujarat State Petroleum Corporation Bullish ViewGSPL charts have formed a bullish engulfing candlestick pattern.
You can use this opportunity because it has a very good risk to reward ratio.
Entry: Long above ₹389.80 (the high of the bullish engulfing candle)
Stop-Loss: Short below ₹368 (the low of the bearish candlestick before the bullish engulfing pattern)
Take-Profit: This will depend on your risk tolerance and trading goals. based on a 1:2 or trailing basis 1:3 Risk to reward Ratio
Risk Management: Always remember to practice good risk management. Only risk a small percentage of your capital on each trade.
Disclaimer: This is not financial advice. Please do your own research before making any trading decisions.
Remember, trading involves risk. I can't guarantee that this trade will be successful.
Also dont forget to share and boost, thank you for all your love and keep supporting like you do, helps me work harder..

Banknifty should fly from here! Due to rate cut expectation #NIFTYBANK action pack analysis on banking sector..are you ready??
Tomorrow is monetory policy, so there is higher probability we can see rate cut as minimum 25 basis points, so i am expecting this news is gonna to be positive specially for banking and nbfc sector, so chances are high banknifty can give solid move towards 54000, atleast 700-1000 points move possible from current level, other side 53000 is really strong support zone for intraday closing, right now price has came down, but it will surely give close above to 53000 levels. For downside we have very strong support zone at 52575-52650 which can act like strong support zone for intraday in case if we see more dip from here. Overall tomorrow mpc news is highly positive for market.
I have a trade for that
take banknifty 54000ce now at 445 you can add more in case if you get some lower levels till 390
keep strict stop loss at 300
so overall we will have 145 points stop loss
for Targets we will keep at 560/675/900++
Disclaimer:- Please always do your own analysis or consult with your financial advisor before taking any kind of trades.
Dear traders, If you like my work then do not forget to hit like and follow me, and guy's let me know what do you think about this idea in comment box, i would be love to reply all of you guy's.

AAVE Swing Long Setup Idea For Crypto Bull Run- AAVE is currently trading at $171.
- As a leader in decentralized finance (DeFi), it’s important to position yourself conservatively to maximize your gains with AAVE.
- The price is currently consolidating and compressing near the inefficient gap, so pay attention to its behavior to learn from these repetitive patterns.
- Historically, the price has been rejected from the last swing high before entering a bearish trajectory; we have observed a similar rejection at the same point of interest (POI) recently.
- Now is the time to make conservative entries in the range of $160-$170 and hold for an increase up to $261.
- Recommended Accumulation Zones for Spot Entries: $156-$167.
- Bull Run Targets: $261, $447, $650.
- Timeframe: Hold this position for 2-3 months.

TATA CHEMICALS.... IN ACCUMULATION The stock price has been consolidating for quite some time.
Technically, by the Elliot wave pattern, the 5th wave is likely to begin, and one can expect about a 30 to 35% rally in this stock.
Safe entry will be above the resistance trendline, though the current level looks attractive for investment purposes.

NSE PNB is Preparing for a Corrective BreakoutTimeframe: Daily
NSE PNB is currently facing strong resistance at the 200 EMA on the daily timeframe. The price has completed a corrective W-X-Y formation on the daily chart, and the ATR has increased to 2.91.
The stock has reached the final wave V of C of (Y) at 103.62 and has started moving upward. If this marks the end of the correction, the price needs to break and sustain above wave iv at 112 . Upon holding above this level, traders can aim for targets of 117 – 126 – 137+. Even if the price falls below wave (Y), traders can only buy after the breakout of 112.
Stay tuned for further updates!

SUNTV | Head & shoulder + Cup & handle Trapping ⭕️ Swing Trading opportunity: Price Action Analysis Alert !!!⭕️
💡FNO Stocks Trading📉📈📊
✅Check out my TradingView profile to see how we analyze charts and execute trades.
✅We can't conduct a thorough analysis in such a short span of time. We need to review it, post our findings, and then take action.
🙋♀️🙋♂️If you have any questions about this stock, feel free to reach out to me.
📍📌Thank you for exploring our idea! We hope you found it valuable.
🙏FLLOW for more !
👍LIKE if useful !
✍️COMMENT Below your view !

AVANTI FEED Swing Long Setup - Avanti Feed is currently trading at 684
- Avanti feed recently made a high where we saw it moving up impulsively and it continued to rally for weeks
- Post the rally we saw prices taking healthy retracements and it's trying to form a small base now
- If you look at this small range a lot of scalpers might have got trapped with the wick shown as Sell Side Liquidity or if you look at the basic support which a lot of retailers consider
- Before looking for swings and positional plays make sure that you wait for the base to mature first and then take entries as of now try to learn and understand the price delivery
- I will post another update once I see this ready for an upside if it does before that I will scout another stock, till then trade safe manage risk and stay tuned

ASTERDM : Long position Monthly Trend - Up
Weekly Trend - Up
Daily trend - Up
Closing Price above SMA 200 - Yes
MACD Signal - Buying Cross over
Buying Zone - Yes
RSI - 64
Volume - Consolidated
Price near 20 EMA - Yes
Targets , Entry Point and Stop Loss as marked in the Chart.

SUN TV Swing Long Setup - Sun TV is currently trading at 825
- I am interested in this setup where I see a huge imbalance on the left and we have high probable chances of this moving up rapidly
- We have also purged the sell-side liquidity which trapped a lot of shorts
- Now we are all set to expand higher
- Watch out Sun Tv if you are looking for swings

NIFTY 1D Trade Analysis - Nifty is currently trading at 25,356
- Nifty has a FVG below and it might fill it before moving towards the upside more
- Nifty Oderblock is where my point of interest lies
- I will be looking to add longs and swing longs in stocks once I see Nifty approaching that level
- Till then let the trend fade away and get bearish if you are planning to switch your stance to bearish

CADCHF market seems sideways for few days
ALl chf pairs are showing same trade setup
If there is change of character then there is a probability that the cadchf can FALL
AFTER CORE CPI MARKET WILL START TO MOVE

XAUUSD : 07/25/24 first short and than long99% SUCCESSFUL TRADE.
FIRST TRADE:
SELL XAUUSD - profit upto $8USD
SECOND TRADE:
BUY at the bottom where you booked the profit and hold the position for the entire bullish price action.
Do your own analysis before taking a trade.
NOTE:
PRICES HAVE BEEN MARKED FOR YOUR REFERENCE. THIS IS WHAT I ANALYSE. PLEASE DO YOUR OWN ANALYSIS BEFORE TAKING A TRADE.

Bank Nifty 03/07/2024Scenario 1:
If Open Drive is Gap Up: If Price will test the Level @ 52420 to 52470.
The Price May Reject @ This level (52420 - 470) and Expected to Fall Till 51995 to 51838.
51838 Is the Major Support Level.
It is very Hard to price Break this level.
Scenario 2:
If Open Drive is Gap Down : If Price will test the Level @ 51995 to 51837.
The Price May Reject @ This level (51995 - 51837) and Expected to rally Till 52420.
