If Bitcoin Loses This Level: Expect the Biggest Correction YetIf Bitcoin Loses This Level: Expect the Biggest Correction Yet
Current Market Overview:
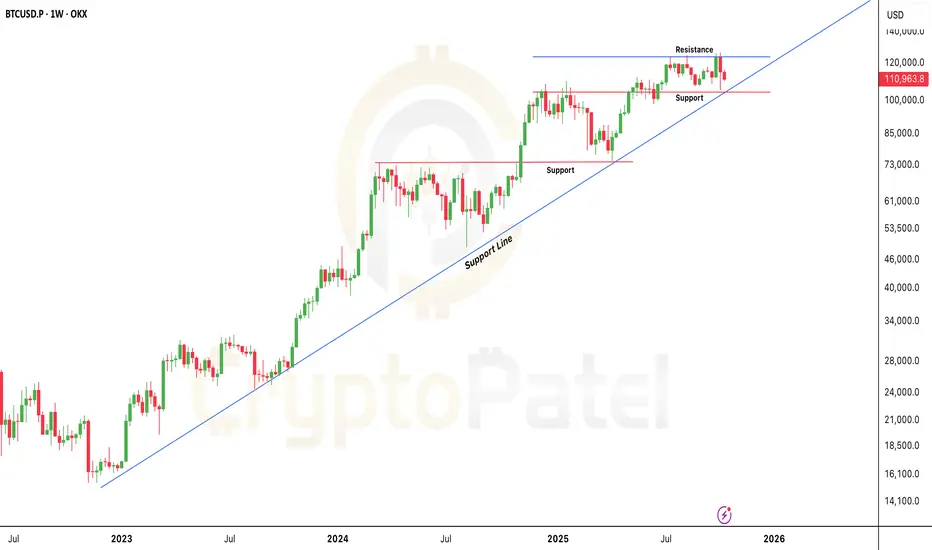
Bitcoin is trading above $110,000, maintaining a bullish stance for now. However, short-term momentum looks weak as the market tests crucial support levels.
Key Support Zone:
The most critical area to watch is $104,000 – $105,000.
This zone aligns with the long-term bullish trendline, which has held firm through multiple market corrections.
As long as price stays above this trendline, the broader trend remains bullish.
Bullish Scenario:
If Bitcoin holds above the $104,000 support level, it signals strength and potential continuation of the uptrend.
In that case, the next upside target remains around $150,000 in the coming months.
Bearish Scenario:
If the $104,000 trendline breaks decisively, Bitcoin may enter a deeper correction phase.
Downside targets could extend to below $100,000, and in a worst-case scenario, even toward $80,000.
Technical Summary:
🔹 Immediate Resistance: $110,000 – $112,500
🔹 Major Support Zone: $104,000 – $105,000
🔹 Trend Bias: Bullish above $104,000 | Bearish below $104,000
🔹 Long-Term Target: $150,000 (if support holds)
Trading Insight:
This is a decisive zone for Bitcoin. Bulls must defend $104k to maintain structure.
Below it, expect volatility and potential trend reversal signals.
NFA & DYOR
Trading
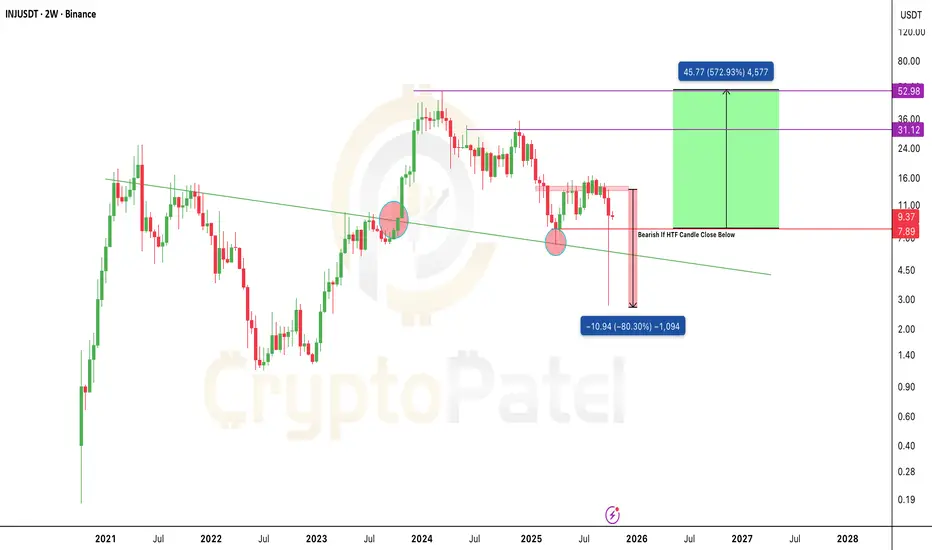
INJ/USDT Bullish Chart analysis and Potential $50 in future?CRYPTOCAP:INJ crashed nearly 80% after Trump’s 100% tariff announcement on China, few caught that insane dip below $3.
But here’s the thing, price is still holding strong above $7.8 support on HTF, meaning bulls aren’t done yet.
Accumulation Zone: $9–$7
Targets: $20 / $35 / $50
If CRYPTOCAP:INJ breaks out again, this could be one of the most explosive comebacks of the cycle.
NFA & DYOR
Part 4 Institutional Trading Types of Option Trading Strategies
Option traders use different strategies depending on their market view:
Bullish Strategies: Buying Call Options, Bull Call Spreads.
Bearish Strategies: Buying Put Options, Bear Put Spreads.
Neutral Strategies: Iron Condor, Straddle, Strangle — for when the trader expects low volatility.
These strategies help balance risk and reward, allowing traders to profit even in sideways markets.

Part 2 Ride The Big Moves Key Components of Option Contracts
Every option has specific terms that determine its value and use:
Underlying Asset: The stock, index, or commodity the option is based on.
Strike Price: The pre-decided price at which the buyer can buy or sell the asset.
Premium: The price paid to purchase the option.
Expiry Date: The date when the option contract ends.
Lot Size: The number of shares per contract (e.g., 50 shares for NIFTY options).
The value of an option depends on factors such as the market price of the asset, time left to expiry, and volatility. These factors influence whether the option is in-the-money (ITM), at-the-money (ATM), or out-of-the-money (OTM).

GOLD hits a new all-time high at $4,200 for the first time ever.🚨JUST IN: GOLD hits a new all-time high at $4,200 for the first time ever.
Now here’s the real question:
Will Gold retrace back to the $3,000–$2,500 zone soon?
That region aligns perfectly with the 0.382 Fibonacci retracement, a level where Gold has historically cooled off before launching its next major bull rally.
Eyes on the golden pullback before the next explosion.

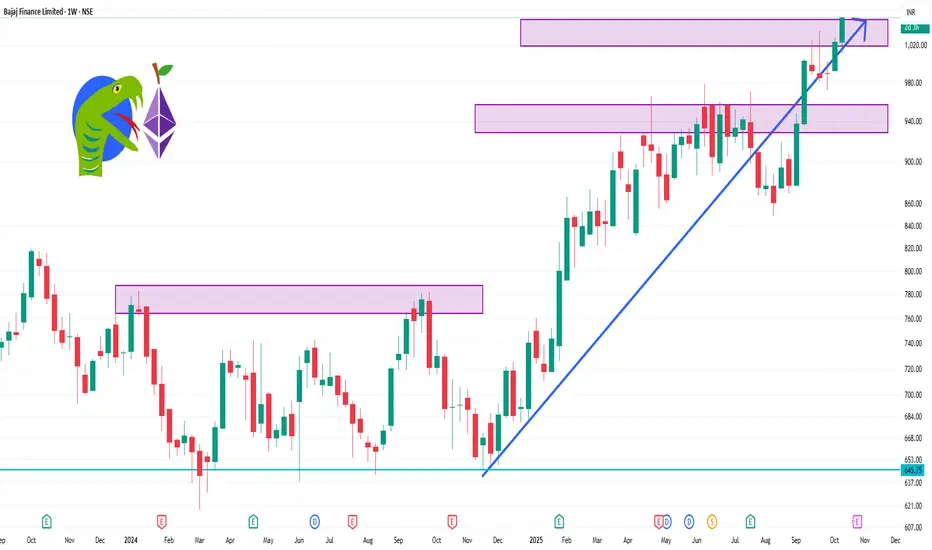
BAJFINANCE 1 Week Time Frame 📈 Weekly Technical Levels
Resistance Levels: ₹1,036.75 (short-term), ₹1,023.85 (mid-term)
Support Levels: ₹1,009.85 (short-term), ₹938 (mid-term), ₹816.86 (long-term)
These levels suggest that the stock is trading above its key support zones, indicating a potential continuation of the uptrend.
🔧 Key Technical Indicators
RSI (14): 66.57 — approaching overbought territory, but still room for upward movement.
MACD: 20.92 — indicates bullish momentum.
ADX (14): 31.50 — suggests a strong trend.
Supertrend: ₹973.61 — currently bullish.
Parabolic SAR: ₹982.79 — supports the bullish trend.
Stochastic Oscillator: 84.34 — near overbought levels, indicating potential for a pullback.
Commodity Channel Index (CCI): +131.56 — suggests the stock is overbought.
These indicators collectively point towards a strong bullish trend, though caution is advised as some indicators approach overbought conditions.
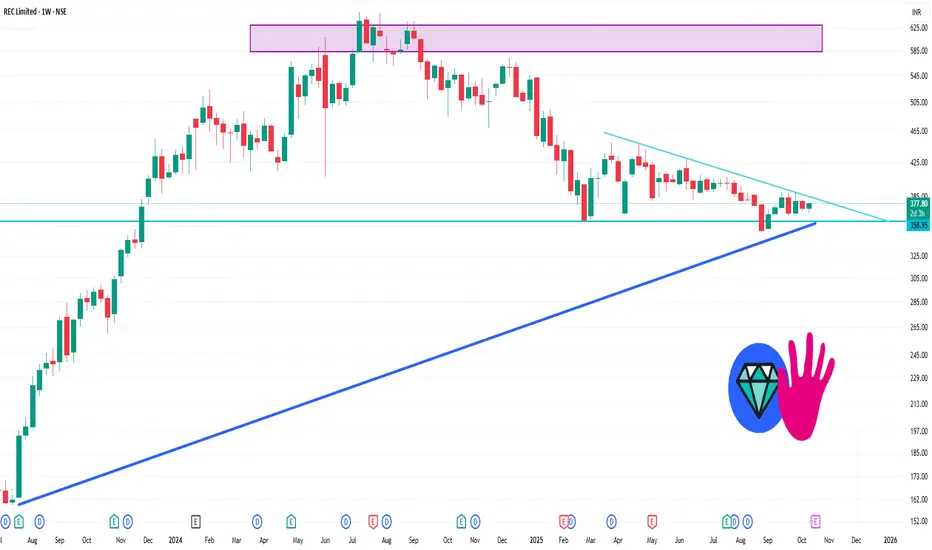
RECLTD 1 Week Time Frame 📊 Weekly Support & Resistance Levels
Immediate Support: ₹367.92
Key Support: ₹362.88
Immediate Resistance: ₹379.97
Key Resistance: ₹386.98
Weekly Trading Range: ₹355.87 – ₹392.02
🔍 Technical Indicators
RSI (14-day): 50.58 — Indicates a neutral momentum
MACD: -1.16 — Suggests a bearish trend
ADX: 15.79 — Indicates a weak trend
Stochastic RSI: 27.40 — Indicates an oversold condition
Moving Averages: Both short-term and long-term moving averages are neutral, with no clear buy or sell signals.
📈 Trend Analysis
Short-Term Trend: Neutral
Mid-Term Trend: Bearish
Long-Term Trend: Bearish
Resistance Levels: ₹386.7 (short-term), ₹391.55 (mid-term), ₹446.25 (long-term)
Support Levels: ₹364.3 (short-term), ₹350 (mid-term), ₹350 (long-term)
LT 1 Day Time Frame 📈 Current Price Snapshot
Current Price: ₹3,827.25
Day's Range: ₹3,744.30 – ₹3,841.40
52-Week Range: ₹2,965.30 – ₹3,963.00
Market Cap: ₹5.27 lakh crore
Volume: 1,160,071 shares
The stock is trading near its 52-week high, reflecting strong bullish momentum.
📊 Technical Indicators
Relative Strength Index (RSI): Approximately 70, indicating the stock is in overbought territory.
Moving Averages:
50-Day MA: ₹3,650
200-Day MA: ₹3,500
MACD: The MACD line is above the signal line, confirming upward momentum.
Pivot Points:
Support: ₹3,744
Resistance: ₹3,841
The stock is trading above its moving averages, indicating a strong bullish trend.

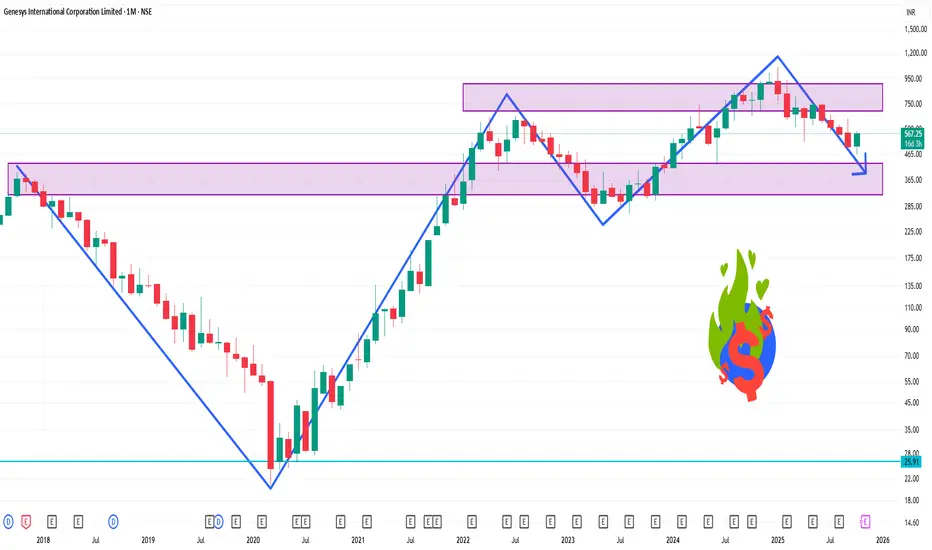
GENESYS 1 Month Time Frame 📉 1-Month Performance
Price Change: The stock has declined by approximately 15.81% over the past month.
INDmoney
Recent Trend: Despite the monthly decline, the stock experienced a significant uptick today, closing at ₹575.55, up from ₹479.65.
📊 Technical Indicators (1-Month View)
Relative Strength Index (RSI): The RSI is at 23.10, indicating that the stock is in the oversold territory and may be due for a rebound.
Moving Averages
20-Day Exponential Moving Average (EMA): ₹526.60 (suggests a sell signal as the current price is below this level).
50-Day EMA: ₹565.84 (also indicates a sell signal).
100-Day EMA: ₹608.98 (further confirming the downtrend).
MACD: The Moving Average Convergence Divergence (MACD) is at -28.90, suggesting a bearish trend.
Pivot Points:
Resistance Levels: R1: ₹491.28, R2: ₹505.12, R3: ₹513.33.
Support Levels: S1: ₹469.23, S2: ₹461.02, S3: ₹447.18.
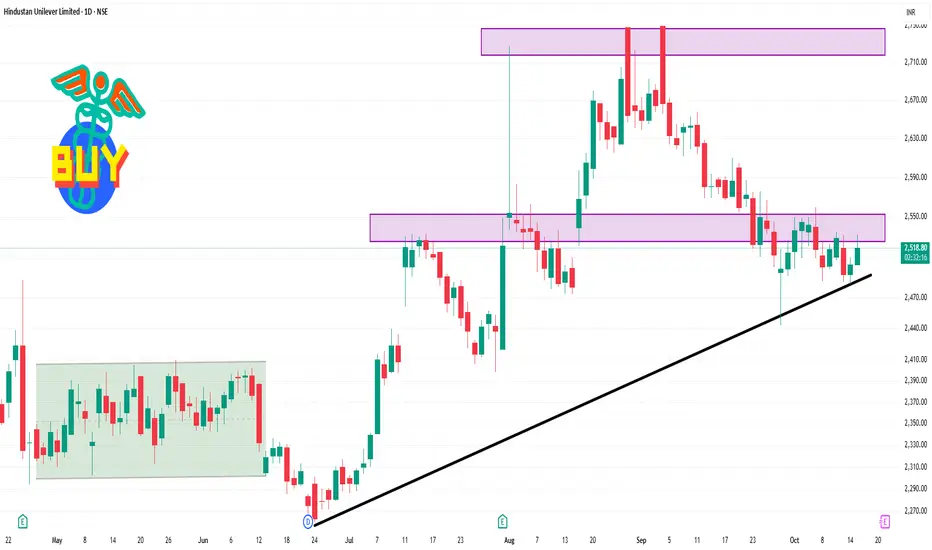
HINDUNILVR 1 Day Time Frame 📊 Intraday Price Range
Day Range: ₹2,502.60 – ₹2,531.80
VWAP (Volume-Weighted Average Price): ₹2,521.48
🔰 Pivot & Support/Resistance Levels
Standard Pivot: ₹2,513.57
Resistance (R1): ₹2,524.83
Resistance (R2): ₹2,540.47
Support (S1): ₹2,497.93
Support (S2): ₹2,486.67
🔁 Technical Outlook
Technical Summary: Neutral
Moving Averages: Neutral
Oscillators: Neutral
Overall Rating: Neutral
🔍 Analysis & Strategy
Support Zone: ₹2,400–₹2,500
Resistance Zone: ₹2,650–₹2,700
Breakout Target: ₹2,850+
Stop Loss: ₹2,395 (closing basis)
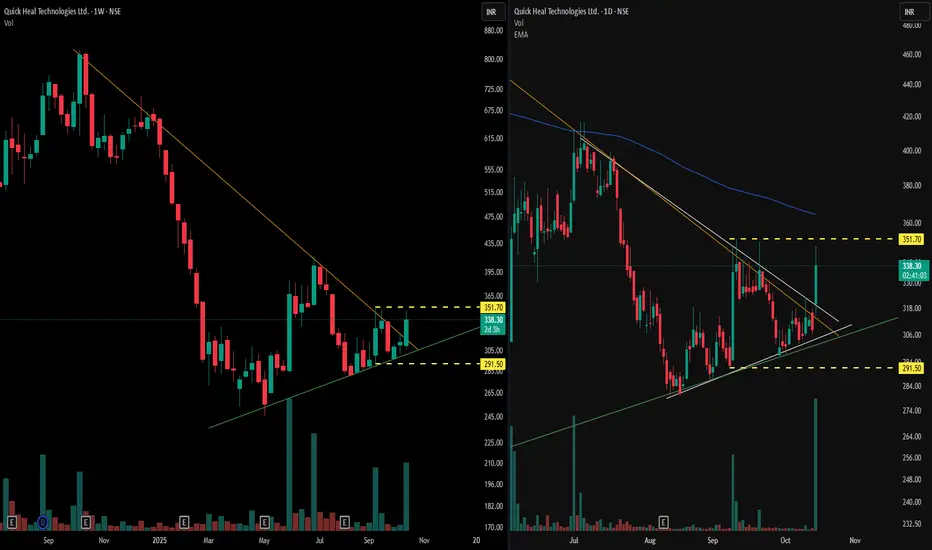
Multi-Timeframe VCP Observations📊 Weekly Time Frame Observations (left panel)
- It displays a visible pattern contraction structure, specifically a Volatility Contraction Pattern (VCP), formed over multiple months
- An orange trendline marking the descending resistance, and a green line depicting the rising support, which together highlight the range contraction of price
- Volume spikes coincide with specific price responses at these zones, denoting heightened activity during volatility periods within the VCP
📈 Daily Time Frame Observations (right panel)
- Presents a more compressed Volatility Contraction Pattern (VCP), mirroring the broader weekly setup but over a shorter time span.
- Below the blue 200-day exponential moving average
❗ Disclaimer: The above post is strictly observational and does not constitute any trading advice or predictions regarding breakout or price direction.
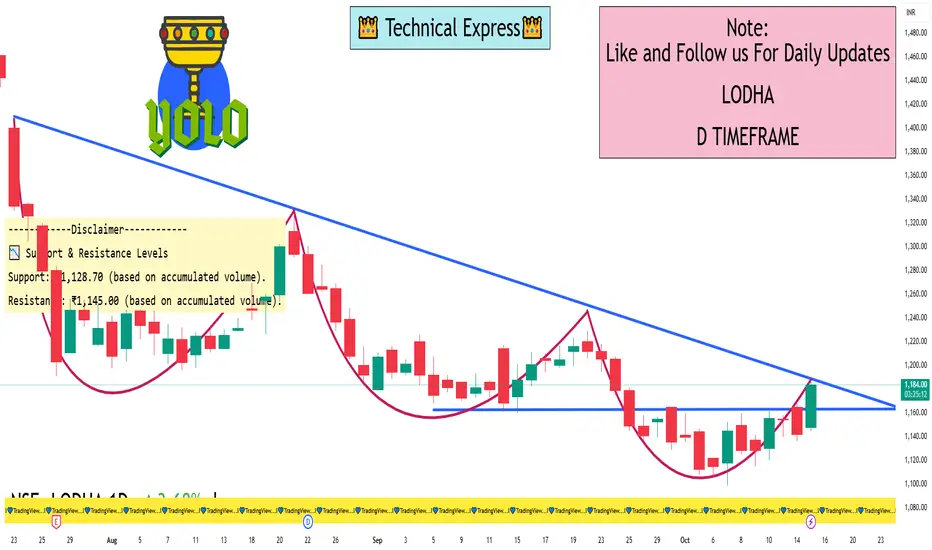
LODHA 1 Day View 📈 Current Price & Trend
Current Price: ₹1,184.90
Day's Range: ₹1,136.50 – ₹1,168.00
Previous Close: ₹1,142.00
Price Change: +₹42.90 (+3.77%)
The stock has shown a positive movement today, indicating a potential short-term bullish trend.
🔍 Technical Indicators
RSI (14-day): Approximately 51, suggesting a neutral momentum with no immediate overbought or oversold conditions.
MACD: Currently below the signal line, indicating a bearish short-term momentum.
Moving Averages:
Short-term (14-day): Currently above the long-term (200-day) moving average, suggesting a bullish short-term trend.
Long-term (200-day): The price is trading below the long-term moving average, indicating a bearish long-term trend.
Stochastic Oscillator: Reading between 45 and 55, suggesting a neutral market condition.
📌 Support & Resistance Levels
Support: ₹1,128.70 (based on accumulated volume)
Resistance: ₹1,145.00 (based on accumulated volume)
📊 Trading Outlook
The stock is expected to trade within a range of ₹1,126.95 to ₹1,157.05, with a potential move of ±2.67% from the last closing price.
⚠️ Risk & Outlook
Risk: Medium, with average daily volatility of approximately 2.77%.
Outlook: The stock is showing a neutral to slightly bullish short-term outlook, with mixed signals from various indicators. Traders should monitor key support and resistance levels around ₹1,128.70 and ₹1,145.00, respectively.
Policy Developments in Derivatives and Commodities MarketsIntroduction
The derivatives and commodities markets are critical components of the global financial system. They provide essential tools for risk management, price discovery, and investment diversification. Derivatives—contracts whose value derives from underlying assets like commodities, equities, or currencies—enable participants to hedge against price volatility. Commodities markets, on the other hand, facilitate trading in raw materials such as oil, metals, and agricultural products.
Over the past few decades, these markets have witnessed significant evolution in both their structure and regulatory frameworks. Policymakers and regulatory authorities across the globe have introduced reforms to enhance transparency, reduce systemic risk, and promote market efficiency. These policy developments have become increasingly important in light of financial crises, technological advancements, globalization of markets, and growing participation from retail investors.
1. Historical Context of Derivatives and Commodities Regulation
The regulation of derivatives and commodities markets has evolved in response to market crises and structural changes. Historically, commodities trading, especially in agricultural products, was lightly regulated, primarily aimed at preventing fraud and market manipulation. In contrast, modern derivative markets grew exponentially in the 1980s and 1990s with the rise of financial engineering and complex instruments like options, swaps, and futures.
Major events that shaped policy include:
The 1987 Stock Market Crash: Highlighted the need for robust oversight of derivative instruments and their impact on financial markets.
The 2008 Global Financial Crisis: Exposed systemic risks inherent in over-the-counter (OTC) derivatives markets, prompting regulators to focus on transparency, collateralization, and centralized clearing mechanisms.
Commodity Price Volatility: Sharp swings in oil, metals, and agricultural products prices led to government interventions to stabilize markets, protect consumers, and ensure fair trading practices.
These events underscored the importance of developing robust regulatory frameworks to safeguard market integrity while fostering innovation.
2. Objectives of Policy Developments
Regulatory policies in derivatives and commodities markets aim to achieve several key objectives:
Market Integrity: Preventing manipulation, insider trading, and fraudulent practices.
Transparency: Ensuring that market participants have access to accurate and timely information about prices, trading volumes, and open positions.
Financial Stability: Reducing systemic risk that arises from excessive leverage, interconnected financial institutions, and OTC derivatives exposures.
Consumer Protection: Safeguarding investors, particularly retail participants, from misleading practices or excessive risk exposure.
Promotion of Market Efficiency: Ensuring smooth price discovery and liquidity in the markets.
Alignment with International Standards: Harmonizing domestic regulations with global best practices set by organizations such as the International Organization of Securities Commissions (IOSCO) and the Financial Stability Board (FSB).
3. Key Policy Developments in Derivatives Markets
3.1 Introduction of Central Clearing
One of the most significant reforms after the 2008 financial crisis was the push for central clearing of standardized OTC derivatives. Central counterparties (CCPs) act as intermediaries between buyers and sellers, reducing counterparty risk. Regulatory frameworks such as Dodd-Frank Act (USA, 2010) and the European Market Infrastructure Regulation (EMIR, EU, 2012) mandated clearing of certain interest rate and credit derivatives through CCPs.
Impact:
Reduced systemic risk from bilateral exposures.
Standardized collateral requirements.
Improved market transparency.
3.2 Trade Reporting and Transparency
Regulators worldwide have introduced mandatory trade reporting requirements to enhance transparency in derivatives markets. Trade repositories collect and publish data on derivative transactions, including notional amounts, counterparties, and trade dates.
Examples of regulatory measures:
Dodd-Frank Act: Requires real-time reporting of swaps transactions to swap data repositories.
EMIR: Obligates EU market participants to report derivative trades to trade repositories.
Impact:
Increased market visibility.
Facilitated monitoring of systemic risk and market abuse.
3.3 Margin and Collateral Requirements
To mitigate counterparty risk, regulators have introduced margin requirements for both cleared and non-cleared derivatives. Initial margin protects against potential default losses, while variation margin ensures that daily gains and losses are settled.
Impact:
Reduced excessive leverage in derivatives trading.
Promoted financial stability and investor confidence.
3.4 Standardization of Contracts
Policy frameworks encourage the standardization of derivative contracts to facilitate central clearing and improve liquidity. Standardization covers contract size, settlement dates, underlying asset definitions, and documentation standards.
Impact:
Easier to trade on exchanges or through CCPs.
Lower operational and legal risks for participants.
3.5 Risk-Based Supervision
Regulators are increasingly adopting risk-based approaches to monitor derivative markets. This involves focusing on systemically important institutions, products, and trading strategies that could pose the greatest risk to financial stability.
Impact:
Efficient use of regulatory resources.
Early identification and mitigation of systemic threats.
4. Key Policy Developments in Commodities Markets
4.1 Position Limits and Speculation Controls
Excessive speculative trading can destabilize commodity prices. Regulators have introduced position limits to restrict the number of contracts a participant can hold in futures markets. These limits aim to prevent market manipulation and excessive concentration of risk.
Examples:
Commodity Futures Trading Commission (CFTC) in the US sets speculative position limits for energy, metals, and agricultural contracts.
Securities and Exchange Board of India (SEBI) imposes position limits in commodity futures markets to curb volatility.
4.2 Market Surveillance and Anti-Manipulation Measures
Commodity exchanges and regulators have strengthened market surveillance to detect and prevent price manipulation, spoofing, and front-running. Sophisticated monitoring systems track trading patterns in real-time to identify anomalies.
Impact:
Enhanced investor confidence.
Reduced market distortions caused by artificial price movements.
4.3 Integration with Global Markets
Globalization of commodities trading has prompted harmonization of regulations across borders. Policymakers focus on aligning rules regarding contract specifications, reporting, and settlement to facilitate international participation.
Examples:
Cross-border recognition of clearinghouses.
Adoption of international standards on warehouse receipts and quality certification for agricultural commodities.
4.4 Commodity Derivatives for Hedging and Risk Management
Governments encourage the use of commodity derivatives for legitimate hedging purposes by producers, consumers, and traders. Policy initiatives include reducing regulatory burdens for hedgers while monitoring speculative activities.
Impact:
Enhanced price discovery and risk management.
Support for farmers, manufacturers, and energy companies in managing input costs.
4.5 Technological Innovations and Policy Adaptation
Digital trading platforms, algorithmic trading, and blockchain-based commodity exchanges have transformed the market landscape. Regulators are adapting policies to address new risks, including cyber threats, algorithmic market manipulation, and transparency challenges in decentralized trading.
Impact:
Improved market efficiency and accessibility.
Necessitated development of technology-driven monitoring tools.
5. Emerging Trends in Policy Development
Sustainability and ESG Integration: Policies increasingly emphasize environmental, social, and governance (ESG) compliance. Commodity trading in carbon credits, renewable energy certificates, and ESG-linked derivatives is growing.
Retail Participation Regulation: With growing retail interest in commodities and derivatives, regulators are introducing education initiatives, leverage limits, and product suitability requirements.
Cross-Market Risk Management: Integrated policies are addressing interconnected risks between derivatives, commodities, and other financial markets.
Global Coordination: Bodies like the IOSCO and FSB coordinate policy frameworks to prevent regulatory arbitrage and systemic instability.
6. Challenges in Policy Implementation
Despite significant reforms, regulators face several challenges:
Complexity of Derivative Products: Highly customized contracts are difficult to monitor and standardize.
Global Market Fragmentation: Different jurisdictions have varied regulatory standards, creating arbitrage opportunities.
Technological Disruptions: High-frequency trading, AI-based strategies, and decentralized exchanges introduce new risks.
Balancing Innovation and Risk: Policymakers must ensure that innovation is not stifled while protecting market participants.
7. Conclusion
Policy developments in derivatives and commodities markets have transformed these markets into safer, more transparent, and efficient mechanisms for risk management and investment. Central clearing, trade reporting, margin requirements, and position limits have enhanced market integrity and financial stability. Regulatory emphasis on transparency, standardization, and risk-based supervision has reduced systemic threats while fostering investor confidence.
As these markets continue to evolve with globalization, technological innovation, and ESG integration, policymakers must remain agile. Future regulatory frameworks are likely to focus on harmonizing global standards, enhancing surveillance capabilities, promoting sustainability, and safeguarding retail participants. Effective policy development in derivatives and commodities markets not only mitigates risks but also ensures that these markets continue to serve as vital tools for price discovery, hedging, and economic growth.
XAUUSD – Continues to set ATH XAUUSD – Continues to set ATH, prioritise buying according to POC 4,146–4,148 🟡
Gold continues to make higher highs after a strong rise in the Asian session; the upward channel structure remains intact. On H1, POC ~4,147–4,148 is the nearest support point; above is the resistance cluster according to FE 1.618 ~4,186 and the sell zone 4,221–4,240.
Key levels
Support: 4,146–4,148 (POC) • 4,140 (short-term invalid).
Resistance/targets: 4,166 • 4,186 (FE 1.618) • 4,188–4,200 • 4,221 (sell scalping) • 4,240 (sell zone).
Trading scenarios
Buy 1 – POC pullback
Entry 4,146–4,148 | SL 4,140 | TP 4,166 → 4,188 → 4,200 → 4,245.
If it pulls back to POC and H1 shows a confirmation candle/mid-trendline support, prioritise buying.
Buy 2 – Shallow retest
If the price only dips ~4,160–4,162 then rebounds above POC, additional buying is possible with SL 4,152, TP as above.
Sell reaction (higher risk)
Entry 4,240 | SL 4,250 | TP 4,222 → 4,200 → 4,188 → 4,160.
Only trigger when there is a clear rejection signal at 4,221–4,240; this is a counter-trend trade.
Invalidation & management
Buying bias weakens when H1 closes below 4,140 or breaks the lower channel edge.
After TP1, move SL to entry; avoid chasing price in the 4,18x–4,20x area when volume is thin. 🎯
Quick context
The upward momentum is maintained due to expectations of the Fed ending QT/looser conditions and safe haven flows; however, the 4,221–4,240 area may create a short-term reaction before the uptrend continues.
Trade well with this scenario!

Nifty Head & Shoulder 1 Hrs Chart Nifty Taken Good move from Bottom. Now Yesterday Nifty taken Resistance near 25300. It's Clearly Visible Head & Shoulder Pattern .
We may see Down side till 25000 level. 25000 is a Round level & Psychology level also so may take a pause . Or if it Breaks then may Fall more . So be careful.
Make Position accordingly to ur financial advisor. My views for for educational purposes only.
For more information Visit my Tradingview Profile.

Bitcoin LTF Analysis & Market OutlookBitcoin LTF Analysis & Market Outlook
#Bitcoin still doesn’t look strong on LTF, and I’m expecting some more downside movement in the coming days. So if you’re holding high leverage longs, manage them carefully and always use strict stop loss.
Here’s the key structure to watch:
Resistance 1: $116,000
If CRYPTOCAP:BTC fails to break and hold above this level, momentum stays weak and we could revisit the $100,000 zone again.
Resistance 2: $122,500
Only a confirmed breakout above this level can trigger the next leg toward a new ATH around $150,000.
Until then, play defense. Avoid emotional trades, don’t gamble with your hard-earned money, and only take entries backed by clear confluence, strategy, and discipline.
Remember: The market always rewards patience, not greed. Stay alert, follow structure, and let the setup come to you.

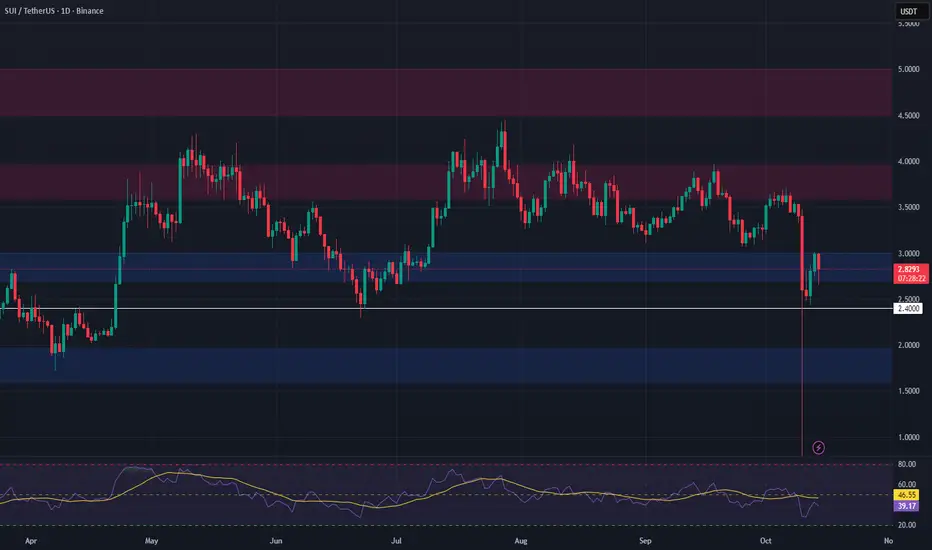
SUI – Swing Trade Setup from Key Support ZoneSUI is currently trading in a major support zone between $2.70 and $3.00, a level that has previously acted as a strong demand area. The price is consolidating here, and this could offer a high-probability long opportunity for swing traders watching for a potential bounce.
📈 Entry Zone: $2.70 – $3.00
🎯 Take Profit Targets:
• TP1: $3.60 – $3.95
• TP2: $4.50 – $5.45
🛑 Stop Loss: $2.40
ALGO Swing Trade Setup — Support Bounce OpportunityWe see a strong support zone forming around $0.186 – $0.195, which has been tested multiple times in the past. This area is acting as a potential springboard for a bullish reversal.
If price respects this zone, we may see momentum carry ALGO upward toward key resistance areas.
Entry Zone: $0.186 – $0.195
Target 1: $0.225 – $0.26
Target 2: $0.285 – $0.33
Stop Loss: Just below $0.18, invalidating the setup if price breaks lower

Divergence Secrets Option Premium Components
The option premium (price) has two parts:
Intrinsic Value: The actual value if exercised now (difference between stock price and strike price).
Time Value: The extra amount traders pay for the potential of future movement before expiry.
As expiry approaches, time value decreases, a phenomenon known as time decay (Theta).

Option Trading What Is an Option?
An option is a contract between two parties: the buyer and the seller (writer).
It gives the buyer the right—but not the obligation—to buy or sell an underlying asset at a predetermined price (called the strike price) before or on a specific date (called the expiry date).
There are two main types of options:
Call Option – gives the buyer the right to buy the asset.
Put Option – gives the buyer the right to sell the asset.

Part 1 Candle Stick PatternRisks and Rewards in Option Trading
Option trading offers tremendous potential—but it comes with unique risks. Understanding these is essential:
Limited Time: Options lose value as expiry nears due to time decay (Theta).
Volatility Risk: Sudden drops in volatility can reduce option prices unexpectedly.
Liquidity Risk: Some options have low trading volume, making it difficult to enter or exit positions.
Leverage Effect: Options amplify both gains and losses.
Margin Requirements (for Sellers): Option writers must maintain sufficient margin, as potential losses can be large.

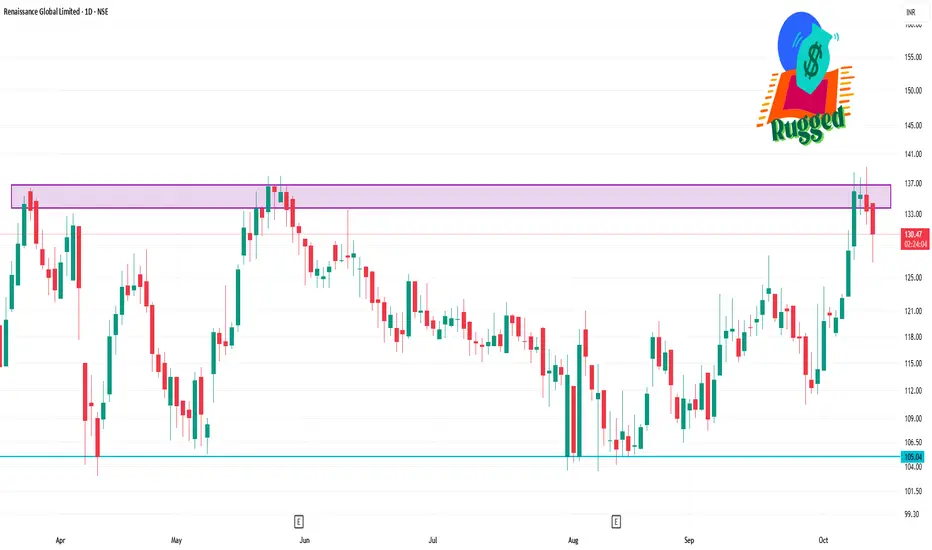
RGL 1 Day Time Frame📊 Intraday Price Movement
Opening Price: ₹135.00
Day's Range: ₹131.60 – ₹139.21
Previous Close: ₹135.46
Volume Traded: Approximately 711,000 shares
Market Cap: ₹1,453.32 crore
🔧 Technical Indicators
Relative Strength Index (RSI): 72.25, indicating potential overbought conditions
Moving Average Convergence Divergence (MACD): 0.82, suggesting a bullish trend.
Support Levels: ₹130.00 and ₹131.60
Resistance Levels: ₹135.46 and ₹139.21
📈 52-Week Range
High: ₹207.40
Low: ₹103.01
ITC 1 Day Time Frame📊 Key Support & Resistance Levels
Support Levels: ₹398.30, ₹399.25, ₹397
Resistance Levels: ₹401, ₹402, ₹403
The stock is currently near the support zone, indicating potential for a short-term rebound if buying pressure increases.
📈 Pivot Points (Classic Method)
Pivot Point: ₹399.58
Resistance Levels: R1: ₹400.62, R2: ₹401.98, R3: ₹403.02
Support Levels: S1: ₹398.22, S2: ₹397.18, S3: ₹395.82
Trading below the pivot point suggests a bearish bias.
