XAUUSD – High volatility, monitor key reaction zones.📌 Market Context
Gold is currently trading in a high-volatility environment after a sharp drop below the $5,000 level, reflecting aggressive repricing ahead of major macro uncertainty. The market has shifted away from smooth trend behavior into a liquidity-driven, fast-reaction phase, where price moves sharply between key technical zones.
With ongoing changes in Fed leadership and uncertainty around future monetary policy direction, gold remains extremely sensitive to expectations, flows, and headlines.
➡️ Current state: Volatile conditions – wait for confirmation, avoid emotional trades.
📊 Structure & Price Action (M30)
The prior bearish impulse is losing momentum, with short-term higher lows starting to form.
Price is currently in a technical recovery phase, not a confirmed trend reversal yet.
Market continues to respect Demand and Key Levels, producing sharp reactions.
No confirmed bullish CHoCH at this stage — further validation is required.
🔎 Key insight:
Gold is trading inside a decision zone, where each key level can trigger strong directional moves.
🎯 Trading Plan – MMF Style
🔵 Primary Scenario – Buy the Technical Pullback
Focus on reaction-based execution, not anticipation.
BUY Zone 1: 4,667 – 4,650
(Near-term demand + first recovery base)
BUY Zone 2: 4,496 – 4,480
(Deep demand + prior liquidity sweep low)
➡️ Execute BUYs only if:
Clear bullish candle reaction appears
Or a Higher Low structure forms on M30
Upside Targets:
TP1: 4,932
TP2: 5,124 (Major recovery resistance/supply zone)
🔴 Alternative Scenario – Sell at Resistance Reaction
If price retraces into supply and fails to hold bullish momentum:
SELL Zone: 5,120 – 5,140
→ Look for short-term rejection following M30 structure
❌ Invalidation
A confirmed M30 close below 4,480 invalidates the recovery structure and requires a full reassessment.
🧠 Summary
Gold is in a high-volatility, structure-building phase, not an environment for emotional or aggressive positioning. The edge lies in:
Trading key levels, not impulses
Waiting for price confirmation
Prioritizing risk management over prediction
📌 In volatile markets, discipline outperforms frequency.
Trading

Continuation of the Liquidity Grab concept I make educational content videos for trading, this will be a continuation of what happens after a liquidity grab in the markets
No Bias - No predications - only telling concepts and information on general trends of index

XAUUSD (H3) – Liam Weekly Trading PlanStructure has shifted | Early-week focus stays SELL on rallies
Quick summary
Gold has completed a sharp downside expansion after a prolonged bullish run, breaking the prior structure decisively. The current price action shows weak recovery attempts, suggesting the move lower is corrective-to-distributive rather than a completed reversal.
For the start of the week, the bias remains clear: sell the structure, not chase bounces.
Market structure
The previous uptrend has been fully disrupted by an impulsive sell-off.
Price is now trading below former support, which has flipped into resistance.
Current rebounds lack momentum and show characteristics of corrective pullbacks, not accumulation.
This keeps the market in a sell-on-rallies environment until proven otherwise.
Key technical zones
Primary sell FVG / resistance: 4970 – 5000
This zone aligns with imbalance and prior liquidity and is the preferred area for sell reactions.
Secondary sell FVG: 4795 – 4820
A lower reaction zone where price may stall before continuing lower.
Deeper liquidity target: 4340 – 4350
This remains the main downside objective if the structure continues to unwind.
Upper invalidation zone: 5300+
Acceptance above this area would force a reassessment of the bearish bias.
Early-week scenarios
Primary scenario – SELL rallies
As long as price remains capped below the 4970–5000 zone, any rebound should be treated as corrective. The expectation is for further downside continuation toward lower liquidity.
Secondary scenario – Deeper pullback
If price fails to reclaim the first sell zone cleanly, a slow grind lower into the 4795–4820 area may occur before continuation.
Reassessment condition
Only a strong reclaim and acceptance above 5300 would invalidate the current sell structure.
Key notes
Early-week price action often clears residual liquidity.
Avoid counter-trend longs inside resistance.
Let price come to the level, then execute.
Structure > opinion.
Weekly focus:
selling corrective rallies into FVG and resistance, or waiting for price to show a clear structural shift before changing bias.
— Liam

XAUUSD (H1) – Below $5,000: Correction or Quick Recovery?Market Context – Gold Enters a Critical Repricing Zone
Gold has officially slipped below the psychological $5,000 level, triggering renewed debate: Is this the start of a deeper corrective phase, or simply a liquidity reset before a sharp rebound?
The timing is crucial.
With speculation around changes in Fed leadership and future monetary policy direction, the market is repricing risk aggressively. This has injected exceptional volatility into Gold, where liquidity is being rapidly redistributed rather than trending cleanly.
➡️ This is no longer a low-volatility trend market — it’s a decision zone.
Structure & Price Action (H1)
The previous bullish H1 structure has failed, confirming a short-term corrective phase.
Price is trading below former demand, now acting as supply.
Current rebounds are technical pullbacks, not confirmed reversals.
Downside momentum remains active until price reclaims key structure levels.
Key insight: 👉 Below $5,000, Gold is trading in rebalancing mode, not trend continuation.
Key Technical Zones (H1)
Major Supply / Rejection Zone:
• $5,030 – $5,060
→ Former structure + Fibonacci confluence
→ Likely area for sellers to defend
Mid-Range Reaction Zone:
• $4,650 – $4,700
→ Short-term demand / potential bounce zone
Deep Liquidity Demand:
• $4,220 – $4,250
→ Major liquidity absorption zone
→ High probability area for a technical or structural rebound
Trading Plan – MMF Style
Scenario 1 – Sell the Pullback (Primary While Below $5,030)
Favor SELL setups on rallies into supply.
Wait for rejection / failure patterns.
Do not chase price lower.
➡️ Bias remains bearish-corrective while below $5,030.
Scenario 2 – Buy Only at Deep Liquidity
BUYs are considered only at major demand with confirmation:
• $4,650 – $4,700 (scalp / reaction only)
• $4,220 – $4,250 (higher-probability swing zone)
➡️ No blind bottom picking
➡️ Confirmation > prediction
Macro Risk Outlook
Fed leadership uncertainty = policy expectation volatility.
Any shift toward dovish credibility could trigger a violent short-covering rally.
Conversely, prolonged uncertainty keeps Gold under pressure short-term.
➡️ Expect fast moves, fake breaks, and wide ranges.
Invalidation & Confirmation
Bearish bias weakens if H1 reclaims and holds above $5,060.
Deeper correction opens if $4,220 fails decisively.
Summary
Gold below $5,000 is not weakness — it’s repricing. This is a market where liquidity hunts traders, not the other way around.
The edge right now is patience and precision:
Sell rallies into supply.
Buy only where liquidity is proven.
Let structure confirm before committing risk.
➡️ In high volatility, survival beats prediction.

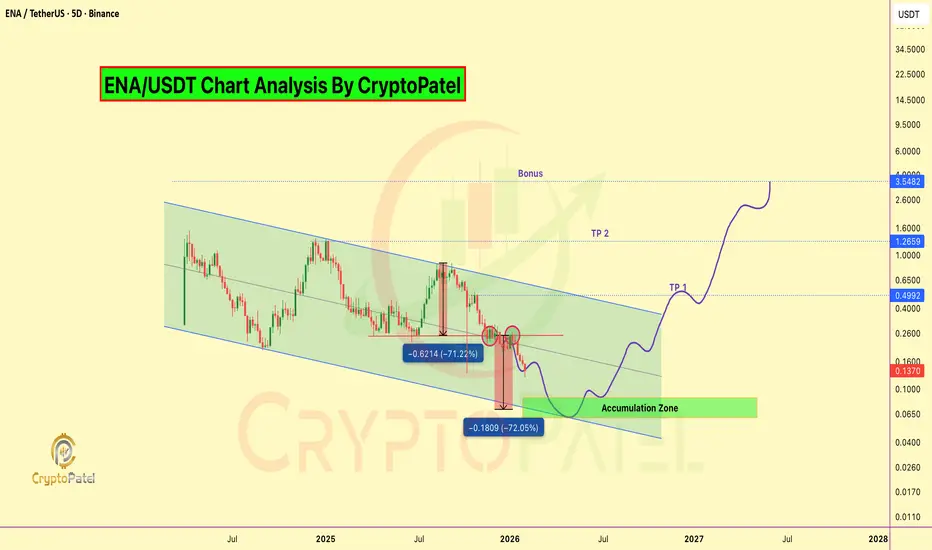
$100M Private Sale at $0.40... Now CMP Trading at $0.135$100M Private Sale at $0.40... Now Retail Can Buy at $0.135. First Time Retail Gets Better Entry Than VC
#ENA Is Trading Inside A Long-Term Descending Channel On The HTF Chart Since 2024.
Price Has Completed A Deep Multi-Leg Correction And Is Now Testing A Major Demand Zone At Channel Support.
Current Technical Structure:
✅ Descending Channel Intact
✅ ~92% Down From ATH
✅ Price Near Lower Channel Support
✅ Strong Accumulation Zone: $0.08–$0.06
✅ H&S Bearish Target For Long Term Accumulation is $0.07
✅ ~66% Below Private Investor Price (VC Discount Zone)
✅ Trump's World Liberty Financial Bought ~$5.15M ENA At ~$0.891 (Now ~$0.135 → ~85% Drawdown / ~$4.37M Unrealized Loss)
CryptoPatel Targets: $0.50 / $1.26 / Bonus $3+
As Long As ENA/USDT Holds Above The Accumulation Zone, A Relief Rally And Trend Reversal Remain Probable.
Why It Could Pump
✅ EURONEXT:USDE is now 3rd Largest Stablecoin ($5.8B)
✅ Fee Switch Coming Q1 2026 - stakers Get Protocol Revenue
✅ Building Own Blockchain
✅ Institutional Product (iUSDe) Launching Soon
✅ Major TradFi Backing
⚠️ Risks to Watch
❌ Heavy token unlocks until 2028
❌ Down 85% from ATH
❌ Similar model concerns to Terra/Luna
❌ Depends on positive funding rates
Invalidation & Risk Note: This is a high-risk, high-reward setup with elevated volatility. Strict risk management is essential.
TA Only. Not Financial Advice. ALWAYS DYOR.
Take Liquidity or Become Liquidity In this video I am talking about a Solid concept / strategy know as Liquidity .
General trends of the markets in terms of index are discussed in this videos and no bias or directions are given

Part 2 Intraday Institutional TradingHedging with Options
Options are widely used for risk management.
Examples:
Buying put options to protect long equity portfolios
Using collars to limit upside and downside
Index puts for market crash protection
Hedging reduces returns slightly but protects capital, which is crucial for long-term survival.

Futures & Options (F&O) Trading – Complete Explanation1. What Are Derivatives?
Derivatives are financial contracts whose value depends on the price of another asset (called the underlying). In the Indian stock market, the most common derivatives are:
Stock Futures & Options (e.g., Reliance, TCS)
Index Futures & Options (e.g., NIFTY, BANK NIFTY, FINNIFTY)
F&O contracts are standardized and traded on exchanges like NSE and BSE, ensuring transparency and safety.
2. Futures Trading Explained
Definition of Futures
A futures contract is a legally binding agreement to buy or sell an underlying asset at a predetermined price on a specified future date.
Key Features of Futures
Fixed contract size (lot size)
Fixed expiry date (weekly or monthly)
Requires margin, not full payment
Both buyer and seller are obligated to fulfill the contract
Example
Suppose NIFTY is trading at 22,000. You expect it to rise.
You buy NIFTY Futures at 22,000
If NIFTY moves to 22,200, you gain 200 points
If it falls to 21,800, you lose 200 points
Profit or loss = Price difference × Lot size
Advantages of Futures
High leverage
Suitable for trend trading
Easy to understand
Good liquidity in index futures
Risks in Futures
Unlimited losses
High volatility impact
Margin calls during adverse movement
3. Options Trading Explained
Definition of Options
An option is a contract that gives the buyer the right, but not the obligation, to buy or sell the underlying asset at a specific price on or before expiry.
Options are safer than futures for buyers because loss is limited to the premium paid.
4. Types of Options
Call Option (CE)
Gives the right to buy
Used when you expect the price to rise
Put Option (PE)
Gives the right to sell
Used when you expect the price to fall
5. Option Buyers vs Option Sellers
Option Buyer
Pays premium
Limited risk (premium paid)
Unlimited profit potential (theoretically)
Needs strong price movement
Option Seller (Writer)
Receives premium
Limited profit (premium received)
Unlimited risk
Higher probability of profit
Requires high margin
6. Key Option Terminologies
Strike Price
The price at which the option can be exercised.
Premium
The price paid to buy the option.
Expiry
Date on which the option contract expires.
Intrinsic Value
Actual value of the option if exercised immediately.
Time Value
Extra value due to time remaining until expiry.
7. Option Moneyness
ITM (In The Money) – Has intrinsic value
ATM (At The Money) – Strike ≈ Market price
OTM (Out Of The Money) – No intrinsic value
8. Option Greeks
Greeks measure how option prices change with market factors.
Delta – Sensitivity to price movement
Theta – Time decay (loss of value over time)
Vega – Sensitivity to volatility
Gamma – Rate of change of delta
Rho – Sensitivity to interest rates
Understanding Greeks is crucial for risk management in options trading.
9. Hedging Using F&O
F&O is widely used for risk protection.
Example: Portfolio Hedging
If you own stocks worth ₹10 lakh, you can:
Buy NIFTY Put Options
Loss in portfolio is offset by gains in puts during market fall
Hedging reduces downside risk but also limits profit.
10. Speculation in F&O
Most retail traders use F&O for short-term speculation due to leverage.
Common strategies:
Buying calls in bullish markets
Buying puts in bearish markets
Selling options in range-bound markets
Speculation requires discipline, risk control, and experience.
11. Common Option Strategies
Basic Strategies
Long Call
Long Put
Covered Call
Protective Put
Advanced Strategies
Bull Call Spread
Bear Put Spread
Iron Condor
Straddle & Strangle
Strategies help manage risk and improve probability.
12. Margin System in F&O
Futures require SPAN + Exposure Margin
Option selling requires high margin
Option buying needs only premium
Margins change with volatility and market conditions.
13. Expiry and Settlement
Index F&O: Cash-settled
Stock F&O: Mostly cash-settled
Weekly and monthly expiries available
On expiry day, time value becomes zero.
14. Advantages of F&O Trading
High leverage
Profit in rising, falling, and sideways markets
Portfolio protection
Advanced trading strategies
15. Risks of F&O Trading
High volatility
Emotional trading
Over-leverage
Rapid capital erosion
According to exchange data, most retail traders lose money in F&O due to lack of discipline and risk management.
16. Risk Management in F&O
Essential rules:
Always use stop-loss
Risk only 1–2% of capital per trade
Avoid overtrading
Trade with a plan
Understand product fully
17. Who Should Trade F&O?
F&O is suitable for:
Experienced traders
Disciplined investors
Hedgers
Not ideal for:
Beginners without market knowledge
Emotion-driven traders
Those seeking guaranteed income
Conclusion
Futures and Options trading is a powerful financial tool that offers opportunities for profit, hedging, and strategic trading. However, it also carries significant risk due to leverage and volatility. Success in F&O depends not on prediction, but on risk management, strategy selection, discipline, and continuous learning. Traders who treat F&O as a professional business rather than gambling stand a better chance of long-term survival and profitability.

STAR 1 Day View 📌 Live Price Snapshot
• Current price: ~₹877.00 on NSE (Last traded)
• Today’s range: ₹791 – ₹908.40
• 52-Week range: ₹513.05 – ₹1,025.00
📊 Daily Pivot & Key Levels (1-Day Timeframe)
These are approximate pivot, support and resistance levels based on the most recent pivot analysis published today:
📍 Pivot Point
Central Pivot: ~ ₹850.8
🛑 Resistance Levels
R1: ~ ₹868.1
R2: ~ ₹891.0
R3: ~ ₹908.3
(These are short-term upside barriers where price may slow/reverse)
🟩 Support Levels
S1: ~ ₹827.9
S2: ~ ₹810.6
S3: ~ ₹787.7
(These are immediate downside zones where price could find buying interest)
📌 How to Use These Levels Today
✔ Bullish view:
• Above Pivot ₹850.8 → watch for closing above R1 (~₹868) to strengthen upside bias.
• Breaking and holding above R2 (~₹891) could extend toward R3 (~₹908).
✔ Bearish/Range view:
• Failure below Pivot ₹850.8 or S1 (~₹827.9) increases odds of deeper correction toward S2/S3.
• Intraday rejections at R1/R2 can signal short-term sellers.

Part 3 Institutional VS. TechnicalHow Option Premium Works
The premium is the price of the option. It has two parts:
1. Intrinsic Value
The real value if exercised today.
For calls:
Intrinsic = Spot Price – Strike Price
For puts:
Intrinsic = Strike Price – Spot Price
2. Time Value
Extra value due to remaining time before expiration.
Options with more time left are more expensive because:
There’s more chance the trade will go in your favor.
Volatility increases the uncertainty (and potential profit).

XAUUSD (H1) – Liam PlanUptrend intact, but signs of short-term exhaustion | Trade reactions, not impulse
Quick summary
Gold remains in a strong H1 uptrend, continuing to print higher highs and higher lows within a well-defined bullish structure. However, after the recent sharp advance, price is starting to slow near the highs, increasing the likelihood of short-term pullbacks and two-sided price action.
➡️ The broader trend stays bullish, but execution should now be level-driven and reaction-based, not momentum chasing.
Technical view
Price is currently trading at elevated levels relative to recent structure, where prior buying activity has already been absorbed.
Key price areas to watch:
Short-term sell area: 5520 – 5530
Upper resistance area: around 5600
Pullback buy area: 5405 – 5420
Primary buy zone: 5150 – 5155
The current structure favors a pullback and rebalancing phase before any sustained continuation higher.
Trading scenarios
SELL – short-term reaction trades
Look for sell reactions around 5520 – 5530 if price shows weakness.
Downside targets sit near 5420, with further extension possible if the pullback develops.
These sells are tactical and short-term, not calls for a trend reversal.
BUY – aligned with the main trend
Primary scenario
Buy pullbacks into 5405 – 5420 if the area holds.
Targets back toward 5520 and higher.
Deeper scenario
If volatility increases, wait for price to retrace toward 5150 – 5155.
This area offers the best risk-to-reward for trend continuation.
Key notes
Strong trends still correct; patience matters.
Avoid entries in the middle of the range where risk outweighs reward.
Short positions are tactical only while the broader structure remains bullish.
What’s your plan:
selling reactions near 5520 – 5530, or patiently waiting for a pullback into 5405 – 5420 to rejoin the uptrend?
— Liam

XAUUSD – H1 volatility surge | liquidity reset ongoingMarket Context
Gold is entering a high-volatility phase after an extended bullish run. The recent sharp impulse down from the upper zone is not random — it reflects liquidity distribution and aggressive profit-taking near highs, amplified by fast USD flows and event-driven positioning.
In this environment, Gold is no longer trending smoothly. Instead, it is rotating between liquidity zones, creating two-way risk intraday.
➡️ Key mindset: trade reactions at levels, not direction.
Structure & Price Action (H1)
The prior bullish structure has been temporarily broken by a strong bearish impulse.
Price failed to hold above 5,427 – 5,532, confirming this area as active supply / distribution.
The move down shows range expansion, typical after ATH phases.
Current price action suggests rebalancing and liquidity search, not a confirmed macro reversal yet.
Key read:
👉 Above supply = rejection
👉 Below supply = corrective / bearish bias until proven otherwise
Trading Plan – MMF Style
🔴 Primary Scenario – SELL on Pullback (Volatility Play)
While price remains below key supply, selling reactions is favored.
SELL Zone 1: 5,427 – 5,432
(Former demand → supply flip + trendline rejection)
SELL Zone 2: 5,301 – 5,315
(Mid-range supply / corrective retest)
Targets:
TP1: 5,215
TP2: 5,111
TP3: 5,060
Extension: 4,919 (major liquidity pool)
➡️ Only SELL after clear rejection / bearish confirmation.
➡️ No chasing breakdowns.
🟢 Alternative Scenario – BUY at Deep Liquidity
If price sweeps lower liquidity and shows absorption:
BUY Zone: 4,920 – 4,900
(Major demand + liquidity sweep zone)
Reaction targets:
5,060 → 5,215 → 5,300+
➡️ BUY only if structure stabilizes and bullish reaction appears.
Invalidation
A clean H1 close back above 5,432 invalidates the short-term bearish bias and shifts focus back to bullish continuation.
Summary
Gold is transitioning from trend extension to volatility expansion.
This is a market for discipline and level-based execution, not prediction.
MMF principle:
Volatility = opportunity, but only for those who wait for reaction.
Trade the levels. Control risk. Let price confirm.

GVT&D 1 Week View 📊 Current context (end-Jan 2026):
The stock is trading near ₹3,100-₹3,200 levels recently.
📈 Resistance Levels (Upside Targets)
1. ~₹3,170 – ₹3,200
– Near recent intraday highs and short-term caps on rallies.
2. ~₹3,250 – ₹3,324
– Approaching the 52-week high zone (~₹3,323.8).
3. ~₹3,350 +
– Above the prior yearly highs — next structural resistance if breakout confirmed.
📉 Support Levels (Downside Floors)
1. ~₹2,670 – ₹2,680
– First solid support zone from pivot analyses & moving averages.
2. ~₹2,600 – ₹2,610
– Secondary support around longer-term EMA levels / 200-day average and prior consolidations.
3. ~₹2,520 – ₹2,550
– Lower support in case of deeper correction — near the 1-week recent low zone.
🔄 Pivot & Momentum Signals
Technical tools (e.g., trading platforms) suggest mixed/neutral to moderately bullish momentum in the 1-week context, with some indicators leaning positive but others neutral.

SWIGGY 1 Day View 📊 SWIGGY – 1-Day Time Frame Key Levels (Daily Technical View)
📍 Latest Price Context (Approx)
Current/Live price range (recent session): ~₹305–₹315 (trading range today)
🔑 Daily Support Levels
These are price zones where buying interest could emerge if the stock dips:
📌 S1 (Immediate Support): ~₹313–₹315
📌 S2: ~₹307–₹310
📌 S3 (Deeper support): ~₹295–₹300
(levels help define where the stock may stabilize on a pullback)
📈 Daily Resistance Levels
These are zones where price may face selling pressure:
🔹 R1: ~₹329–₹330
🔹 R2: ~₹335–₹336
🔹 R3: ~₹345–₹346
(above these, the stock needs strong momentum to continue higher)
📊 Daily Pivot Levels
Pivot levels often act as reference for thematic direction:
📍 Pivot (Central daily level): ~₹326–₹327
(Above this = mildly bullish bias for the day; below this = bearish bias)
📌 Based on Technical Indicators
Short-term indicators show mixed to bearish bias in daily trend, with several oscillators and moving average signals leaning sell/oversold — reflecting current selling pressure in the market.

Redington swing trade and upcoming result Redington swing trade and upcoming result target 280,next target 300,T3-330rs,

xauusd recently i capture #XAUUSD xauusd recently i capture #XAUUSD
Agar ak strong poi hai daily time frame ka strong poi ( fvg + opposite color ka breaker block + orderblock ) bias ke opposite direction me volume gap , imbalance ho to volume imbalance , gap ka value nahi rahega tab wo poi ka first fvg+ob ko tap karne jarur jayega
Aur jab strong poi ko tap kar lega phir wo jayega gap ko respact dene
xauusd recently captured #XAUUSD
If there is a strong POI (FVG + breaker block of opposite color + order block) on the daily time frame, the volume gap is in the opposite direction of the bias. If there is a volume imbalance, the gap value will not be there, then the POI will first tap the FVG + OB.
And once the strong POI is tapped, it will then go to respect the gap.
sorry my english is weak padh lena bhai log

Daily Nifty, smallcaps and Banknifty TalkI made educational content videos for trading, I am a Full time trade and My name is Apoorv .
General index chart and price action was discussed in this video - no bias or directions .

XAUUSD (GOLD) | BREAKOUT VS BREAKDOWN LEVEL | 29th Jan'2026XAU/USD (Gold) Outlook | 29 Jan 2026
Gold (XAU/USD) is trading near 5513, maintaining a strong bullish structure across daily, weekly, and monthly timeframes. Price is holding well above key moving averages, indicating sustained buying momentum. As long as gold stays above the 5515–5495 support zone, the upside bias remains intact with potential continuation toward 5555–5590. A decisive break below 5495 may trigger short-term corrective pressure, but the broader trend remains positive.
Breakout & Breakdown Levels
Bullish Breakout: Above 5555 | Bearish Breakdown: Below 5495
Disclaimer: This content is for educational purposes only and not financial advice. Trading involves risk; manage your position size wisely.

Part 4 Technical Analysis Vs Institution Option TradingA. When to Buy Options
Breakout from consolidation
High volume at breakout
Trend confirmed
IV low → premiums cheap
Clear direction available
B. When to Sell Options
Range-bound market
No trending structure
IV high → premiums expensive
Event after event → IV crash expected

XAUUSD – M30 Technical AnalysisMild Pullback Before the Next High | Lana ✨
Gold has extended sharply and is now trading into a high-resistance zone, where price often needs a light correction or consolidation to rebuild liquidity before attempting higher levels again. The broader trend remains bullish, but the next clean opportunity is more likely to come from a pullback into structure, not from chasing the highs.
📈 Market Structure & Trend Context
Price is still respecting the broader bullish structure, but the current leg is stretched after a strong impulsive run. The market is now reacting under the highest resistance zone, which typically creates short-term profit-taking and liquidity reactions before continuation.
As long as price holds above key structural support, the bullish trend remains intact.
🔍 Key Technical Zones
Highest resistance zone: 5585 – 5600 This is a premium area where price may hesitate or reject in the short term.
First support zone: 5508 A key decision level where price can rebalance before choosing direction.
Buy liquidity zone: 5446 – 5450 A strong liquidity pocket where buyers are more likely to step back in.
Long-term support zone: 5265 – 5285 A deeper base area if volatility expands into a broader correction.
🎯 Trading Scenarios
Gold may correct modestly from resistance and retest structure before pushing higher.
Buy Entry: 5446 – 5450 Stop Loss: 5438 – 5440
Take Profit targets:
TP1: 5508
TP2: 5538 – 5545
TP3: 5585 – 5600
TP4: 5650+
A shallower pullback toward 5508 could also be enough to reset momentum before another attempt higher, but repeated rejection at the top would increase the risk of deeper consolidation.
🧠 Lana’s View
Gold remains bullish, but the market is now at a level where patience matters more than speed. Rather than chasing price near resistance, the focus should stay on how price reacts during pullbacks into key structural zones.
✨ Respect the structure, manage risk, and let price come to your level.

GRSE 1 Day Time Frame 📈 Live Price & Intraday Range (as of mid‑session)
Current Price (approx): ₹ 2,570 – ₹ 2,573 (NSE) — showing a positive move vs previous close.
Today’s High: ~₹ 2,647.90
Today’s Low: ~₹ 2,550.00
This indicates bullish participation intraday so far.
📌 Intraday Pivot & Support / Resistance Levels
Based on standard pivot calculation using the previous session’s range:
Pivot Point (PP): ~₹ 2,480.8
Resistance Levels:
R1: ~₹ 2,565.9
R2: ~₹ 2,613.1
R3: ~₹ 2,698.2
Support Levels:
S1: ~₹ 2,433.6
S2: ~₹ 2,348.5
S3: ~₹ 2,301.3
📌 Interpretation (Day Trading)
Above pivot (~₹ 2,480): bullish bias for the session.
Key breakout trigger: above R1/R2 levels (~₹ 2,565–2,613).
Downside support zones: around ₹ 2,433 then ₹ 2,348 if sellers step in.
🧠 How Traders Use These Levels Today
✅ Bullish scenario:
If the stock sustains above R1 (~₹ 2,566) and R2 (~₹ 2,613) with volume, buyers could push towards R3 (~₹ 2,698).
❗ If price weakens below S1/S2 (~₹ 2,433 / ₹ 2,348), short‑term downward pressure could emerge.
📍 Pivot (~₹ 2,480) is the key “bull vs bear” session decision level — staying above it generally suggests bulls are in control.
⚠️ Quick Risk Notes
These are intraday technical levels, not investment advice.
Stock prices can move fast; levels won’t guarantee direction.
Combine with volume and real‑time charts for best intraday decisions.

DATAPATTNS 1 Week time Frame 📌 Current Price Snapshot (Live / Latest Data)
Data Patterns (India) Ltd price (approx): ~ ₹2,592 — ₹2,620 per share (NSE) based on latest trading session updates.
52‑Week Range:
• High: ₹3,268.80
• Low: ₹1,351.15
📈 Weekly Pivot & Levels (classic method)
Level Price (Approx)
Weekly Pivot (central) ₹2,943.7
Weekly R1 ₹3,277.0
Weekly R2 ₹3,453.4
Weekly R3 ₹3,786.7
Weekly S1 ₹2,767.3
Weekly S2 ₹2,433.9
Weekly S3 ₹2,257.6
🔁 Weekly Fibonacci Pivot Levels (Alternate)
Level Price (Approx)
Weekly Pivot (Fibo) ₹2,943.7
R1 (Fib) ₹3,138.4
R2 (Fib) ₹3,258.7
R3 (Fib) ₹3,453.4
S1 (Fib) ₹2,748.9
S2 (Fib) ₹2,628.7
S3 (Fib) ₹2,433.9
📌 Quick Weekly Levels Summary
Current level (approx): ₹2,592 – ₹2,620
Weekly Pivot: ~₹2,943
Weekly Resistance 1: ~₹3,277
Weekly Resistance 2: ~₹3,453
Weekly Support 1: ~₹2,767
Weekly Support 2: ~₹2,433
Weekly Support 3: ~₹2,258

Part 1 Technical Analysis Vs Institution Option Trading What Are Options?
Options are contracts, not shares.
They give you a right (not an obligation) to buy or sell an underlying asset—usually a stock or index—at a predetermined price.
You do not own the stock, you only trade the contract.
Options derive their value from something else → an index (Nifty, Bank Nifty), stock (Reliance, TCS), or commodities (gold).
Therefore, they are called “derivatives.”
Two basic types:
Call Option (CE) → Right to buy
Put Option (PE) → Right to sell
You can either Buy or Sell (Write) both types.
Option trading allows profits in up, down, and sideways markets.
