AI-Powered Algorithmic Trading1. Introduction – What is AI-Powered Algorithmic Trading?
Algorithmic trading (or “algo trading”) refers to the use of computer programs to automatically execute trades based on pre-defined rules. Traditionally, these rules might be based on technical indicators, price movements, or arbitrage opportunities.
AI-powered algorithmic trading takes this a step further by introducing artificial intelligence—especially machine learning (ML) and deep learning—to allow trading systems to learn from historical and real-time market data, adapt to changing market conditions, and make predictive, dynamic decisions.
Instead of rigid “if price crosses moving average, buy” rules, AI systems can detect patterns, correlations, and anomalies that humans or static programs might miss.
2. Evolution of Algorithmic Trading to AI-Driven Models
The journey from traditional algorithmic trading to AI-powered systems can be broken down into four stages:
Rule-Based Algorithms (Pre-2000s)
Simple if/then conditions.
Focused on execution speed, arbitrage, and basic market-making.
Statistical & Quantitative Models (2000–2010)
Regression models, time-series forecasting, and quantitative finance techniques.
Still deterministic, but more math-heavy.
Machine Learning Integration (2010–2020)
Use of ML algorithms (random forests, SVMs, gradient boosting) for predictive analysis.
Trading bots capable of adjusting based on new data.
Deep Learning & Reinforcement Learning (2020–present)
Neural networks (CNNs, LSTMs) for complex market pattern recognition.
Reinforcement learning for strategy optimization through trial and error.
Integration with alternative data (social media sentiment, satellite images, news feeds).
3. Core Components of AI-Powered Trading Systems
An AI-driven trading system typically consists of:
3.1 Data Pipeline
Market Data – Price, volume, order book depth, volatility.
Fundamental Data – Earnings reports, macroeconomic indicators.
Alternative Data – Social sentiment, satellite imagery, weather, Google search trends.
Data Cleaning & Preprocessing – Handling missing values, removing noise.
3.2 Model Development
Feature Engineering – Creating input variables from raw data.
Model Selection – Choosing between ML models (e.g., XGBoost, LSTM, Transformers).
Training & Validation – Using historical data for supervised learning, walk-forward testing.
3.3 Strategy Execution
Signal Generation – Buy, sell, or hold decisions based on model outputs.
Risk Management – Stop-loss, position sizing, portfolio rebalancing.
Order Execution Algorithms – VWAP, TWAP, POV, smart order routing.
3.4 Monitoring & Optimization
Real-Time Performance Tracking – Comparing live results vs. backtests.
Model Retraining – Updating with new market data to prevent overfitting.
Error Handling – Fail-safes for market anomalies or connectivity issues.
4. How AI Learns to Trade
AI learns in trading using three primary methods:
4.1 Supervised Learning
Goal: Predict future prices, returns, or direction based on labeled historical data.
Example: Feed the model past OHLC (Open, High, Low, Close) prices and ask it to predict tomorrow’s close.
4.2 Unsupervised Learning
Goal: Detect hidden patterns or clusters in data without labeled outcomes.
Example: Group stocks with similar volatility or correlation profiles for pair trading.
4.3 Reinforcement Learning (RL)
Goal: Learn optimal trading strategies via trial and error.
Example: RL agent receives rewards for profitable trades and penalties for losses, improving its decision-making over time.
5. Types of AI-Powered Trading Strategies
5.1 Predictive Price Modeling
Using historical data to forecast future price movements.
Often employs LSTMs or Transformers for time-series forecasting.
5.2 Market Making with AI
Continuously quoting buy/sell prices, adjusting spreads dynamically using AI predictions of short-term volatility.
5.3 Sentiment-Based Trading
AI analyzes Twitter, Reddit, news feeds to gauge public sentiment and predict market reactions.
5.4 Statistical Arbitrage
AI identifies temporary mispricings between correlated assets and executes mean-reverting trades.
5.5 Event-Driven AI Trading
AI reacts instantly to earnings announcements, mergers, or geopolitical news.
5.6 Reinforcement Learning Agents
Self-improving trading bots that adapt to market conditions without explicit human rules.
6. Real-World Applications
6.1 Hedge Funds
Quant funds like Renaissance Technologies use AI to detect micro-patterns invisible to human traders.
6.2 High-Frequency Trading (HFT) Firms
AI reduces latency in trade execution, managing millions of trades daily.
6.3 Retail Platforms
AI-powered robo-advisors suggest portfolio changes for individual investors.
6.4 Crypto Markets
AI-driven bots handle 24/7 volatility in crypto exchanges.
7. Advantages of AI in Trading
Pattern Recognition Beyond Human Capacity – Can process millions of data points per second.
Adaptive Strategies – Models adjust to new regimes (bull, bear, sideways markets).
Speed & Automation – Faster decision-making and execution than manual trading.
Diversification – AI can monitor multiple markets simultaneously.
Reduced Emotional Bias – No fear or greed, only data-driven decisions.
8. Challenges & Risks
8.1 Overfitting
AI may learn patterns that only existed in the training dataset.
8.2 Black Box Problem
Deep learning models are hard to interpret, making risk management tricky.
8.3 Market Regime Shifts
AI trained on bull market data may fail in sudden bear markets.
8.4 Data Quality Issues
Garbage in, garbage out – poor data leads to bad trades.
8.5 Regulatory Risks
Compliance with SEBI, SEC, MiFID II regulations for AI usage in trading.
9. Building Your Own AI Trading Bot – Step-by-Step
Choose a Market – Equities, Forex, Crypto, Commodities.
Collect Historical Data – API feeds from exchanges or vendors.
Preprocess Data – Clean, normalize, create technical indicators.
Select an AI Model – Start simple (logistic regression) → progress to LSTMs.
Backtest the Strategy – Simulate trades on historical data.
Paper Trade – Test in a live environment without risking capital.
Go Live with Risk Controls – Implement stop-loss, position sizing.
Continuous Monitoring & Retraining – Avoid model drift.
10. The Future of AI-Powered Algorithmic Trading
Explainable AI (XAI) – To make decisions more transparent for regulators.
Quantum Computing Integration – Faster optimization and pattern recognition.
Multi-Agent Systems – Multiple AI agents collaborating or competing in markets.
More Alternative Data Sources – IoT devices, ESG scores, real-time supply chain data.
AI-Driven Market Regulation – Governments may deploy AI to monitor market stability.
Conclusion
AI-powered algorithmic trading represents the next evolutionary step in financial markets—one where speed, adaptability, and intelligence define success. While it brings enormous potential for profit and efficiency, it also demands rigorous testing, robust risk controls, and continuous adaptation.
In the future, the best traders may not be the ones with the best intuition, but the ones who train the best AI systems.
Trading
Zero-Day Options Trading 1. Introduction
In recent years, one segment of the options market has gone from a niche tool for sophisticated traders to one of the hottest topics in global finance — Zero-Day-to-Expiration (0DTE) options. These contracts are bought and sold on the same day they expire, creating ultra-short-term opportunities for traders who want to profit from intraday price swings.
Unlike traditional options, where you might have days, weeks, or months until expiration, 0DTE options give you mere hours or even minutes to make your move.
Think of it like speed chess versus a long tournament game — fast, intense, and unforgiving.
2. What Are 0DTE Options?
2.1 Definition
A Zero-Day Option is an option contract that expires on the same trading day you buy or sell it. It can be:
Call option – gives the right to buy the underlying asset at a set price before the market closes.
Put option – gives the right to sell the underlying asset at a set price before the market closes.
Once the closing bell rings, the contract either:
Expires worthless (if out-of-the-money), or
Is settled for intrinsic value (if in-the-money).
2.2 Where They Trade
0DTE options are most common in:
Index options – S&P 500 (SPX), Nasdaq-100 (NDX), Russell 2000 (RUT)
ETF options – SPY (S&P 500 ETF), QQQ (Nasdaq ETF), IWM (Russell ETF)
Single stock options – on earnings days, when volatility is high.
The SPX index options have daily expirations — meaning every day is potentially a 0DTE day.
3. Why 0DTE Has Exploded in Popularity
3.1 More Expiration Dates
Until recently, most options expired monthly or weekly. Exchanges introduced daily expirations in SPX, then in other major indexes, giving traders constant opportunities.
3.2 Intraday Volatility
Markets have become more headline-driven. Inflation numbers, Fed announcements, or geopolitical events can move indexes significantly within hours — perfect for 0DTE traders.
3.3 Low Capital Requirement
Since 0DTE options have almost no time value, they are cheap to buy (sometimes under $1 per contract), making them attractive for small traders.
3.4 High Leverage Potential
A small intraday move in the index can turn a $50 position into $500 within minutes — but the reverse is also true.
4. How 0DTE Options Work – The Mechanics
4.1 The Time Decay Factor
The biggest difference between 0DTE and normal options is Theta decay.
Theta measures how fast an option loses value with time. In 0DTE, time decay isn’t a slow leak — it’s a freefall.
Example:
SPX is at 4500 at 10:00 AM.
You buy a 4510 call for $3.00.
By 3:00 PM, if SPX is still at 4500, that call is worth zero.
4.2 Greeks in 0DTE
Delta – Measures how much the option price changes with a $1 move in the underlying.
In 0DTE, Delta can shift rapidly from 0.1 to 0.9 in minutes.
Gamma – Measures how fast Delta changes. Gamma is highest on expiration day, making 0DTE explosive.
Theta – Extremely high in 0DTE. The clock is your biggest enemy if you’re a buyer.
Vega – Low in absolute terms (since time is short), but implied volatility changes can still swing prices.
4.3 Settlement
Index options (SPX) are cash-settled — no shares change hands, you just get the difference in cash.
ETF & stock options are physically settled — you might end up buying or selling shares if you don’t close the position.
5. Who Trades 0DTE Options
Day Traders – Use them for quick speculative bets.
Scalpers – Aim for tiny, rapid profits.
Institutional Hedgers – Adjust market exposure for a single day.
Algorithmic Traders – Exploit micro-movements using high-frequency models.
Income Traders – Sell premium in 0DTE options to profit from rapid decay.
6. Key Strategies for 0DTE Trading
6.1 Buying Calls or Puts (Directional Bet)
When to Use: Expect a big move in one direction (Fed announcement, CPI release).
Example: Buy SPY 0DTE 440 Call for $1.50. If SPY jumps to 443, it might be worth $3–$5.
Pros: High reward potential.
Cons: Time decay kills you fast if wrong.
6.2 Vertical Spreads
Buy one option and sell another at a different strike, same expiry.
Purpose: Lower cost, limit risk.
Example: Buy SPX 4500 Call, Sell SPX 4510 Call.
6.3 Iron Condors
Sell both a call spread and a put spread far from current price.
Purpose: Profit from market staying in a range.
Advantage: Time decay works for you.
Risk: Big loss if market breaks out sharply.
6.4 Credit Spreads
Sell options near the money and buy protection further away.
Many traders sell 0DTE credit spreads for high win rates (but lower profit per trade).
6.5 Straddles & Strangles
Buy both calls and puts to bet on big volatility without picking direction.
Great for days with scheduled news events.
6.6 Scalping Premium
Sell expensive options early in the day, buy back cheaper later as time decay kicks in.
7. Risks of 0DTE Options
7.1 Total Loss Probability
If buying, it’s common for 0DTE options to expire worthless.
7.2 High Emotional Stress
Minutes can mean thousands gained or lost — not ideal for undisciplined traders.
7.3 Liquidity & Spreads
Bid-ask spreads can be wide, especially in less popular strikes.
7.4 Gamma Risk for Sellers
If you sell near-the-money options, a sudden move can cause large losses quickly.
8. Risk Management in 0DTE Trading
Position Sizing – Risk a small % of account per trade.
Pre-defined Stop Loss – Use mental or hard stops.
Take Partial Profits – Scale out when gains come fast.
Avoid Revenge Trading – Losses are part of the game.
Avoid Holding to Close – Volatility near the close can be chaotic.
9. Example Trade Walkthrough
Let’s say it’s Wednesday, 10:00 AM and SPX is at 4500.
You expect the market to rally after the Fed announcement at 2:00 PM.
You buy the SPX 4510 Call (0DTE) for $2.50.
2:15 PM: SPX jumps to 4525 — your option is worth $15.
You sell for a 500% gain.
If instead SPX had stayed at 4500, by 4:00 PM that option would be worth $0.
10. Impact of 0DTE on the Market
10.1 Increased Intraday Volatility
Large option hedging flows can push markets around.
10.2 Dealer Positioning
Dealers selling options must hedge rapidly (gamma hedging), which can amplify moves.
10.3 “Crash Insurance”
Institutions can quickly hedge portfolios without buying long-term options.
Conclusion
0DTE options are the Formula 1 racing of trading — fast, high-stakes, and not for everyone. For those with discipline, strategy, and risk control, they can be a powerful tool. For the unprepared, they can be a rapid drain on capital.
They reward precision and timing more than any other options strategy. If you step into the 0DTE arena, do so with respect for the speed and risk involved.

Part3 Learn Instituitional Trading Option Trading in India (NSE)
Popular Instruments:
Nifty 50 Options
Bank Nifty Options
Stock Options (like Reliance, HDFC Bank, Infosys)
FINNIFTY, MIDCPNIFTY
Lot Sizes:
Each option contract has a fixed lot size. For example, Nifty has a lot size of 50.
Margins:
If you buy options, you pay only the premium. But selling options requires high margins (due to unlimited risk).
Risks in Options Trading
While options are powerful, they carry specific risks:
1. Time Decay (Theta)
OTM options lose value fast as expiry nears.
2. Volatility Crush
A sudden drop in volatility (like post-earnings) can cause option premiums to collapse.
3. Illiquidity
Some stock options may have low volumes, making them harder to exit.
4. Assignment Risk
If you’ve sold options, especially ITM, you may be assigned early (in American-style options).
5. Unlimited Loss for Sellers
Option writers (sellers) face potentially unlimited loss (especially naked calls or puts).

Part1 Ride The Big MovesTypes of Option Traders
1. Speculators
They aim to profit from market direction using options. Their goal is capital gain.
2. Hedgers
They use options to protect investments from unfavorable price movements.
3. Income Traders
They sell options to earn premium income.
Option Trading Strategies
1. Basic Strategies
A. Buying Calls (Bullish)
Used when you expect the stock to rise.
B. Buying Puts (Bearish)
Used when expecting a stock to fall.
C. Covered Call (Neutral to Bullish)
Own the stock and sell a call option. Earn premium while holding the stock.
D. Protective Put (Insurance)
Own the stock and buy a put option to limit losses.

Part11 Trading MasterclassHow Options Work
Let’s break this down with an example.
Call Option Example:
You buy a call option on Stock A with a strike price of ₹100, paying a premium of ₹5. If the stock price rises to ₹120, you can buy it for ₹100 and sell it for ₹120—earning a ₹20 profit per share, minus the ₹5 premium, netting ₹15.
If the stock stays below ₹100, you simply let the option expire. Your loss is limited to the ₹5 premium.
Put Option Example:
You buy a put option on Stock A with a strike price of ₹100, paying a ₹5 premium. If the stock falls to ₹80, you can sell it for ₹100—earning ₹20, minus ₹5 premium = ₹15 profit.
If the stock stays above ₹100, the option expires worthless. Again, your loss is limited to ₹5.
Why Trade Options?
A. Leverage
Options require a smaller initial investment compared to buying stocks, but they can offer significant returns.
B. Risk Management (Hedging)
Options can hedge against downside risk. For example, if you own shares, buying a put option can protect you against losses if the price falls.
C. Income Generation
Writing (selling) options like covered calls can generate consistent income.
D. Strategic Flexibility
You can profit in bullish, bearish, or neutral markets using different strategies.

Part12 Trading MasterclassIntroduction to Options Trading
Options trading is one of the most powerful tools in financial markets. Unlike traditional stock trading, where you buy and sell shares directly, options give you the right but not the obligation to buy or sell an asset at a predetermined price before a specific date. This flexibility allows traders to hedge risks, generate income, and speculate on price movements with limited capital.
In recent years, options trading has seen a surge in popularity, especially among retail investors. With the growth of online trading platforms and educational resources, more traders are exploring this complex yet rewarding field.
What Is an Option?
An option is a financial derivative contract. It derives its value from an underlying asset—commonly a stock, index, ETF, or commodity.
There are two types of options:
Call Option: Gives the holder the right to buy the asset at a fixed price (strike price) before or on the expiry date.
Put Option: Gives the holder the right to sell the asset at a fixed price before or on the expiry date.
Key Terms to Know:
Strike Price: The price at which the option can be exercised.
Premium: The price paid to purchase the option.
Expiration Date: The last date on which the option can be exercised.
Underlying Asset: The financial instrument (like a stock) the option is based on.
In the Money (ITM): When exercising the option would be profitable.
Out of the Money (OTM): When exercising the option would not be profitable.
At the Money (ATM): When the strike price is equal to the market price.

Part5 Institutional Trading How Options Work
Let’s break this down with an example.
Call Option Example:
You buy a call option on Stock A with a strike price of ₹100, paying a premium of ₹5. If the stock price rises to ₹120, you can buy it for ₹100 and sell it for ₹120—earning a ₹20 profit per share, minus the ₹5 premium, netting ₹15.
If the stock stays below ₹100, you simply let the option expire. Your loss is limited to the ₹5 premium.
Put Option Example:
You buy a put option on Stock A with a strike price of ₹100, paying a ₹5 premium. If the stock falls to ₹80, you can sell it for ₹100—earning ₹20, minus ₹5 premium = ₹15 profit.
If the stock stays above ₹100, the option expires worthless. Again, your loss is limited to ₹5.
Why Trade Options?
A. Leverage
Options require a smaller initial investment compared to buying stocks, but they can offer significant returns.
B. Risk Management (Hedging)
Options can hedge against downside risk. For example, if you own shares, buying a put option can protect you against losses if the price falls.
C. Income Generation
Writing (selling) options like covered calls can generate consistent income.
D. Strategic Flexibility
You can profit in bullish, bearish, or neutral markets using different strategies.

XAUUSD Gold Trading Strategy August 8, 2025XAUUSD Gold Trading Strategy August 8, 2025:
Gold prices have approached the 340x area and have fallen sharply to the 338x support area at the beginning of today's trading session.
Basic news: President Trump announced to double tariffs on Indian goods to 50% in response to continued oil imports from Russia. Reports show that Trump may meet with Russian President Vladimir Putin as early as next week.
Technical analysis: Gold prices are currently in an uptrend channel, but the trading range is showing signs of narrowing. The possibility that the price will correct at this 340x area is very high; if the gold price creates a double peak pattern in the H1 frame, the price range of 3375 - 3380 will confirm the pattern and create a strong downward force for the gold price. If gold forms a double top pattern here, this correction could take gold to the 3350 or even 3330 area.
Important price zones today: 3375 - 3380, 3405 - 3410 and 3420 - 3425.
Today's trading trend: SELL.
Recommended orders:
Plan 1: SELL XAUUSD zone 3407 - 3409
SL 3412
TP 3404 - 3394 - 3374 - 3354.
Plan 2: SELL XAUUSD zone 3423 - 3425
SL 3428
TP 3420 - 3410 - 3390 - 3370.
Plan 3: BUY XAUUSD zone 3375 - 3377
SL 3372
TP 3380 - 3390 - 3400.
Wish you a safe, successful and profitable trading weekend.🌟🌟🌟🌟🌟

Part9 Trading MasterclassRisk Management in Strategies
Never sell naked calls unless fully hedged.
Position size to avoid overexposure.
Use stop-loss or delta hedging.
Monitor implied volatility — don’t sell cheap, don’t buy expensive.
Strategy Selection Framework
Market View: Bullish, Bearish, Neutral, Volatile?
Volatility Level: High IV (sell premium), Low IV (buy premium).
Capital & Risk Tolerance: Large capital allows complex spreads.
Time Frame: Short-term events vs. long-term trends.
Common Mistakes to Avoid
Trading without an exit plan.
Ignoring liquidity (wide bid-ask spreads hurt).
Selling options without understanding margin.
Overtrading during high emotions.
Not adjusting when market changes.

Part8 Trading MasterclassIntroduction to Options Trading Strategies
Options are like the “Swiss army knife” of the financial markets — flexible tools that can be shaped to fit bullish, bearish, neutral, or volatile market views. They’re contracts that give you the right, but not the obligation, to buy or sell an asset at a specific price (strike) on or before a certain date (expiry).
While most beginners think options are just for making huge leveraged bets, seasoned traders use strategies — combinations of buying and selling calls and puts — to control risk, generate income, or hedge portfolios.
Why Use Strategies Instead of Simple Buy/Sell?
Risk Management: You can cap your losses while keeping upside potential.
Income Generation: Strategies like covered calls and credit spreads generate consistent cash flow.
Direction Neutrality: You can profit even when the market moves sideways.
Volatility Play: You can design trades to profit from expected volatility spikes or drops.
Hedging: Protect stock holdings against adverse moves.

Thematic trading1. Introduction to Thematic Trading
Thematic trading is the art (and science) of building investment or trading positions based on a central, long-term theme rather than just stock-specific fundamentals or short-term technical signals.
Instead of asking “Which stock will go up tomorrow?”, thematic traders ask:
“What big trend or theme will reshape markets over the next months or years, and which assets will benefit from it?”
This approach isn’t about chasing random hot tips; it’s about riding waves created by structural economic, social, technological, or geopolitical changes.
Examples of past and present themes:
Renewable Energy Transition – Solar, wind, battery storage.
Artificial Intelligence Boom – AI software, chipmakers, data infrastructure.
Electric Vehicles (EV) Revolution – Tesla, BYD, lithium miners.
Aging Population – Healthcare tech, pharmaceuticals, retirement services.
De-Dollarization – Gold, emerging market currencies.
A thematic trader tries to identify such trends before they become “obvious” to everyone, allowing them to capture significant price moves.
2. How Thematic Trading Differs from Other Approaches
To understand thematic trading, it helps to contrast it with traditional strategies:
Approach Focus Time Horizon Core Question
Technical Trading Charts, price patterns, indicators Short–Medium “Where will price move based on market patterns?”
Fundamental Investing Company earnings, valuation, balance sheet Medium–Long “Is this company undervalued?”
Thematic Trading Structural macro trends & sector-wide catalysts Medium–Long (weeks to years) “Which assets benefit from a large, ongoing shift?”
Unlike purely technical traders, thematic traders don’t care about every short-term fluctuation.
Unlike pure fundamentalists, they don’t need a stock to be “cheap” — it just needs to ride the right wave.
3. Core Elements of Thematic Trading
Thematic trading is not guesswork — it has four main building blocks:
A. Identifying the Theme
The idea: A technology, trend, regulation, or global shift that can influence markets.
Sources: Economic reports, tech innovation cycles, policy announcements, consumer behavior shifts, social trends.
Example: The “Green Hydrogen Economy” theme emerged from global climate commitments and renewable energy breakthroughs.
B. Mapping the Value Chain
Ask: “Which companies or assets directly or indirectly benefit?”
Break it down into tiers:
Core Beneficiaries – Directly part of the trend (e.g., hydrogen electrolyzer manufacturers).
Enablers – Suppliers or technology providers (e.g., hydrogen fuel tank makers).
Secondary Beneficiaries – Indirectly benefit from the trend (e.g., shipping companies transporting hydrogen).
C. Timing the Trade
Even a great theme can lose money if entered at the wrong time.
Use macro cycle analysis, technical indicators, and market sentiment gauges to decide when to enter.
Example: EV theme was correct in 2018, but Tesla’s huge run came mainly after mid-2019 when sentiment and demand aligned.
D. Risk & Exit Strategy
Themes can fade faster than expected.
Have clear stop-loss levels or theme invalidation criteria (e.g., if a new regulation bans the technology, exit immediately).
Avoid overconcentration — diversify across related plays.
4. Types of Themes in Thematic Trading
Themes can be classified based on their origin:
A. Technology-Driven Themes
Arise from innovation cycles.
Examples: AI, quantum computing, blockchain, 5G, biotech.
B. Demographic & Social Themes
Driven by population and behavior shifts.
Examples: Aging population → healthcare; Gen Z preferences → social media stocks.
C. Environmental & Energy Themes
Focus on climate change adaptation, clean energy, resource scarcity.
Examples: ESG investing, EVs, battery metals.
D. Macro-Economic & Policy Themes
Based on government actions, monetary policy, trade wars.
Examples: Infrastructure spending bills → cement & steel stocks; rate cuts → growth stocks.
E. Geopolitical & Security Themes
Triggered by conflicts, alliances, or national security concerns.
Examples: Defense contractors during global tension; energy security post-Russia-Ukraine war.
5. How to Identify Strong Themes
The magic of thematic trading lies in catching the theme early. Here’s a systematic approach:
A. Track Megatrends
Use reports from McKinsey, PwC, IMF, World Bank.
Follow innovation trackers (CB Insights, Crunchbase).
Watch patent filings for clues to emerging tech.
B. Follow Capital Flows
Where institutional money flows, trends follow.
Monitor ETF launches — a new “Space Exploration ETF” means the theme has institutional interest.
C. Monitor Policy Changes
Example: India’s PLI Scheme (Production Linked Incentive) boosted domestic manufacturing plays.
D. Social Media & Public Sentiment
Twitter, Reddit, LinkedIn often discuss new trends before mainstream media.
6. Thematic Trading Strategies
Here are the core ways traders implement thematic ideas:
A. Stock Picking Within the Theme
Identify the top beneficiaries in the sector.
Balance between leaders (stable growth) and emerging players (higher risk/reward).
B. ETF-Based Thematic Trading
If you don’t want to pick individual stocks, thematic ETFs (e.g., ARK Innovation, Global X Robotics) offer ready-made baskets.
C. Options & Derivatives
Play themes with calls for upside or puts for hedging.
Example: Buy call options on semiconductor stocks ahead of an AI boom.
D. Pair Trading
Long on theme winners, short on those likely to lose.
Example: Long renewable energy stocks, short traditional coal producers.
E. Multi-Asset Thematic Plays
Sometimes the theme extends beyond equities:
Commodities (e.g., lithium for EVs).
Currencies (e.g., yen weakening from Japan’s demographic shift).
Crypto (e.g., blockchain-based financial solutions).
7. Role of Technical Analysis in Thematic Trading
While themes are fundamentally driven, technical analysis helps with:
Entry & Exit Timing: Use moving averages, breakout patterns, RSI.
Confirming Momentum: Volume surges can indicate institutional buying into a theme.
Avoiding FOMO Entries: Themes can get overheated; technical tools prevent buying tops.
Example:
In the AI rally of 2023, Nvidia broke above a long-term resistance with huge volume — a strong technical confirmation of the theme’s momentum.
8. Thematic Trading Time Horizons
Short-Term Thematic Plays (Weeks–Months)
Triggered by immediate events (e.g., new regulation, product launch).
Example: Pharma rally after FDA approval.
Medium-Term (Months–1 Year)
Driven by industry growth cycles.
Example: EV infrastructure rollout over a year.
Long-Term (Years)
Megatrends like AI or climate change.
Requires patience and conviction.
Final Thoughts
Thematic trading is like surfing:
You don’t control the wave, but you can ride it — if you spot it early, position yourself correctly, and know when to jump off.
It combines macro insight, sector analysis, and technical timing, making it one of the most exciting and potentially profitable approaches in modern trading.
But remember: every theme has a life cycle. The best thematic traders are not those who pick the most themes — but those who know when to enter, scale up, and exit with discipline.
Sector Rotation Strategies1. Introduction to Sector Rotation
In the financial markets, sector rotation is the strategic shifting of investments between different sectors of the economy to capitalize on the varying performance of those sectors during different phases of the economic and market cycle.
The basic premise:
Not all sectors perform equally at the same time.
Economic cycles influence which sectors thrive and which lag.
By positioning capital into the right sectors at the right time, an investor can potentially outperform the overall market.
In practice, sector rotation is a top-down investment approach, starting from macroeconomic conditions → to market cycles → to sector performance → to specific stock selection.
2. Understanding Sectors and Market Cycles
The stock market is divided into 11 primary sectors as classified by the Global Industry Classification Standard (GICS):
Energy – Oil, gas, and related services.
Materials – Mining, chemicals, paper, etc.
Industrials – Manufacturing, aerospace, transportation.
Consumer Discretionary – Retail, luxury goods, entertainment.
Consumer Staples – Food, beverages, household goods.
Healthcare – Pharmaceuticals, biotech, hospitals.
Financials – Banks, insurance, asset managers.
Information Technology (IT) – Software, hardware, semiconductors.
Communication Services – Media, telecom.
Utilities – Electricity, water, gas distribution.
Real Estate – REITs and property developers.
These sectors do not rise and fall together. Instead, they rotate in leadership depending on the stage of the economic cycle.
3. The Economic Cycle and Sector Performance
Sector rotation is deeply connected to the business cycle, which has four broad phases:
Early Expansion (Recovery)
Economy rebounds from a recession.
Interest rates are low, liquidity is high.
Consumer spending begins to rise.
Corporate profits improve.
Leading Sectors: Technology, Consumer Discretionary, Financials.
Mid Expansion (Growth)
Strong GDP growth.
Employment levels are high.
Corporate earnings peak.
Leading Sectors: Industrials, Materials, Energy (as demand rises).
Late Expansion (Peak)
Inflation pressures build.
Central banks raise interest rates.
Growth slows.
Leading Sectors: Energy (inflation hedge), Materials, Consumer Staples, Healthcare.
Contraction (Recession)
GDP falls, unemployment rises.
Consumer spending drops.
Risk assets underperform.
Leading Sectors: Utilities, Consumer Staples, Healthcare (defensive sectors).
Sector Rotation Map
Economic Phase Best Performing Sectors Reason
Early Recovery Tech, Financials, Consumer Discretionary Low rates boost growth stocks
Mid Expansion Industrials, Materials, Energy Demand and capital spending rise
Late Expansion Energy, Materials, Healthcare, Staples Inflation hedging, defensive
Recession Utilities, Consumer Staples, Healthcare Stable cash flows, essential goods
4. Sector Rotation Strategies in Practice
There are two main approaches:
A. Tactical Sector Rotation
Short- to medium-term shifts (weeks to months) based on:
Economic data (GDP growth, inflation, interest rates).
Earnings reports and forward guidance.
Market sentiment indicators.
Technical analysis of sector ETFs and indexes.
Example:
If manufacturing PMI is rising → Industrials & Materials may outperform.
B. Strategic Sector Rotation
Long-term positioning (months to years) based on:
Anticipated shifts in the business cycle.
Structural economic changes (e.g., green energy trend, AI boom).
Demographic trends (aging population → Healthcare demand).
Example:
Positioning into renewable energy over the next decade due to global decarbonization policies.
5. Tools & Indicators for Sector Rotation
Sector rotation isn’t guesswork — it relies on economic, technical, and intermarket analysis.
Economic Indicators:
GDP Growth – High GDP growth favors cyclical sectors; low GDP growth favors defensive sectors.
Interest Rates – Rising rates benefit Financials (banks), hurt rate-sensitive sectors like Real Estate.
Inflation Data (CPI, PPI) – High inflation boosts Energy & Materials.
PMI (Purchasing Managers' Index) – Expanding manufacturing favors Industrials & Materials.
Technical Indicators:
Relative Strength (RS) Analysis – Compare sector ETF performance vs. the S&P 500.
Moving Averages – Identify uptrends/downtrends in sector performance.
Relative Rotation Graphs (RRG) – Visual representation of sector momentum & relative strength.
Market Sentiment Indicators:
Fear & Greed Index – Helps gauge if market is risk-on (cyclicals lead) or risk-off (defensives lead).
VIX (Volatility Index) – High VIX favors defensive sectors.
6. Sector Rotation Using ETFs
The easiest way to implement sector rotation is via sector ETFs.
In the U.S., SPDR offers Select Sector SPDR ETFs:
Sector ETF Ticker
Communication Services XLC
Consumer Discretionary XLY
Consumer Staples XLP
Energy XLE
Financials XLF
Healthcare XLV
Industrials XLI
Materials XLB
Real Estate XLRE
Technology XLK
Utilities XLU
Example Strategy:
Track the top 3 ETFs with the strongest relative strength vs. the S&P 500.
Allocate more capital to them while reducing exposure to underperforming sectors.
Rebalance monthly or quarterly.
7. Historical Examples of Sector Rotation
Example 1 – Post-2008 Recovery
Early 2009: Financials, Tech, Consumer Discretionary surged as markets rebounded from the GFC.
Late 2010–2011: Industrials & Energy took leadership as global growth accelerated.
2012 slowdown: Defensive sectors like Utilities & Healthcare outperformed.
Example 2 – COVID-19 Pandemic
Early 2020 Crash: Utilities, Healthcare, and Consumer Staples outperformed during the panic.
Mid-2020: Tech & Communication Services surged due to remote work and digital adoption.
2021: Energy & Financials surged as the economy reopened and inflation rose.
8. Risks & Challenges in Sector Rotation
While powerful, sector rotation isn’t foolproof.
Challenges:
Timing Risk – Predicting exact cycle turns is hard.
False Signals – Economic indicators can give misleading short-term trends.
Overtrading – Too frequent switching increases costs.
Global Factors – Geopolitics, pandemics, or commodity shocks can disrupt cycles.
Correlation Shifts – Sectors can behave differently than historical patterns.
Example:
In 2023, high interest rates were expected to benefit Financials, but bank failures (SVB collapse) caused underperformance despite the macro setup.
Conclusion
Sector rotation strategies work because capital naturally moves to where growth and safety are perceived.
By understanding:
The economic cycle
Sector behavior in each phase
The right tools & indicators
…investors can align portfolios with the strongest parts of the market at any given time.
However, the strategy requires discipline, patience, and flexibility.
Market cycles can be irregular, and exogenous shocks can disrupt historical patterns. Therefore, sector rotation works best when blended with risk management, diversification, and constant monitoring.
Algorithmic trading 1. Introduction to Algorithmic Trading
Algorithmic trading, often called algo trading or automated trading, is the process of using computer programs to execute trades in financial markets according to a predefined set of rules.
These rules can be based on price, volume, timing, market conditions, or mathematical models. Once set, the algorithm automatically sends orders to the market without manual intervention.
In simple terms:
Instead of sitting in front of a trading screen and clicking “buy” or “sell,” you tell a machine exactly what conditions to look for, and it trades for you.
It’s like giving your brain + discipline to a computer — minus the coffee breaks, panic, and impulsive decisions.
1.1 Why Algorithms?
Humans are prone to:
Emotional bias (fear, greed, hesitation)
Slow reaction times
Fatigue and inconsistency
Computers, in contrast:
Execute instantly (microseconds or nanoseconds)
Follow rules 100% consistently
Handle multiple markets at once
Backtest ideas over years of data within minutes
This explains why algo trading accounts for 70%–80% of trading volume in developed markets like the US and over 50% in Indian markets for certain instruments.
1.2 The Core Components
Every algorithmic trading system consists of:
Strategy Logic – The rules that trigger trades (e.g., moving average crossover, statistical arbitrage).
Programming Interface – The language/platform (Python, C++, Java, MetaTrader MQL, etc.).
Market Data Feed – Real-time price, volume, and order book data.
Execution Engine – Connects to broker/exchange to place orders.
Risk Management Module – Stops, limits, and capital allocation rules.
Performance Tracker – Monitors profit/loss, drawdowns, and execution quality.
2. How Algorithmic Trading Works – Step by Step
Let’s break it down:
Idea Generation
Define a hypothesis: “I think when the 50-day moving average crosses above the 200-day MA, the stock will trend upward.”
Strategy Design
Turn the idea into exact rules: If MA50 > MA200 → Buy; If MA50 < MA200 → Sell.
Coding the Strategy
Program in Python, C++, R, or a broker’s native scripting language.
Backtesting
Run the algorithm on historical data to see how it would have performed.
Paper Trading (Simulation)
Trade in real time with virtual money to test live conditions.
Execution in Live Markets
Deploy with real money, connected to exchange APIs.
Monitoring & Optimization
Adjust based on performance, slippage, and market changes.
2.1 Example of a Simple Algorithm
Pseudocode:
sql
Copy
Edit
If Close Price today > 20-day Moving Average:
Buy 10 units
If Close Price today < 20-day Moving Average:
Sell all units
The computer checks the rule every day (or every minute, or millisecond, depending on design).
3. Types of Algorithmic Trading Strategies
Algo trading is not one-size-fits-all. Traders and funds design algorithms based on their objectives, timeframes, and risk appetite.
3.1 Trend-Following Strategies
Logic: “The trend is your friend.”
Tools: Moving Averages, MACD, Donchian Channels.
Example: Buy when short-term average crosses above long-term average.
Pros: Simple, works in trending markets.
Cons: Suffers in sideways/choppy markets.
3.2 Mean Reversion Strategies
Logic: Prices eventually revert to their mean (average).
Tools: Bollinger Bands, RSI, z-score.
Example: If stock falls 2% below its 20-day average, buy expecting a bounce.
Pros: Works well in range-bound markets.
Cons: Can blow up if the “mean” shifts due to fundamental changes.
3.3 Statistical Arbitrage
Logic: Exploit price inefficiencies between correlated assets.
Example: If Reliance and TCS usually move together but Reliance lags by 1%, buy Reliance and short TCS expecting convergence.
Pros: Market-neutral, less affected by overall market trend.
Cons: Requires high-frequency execution and deep statistical modeling.
3.4 Market-Making Algorithms
Logic: Provide liquidity by continuously posting buy and sell quotes.
Goal: Earn the bid-ask spread repeatedly.
Risk: Adverse selection during sharp market moves.
3.5 Momentum Strategies
Logic: Stocks that move strongly in one direction will continue.
Tools: Breakouts, Volume Surges.
Example: Buy when price breaks a 50-day high with high volume.
3.6 High-Frequency Trading (HFT)
Executes in microseconds.
Focuses on ultra-short-term inefficiencies.
Requires co-location servers near exchanges for speed advantage.
3.7 Event-Driven Algorithms
React to corporate actions or news:
Earnings releases
Mergers & acquisitions
Dividend announcements
Often combined with natural language processing (NLP) to scan news feeds.
4. Technologies Behind Algo Trading
4.1 Programming Languages
Python – Most popular for beginners & research.
C++ – Preferred for HFT due to speed.
Java – Stable for large trading systems.
R – Strong in statistical modeling.
4.2 Data
Historical Data – For backtesting.
Real-Time Data – For live execution.
Level 2/Order Book Data – For order flow analysis.
4.3 APIs & Broker Platforms
REST APIs – Easy to use but slightly slower.
WebSocket APIs – Low latency, real-time streaming.
FIX Protocol – Industry standard for institutional trading.
4.4 Infrastructure
Cloud Hosting – AWS, Google Cloud.
Dedicated Servers – For low latency.
Co-location – Servers physically near exchange data centers.
5. Advantages of Algorithmic Trading
Speed – Executes in microseconds.
Accuracy – Removes manual entry errors.
Backtesting – Test before risking real money.
Consistency – No emotional bias.
Multi-Market Trading – Monitor dozens of assets simultaneously.
Scalability – Once built, can trade large portfolios.
6. Risks & Challenges in Algo Trading
6.1 Market Risks
Model Overfitting: Works perfectly on past data but fails live.
Regime Changes: Strategies die when market structure shifts.
6.2 Technical Risks
Connectivity Issues
Data Feed Errors
Exchange Downtime
6.3 Execution Risks
Slippage – Orders filled at worse prices due to latency.
Front Running – Competitors' algorithms act faster.
6.4 Regulatory Risks
Many countries have strict algo trading regulations:
SEBI in India requires pre-approval for certain algos.
SEC & FINRA in the US enforce strict monitoring.
7. Backtesting & Optimization
7.1 Steps for Backtesting
Choose historical data range.
Apply your strategy rules.
Measure key metrics:
CAGR (Compound Annual Growth Rate)
Sharpe Ratio
Max Drawdown
Win/Loss Ratio
7.2 Common Pitfalls
Look-Ahead Bias: Using future data unknowingly.
Survivorship Bias: Ignoring stocks that delisted.
Over-Optimization: Tweaking too much to fit past data.
8. Case Study – Moving Average Crossover Algo
Imagine we test a 50-day vs 200-day MA crossover strategy on NIFTY 50 from 2010–2025.
Capital: ₹10,00,000
Buy Rule: MA50 > MA200 → Buy
Sell Rule: MA50 < MA200 → Sell
Results:
CAGR: 11.2%
Max Drawdown: 18%
Trades: 42 over 15 years
Win Rate: 57%
Conclusion: Low trading frequency, steady returns, low drawdown — suitable for positional traders.
Final Thoughts
Algorithmic trading is not a magic money machine — it’s a discipline that combines mathematics, programming, and market knowledge.
When done right, it can offer speed, precision, and scalability far beyond human capability.
When done wrong, it can cause lightning-fast losses.
The game has evolved from shouting in the trading pit to coding in Python. The traders who adapt, learn, and innovate will keep winning — whether they sit in a Wall Street skyscraper or a small home office in Mumbai.
Avoiding Breakout1. Introduction: The Breakout Trap Problem
Every trader has experienced it at least once:
You spot a price consolidating under resistance for days, weeks, or even months.
A sudden surge of volume pushes the price above that key level. You jump in, convinced it’s the start of a strong trend… only to see the price reverse sharply, plunge back inside the range, and hit your stop-loss.
That, my friend, is a breakout trap — also called a fakeout or bull/bear trap.
Breakout traps frustrate traders because:
They look like high-probability setups.
They lure in traders with emotional urgency (“Fear of Missing Out” – FOMO).
They often happen fast — before you can react.
They are designed (often intentionally) by large players to manipulate liquidity.
The goal here isn’t just to “spot” them, but to understand why they happen and how to trade in a way that avoids getting trapped — or even profits from them.
2. What is a Breakout Trap?
2.1 Definition
A breakout trap occurs when price moves beyond a key technical level (support, resistance, trendline, or chart pattern boundary), attracting breakout traders — only to reverse quickly and invalidate the breakout.
Example:
Bull trap: Price breaks above resistance, lures buyers, then reverses down.
Bear trap: Price breaks below support, lures sellers, then reverses up.
2.2 Why Breakout Traps Exist
Breakout traps aren’t random — they happen because of market structure and order flow.
2.2.1 Liquidity Hunts
Big players (institutions, market makers) need liquidity to execute large orders.
Where’s liquidity? Above swing highs and below swing lows — where stop-losses and breakout orders sit.
When price breaks out:
Retail traders buy.
Short-sellers’ stop-losses trigger, adding buy orders.
Institutions sell into that wave of buying to enter short positions.
Result: Price snaps back inside the range.
2.2.2 Psychological Triggers
FOMO: Traders fear missing “the big move” and enter late.
Confirmation Bias: Traders ignore signs of exhaustion because they “want” the breakout to work.
Pain Points: Stop-loss clusters become magnets for price.
2.3 Common Types of Breakout Traps
False Break above Resistance – quick reversal into the range.
False Break below Support – reversal upward.
Fake Continuation – breakout aligns with trend but fails.
Range Expansion Trap – occurs after tight consolidation.
News-Induced Trap – sudden news spike reverses.
End-of-Session Trap – low liquidity late in the day exaggerates moves.
3. The Mechanics Behind Breakout Traps
To avoid them, you must understand how they form.
3.1 Market Participants in a Breakout
Retail Traders: Enter aggressively on breakouts.
Swing Traders: Have stop-loss orders beyond key levels.
Institutions: Seek liquidity to enter large positions — often fading retail moves.
3.2 Order Flow at a Key Level
Imagine resistance at ₹1,000:
Buy stop orders above ₹1,000 (from shorts covering and breakout traders).
Institutions push price above ₹1,000 to trigger stops.
Price spikes to ₹1,010–₹1,015.
Big players sell into that liquidity.
Price collapses back under ₹1,000.
3.3 Timeframes Matter
Breakout traps occur across all timeframes — from 1-minute charts to weekly charts — but their reliability changes:
Lower Timeframes: More frequent traps, smaller moves.
Higher Timeframes: Bigger consequences if trapped.
4. How to Spot Potential Breakout Traps Before They Happen
4.1 Warning Sign #1: Low Volume Breakouts
A true breakout is supported by strong, sustained volume.
Low-volume breakouts often fail because they lack conviction.
4.2 Warning Sign #2: Overextended Pre-Breakout Move
If price has already rallied hard before breaking out, buyers may be exhausted, making a trap more likely.
4.3 Warning Sign #3: Multiple Failed Attempts
If price has tested a level multiple times but failed to sustain, the breakout could be a liquidity grab.
4.4 Warning Sign #4: Context in the Bigger Picture
Check:
Is this breakout against the higher timeframe trend?
Is it breaking into a major supply/demand zone?
4.5 Warning Sign #5: Divergence with Indicators
If momentum indicators (RSI, MACD) show weakness while price breaks out, that’s suspicious.
5. Proven Methods to Avoid Breakout Traps
5.1 Wait for Confirmation
Don’t enter the breakout candle — wait for:
A retest of the breakout level.
A close beyond the level (especially on higher timeframes).
Sustained volume after the breakout.
5.2 Use the “2-Candle Rule”
If the second candle after breakout closes back inside the range — it’s likely a trap.
5.3 Trade Breakout Retests Instead of Initial Breaks
Safer entry:
Price breaks out.
Pulls back to test the level.
Holds and bounces — enter then.
5.4 Volume Profile & Market Structure Analysis
Look for high-volume nodes — if breakout is into a low-volume area, moves can fail.
Identify liquidity zones — be aware when you’re trading into them.
5.5 Combine with Order Flow Tools
If available, use:
Footprint charts.
Delta volume analysis.
Cumulative volume delta.
These reveal whether big players are supporting or fading the breakout.
5.6 Avoid Breakouts During Low-Liquidity Periods
Lunch hours.
Pre-market or post-market.
Right before major news events.
6. Psychological Discipline to Avoid Traps
Even with technical skills, psychology is key.
6.1 Kill the FOMO
Remind yourself: “If it’s a true breakout, I’ll have multiple entry opportunities.”
Missing one trade is better than losing money.
6.2 Accept Imperfection
You can’t avoid every trap. Focus on probabilities, not perfection.
6.3 Use Smaller Size on Initial Breakouts
This reduces risk if it fails — and lets you add size if it confirms.
6.4 Journal Every Breakout Trade
Track:
Setup conditions.
Entry/exit timing.
Volume profile.
Outcome.
Patterns will emerge showing when breakouts work for you.
7. Turning Breakout Traps into Opportunities
You don’t have to just avoid traps — you can profit from them.
7.1 The “Fade the Breakout” Strategy
When you spot a likely trap:
Wait for breakout failure confirmation (price back inside range).
Enter in opposite direction.
Target the other side of the range.
7.2 Stop-Loss Placement
For fading:
Bull trap → stop above trap high.
Bear trap → stop below trap low.
7.3 Example Trade Setup
Resistance at ₹2,000:
Price spikes to ₹2,015 on low volume.
Quickly falls back under ₹2,000.
Enter short at ₹1,995.
Target ₹1,960 (range low).
8. Real-World Examples of Breakout Traps
We’ll use simplified hypothetical charts here.
8.1 Bull Trap on News
Stock rallies 5% on earnings beat, breaks above resistance.
Next hour, sellers overwhelm — price drops 8% by close.
8.2 Bear Trap Before Trend Rally
Price dips under support on a bad headline, but buyers step in strongly.
Market closes near day high — huge rally next week.
Key Takeaways Checklist
Before entering a breakout trade, ask:
Is the breakout supported by strong volume?
Is it aligned with the higher timeframe trend?
Has price retested the breakout level?
Is the market overall in a trending or choppy phase?
Are institutions supporting or fading the move?
Conclusion
Breakout traps are not bad luck — they’re part of market mechanics.
By understanding liquidity, psychology, and structure, you can avoid most traps and even turn them into opportunities.
Avoiding breakout traps comes down to:
Patience (wait for confirmation).
Context (trade with bigger trend).
Risk Control (manage position size).
Observation (read volume and price action).
A trader who respects these principles will avoid being “the liquidity” for bigger players — and instead trade alongside them.
Smart Money Concepts 1. Introduction to Smart Money Concepts
The financial markets aren’t just a free-for-all where everyone has the same chance of winning. If you’ve ever felt like the market moves against you right after you enter a trade, it’s probably not your imagination. This is where Smart Money Concepts come in — the idea that large, professional market participants (banks, hedge funds, institutions) have both the resources and the incentive to move the market in a way that benefits them… and often at the expense of retail traders.
The goal of SMC trading is to stop following the herd and start trading in alignment with the “smart money” — the institutional order flow that truly drives price movement.
2. Who is the Smart Money?
Smart money refers to the participants with:
Large capital (able to move the market)
Market-making power (often acting as liquidity providers)
Insider knowledge (economic data in advance, order book depth)
Advanced tools (algorithms, AI, high-frequency trading systems)
Examples:
Central banks
Commercial banks
Hedge funds
Institutional asset managers
Proprietary trading firms
Market makers
Their advantages:
Access to better information (they see real liquidity and order flow)
Ability to manipulate price to hunt liquidity
Risk management expertise
Patience — they don’t rush into trades, they wait for key liquidity zones.
3. The Core Philosophy of SMC
SMC focuses less on retail-style indicators (like MACD, RSI) and more on:
Market structure
Liquidity
Order blocks
Fair Value Gaps
Breaker blocks
Institutional order flow
Stop hunts (liquidity grabs)
The key principle is:
Price moves from liquidity to liquidity, driven by institutions filling their large orders.
This means:
Market doesn’t move randomly.
Smart money often manipulates price to take out retail stops before moving in the intended direction.
Your job is to identify their footprints.
4. Understanding Market Structure in SMC
Market structure is the skeleton of price movement. In SMC, we read structure to know where we are in the trend and what smart money is doing.
4.1. Types of Structure
Bullish Market Structure
Higher Highs (HH) and Higher Lows (HL)
Smart money accumulates before pushing higher.
Bearish Market Structure
Lower Lows (LL) and Lower Highs (LH)
Smart money distributes before dropping price.
Consolidation
Sideways movement — often accumulation or distribution phases.
4.2. Market Structure Shifts (MSS)
When the trend changes:
In bullish trend: price breaks below the last HL → bearish MSS.
In bearish trend: price breaks above the last LH → bullish MSS.
MSS is often the first sign of a reversal.
5. Liquidity in SMC
Liquidity = resting orders in the market.
Institutions need liquidity to execute large trades without causing excessive slippage.
5.1. Where Liquidity Exists:
Above swing highs (buy stops)
Below swing lows (sell stops)
Round numbers (psychological levels)
Previous day/week highs & lows
Session highs/lows (London, New York)
Imbalance zones
5.2. Liquidity Hunts (Stop Hunts)
Before moving price in their intended direction, smart money will:
Push price above a recent high → triggering buy stops → fill their sell orders.
Push price below a recent low → triggering sell stops → fill their buy orders.
This shakeout removes retail traders and positions institutions in the opposite direction.
6. Order Blocks
An order block is the last bullish or bearish candle before a strong move.
Why they matter:
They represent areas where institutions placed large positions.
Price often returns to these zones to mitigate orders.
Types of Order Blocks:
Bullish Order Block
Last bearish candle before price rises aggressively.
Acts as demand zone.
Bearish Order Block
Last bullish candle before price drops aggressively.
Acts as supply zone.
Rules:
Price should break market structure after forming the order block.
Volume/impulse should confirm institutional involvement.
7. Fair Value Gaps (FVG)
Also called imbalances — when price moves too quickly, leaving inefficiency in the market.
7.1. How to Spot:
On a 3-candle pattern, if candle 1’s high is below candle 3’s low (in a bullish move), a gap exists in the middle.
7.2. Why Important:
Institutions tend to return to fill these gaps before continuing the move.
FVG acts as a magnet for price.
8. Accumulation & Distribution
This is where smart money quietly builds or unloads positions.
8.1. Accumulation
Occurs in ranges after downtrends.
Characterized by liquidity grabs below support.
Goal: institutions buy without alerting retail traders.
8.2. Distribution
Occurs in ranges after uptrends.
Characterized by liquidity grabs above resistance.
Goal: institutions sell to retail buyers before dropping price.
9. The SMC Trading Process
Let’s break down a step-by-step approach:
Identify Bias
Use higher timeframe market structure to determine bullish/bearish bias.
Mark Liquidity Zones
Previous highs/lows, order blocks, FVGs.
Wait for Liquidity Grab
Smart money often sweeps liquidity before the real move.
Look for Market Structure Shift
A break of structure confirms the reversal or continuation.
Find Entry at Key Level
Often inside order block or FVG after MSS.
Set Stop Loss
Below/above liquidity sweep.
Target Opposite Liquidity Pool
Price moves from one liquidity area to another.
10. Example Trade
Scenario:
EURUSD is in bullish higher timeframe trend.
On 1H chart: price sweeps previous day’s low (grabbing sell-side liquidity).
MSS occurs → break above minor high.
Price returns to bullish order block.
Entry placed, SL below OB, TP at previous high (buy-side liquidity).
Crypto Trading & Blockchain Assets 1. Introduction
Cryptocurrencies and blockchain-based assets have revolutionized how we think about money, finance, and even ownership itself. From Bitcoin's birth in 2009 to the explosion of decentralized finance (DeFi), non-fungible tokens (NFTs), and tokenized real-world assets (RWA), the digital asset market has evolved into a multi-trillion-dollar ecosystem.
But unlike traditional markets, crypto operates 24/7, globally, and with high volatility — which means enormous opportunities and equally significant risks for traders.
In this guide, we’ll explore:
The fundamentals of blockchain technology
Types of blockchain assets
Trading styles, tools, and strategies for crypto
Risk management and psychology
The future outlook of blockchain-based markets
2. Understanding Blockchain Technology
2.1 What is Blockchain?
A blockchain is a distributed, immutable ledger that records transactions across multiple computers in a secure and transparent way. Instead of relying on a single authority like a bank, blockchains are decentralized — no single entity can control or alter the record without consensus.
Key features:
Decentralization – No central authority; control is distributed.
Transparency – Anyone can verify transactions.
Immutability – Once recorded, data can’t be altered without consensus.
Security – Cryptographic encryption ensures safety.
2.2 Types of Blockchains
Public Blockchains – Fully decentralized, open to anyone (e.g., Bitcoin, Ethereum).
Private Blockchains – Restricted access, controlled by a single entity (used in enterprises).
Consortium Blockchains – Controlled by a group of organizations (e.g., supply chain consortia).
Hybrid Blockchains – Combine public transparency with private access controls.
2.3 How Blockchain Enables Crypto Assets
Every blockchain asset — from Bitcoin to NFTs — is essentially a tokenized record on the blockchain. Ownership is proved via private keys (digital signatures) and transactions are verified by consensus mechanisms like:
Proof of Work (PoW) – Mining for Bitcoin.
Proof of Stake (PoS) – Validators stake coins to secure networks (e.g., Ethereum after the Merge).
Delegated Proof of Stake (DPoS) – Voting-based validator system.
3. Types of Blockchain Assets
Blockchain assets fall into several categories, each with unique characteristics:
3.1 Cryptocurrencies
These are digital currencies designed as mediums of exchange.
Examples: Bitcoin (BTC), Litecoin (LTC), Monero (XMR)
Use cases: Payments, remittances, store of value.
3.2 Utility Tokens
Tokens that provide access to a blockchain-based product or service.
Examples: Ethereum (ETH) for gas fees, Chainlink (LINK) for oracle services.
Use cases: Network participation, voting rights, service payments.
3.3 Security Tokens
Blockchain versions of traditional securities like stocks or bonds.
Examples: Tokenized equity shares.
Use cases: Investment with regulatory oversight.
3.4 Stablecoins
Cryptocurrencies pegged to fiat currencies or commodities.
Examples: USDT (Tether), USDC, DAI.
Use cases: Price stability for trading, cross-border transfers.
3.5 NFTs (Non-Fungible Tokens)
Unique digital assets that represent ownership of a specific item.
Examples: Bored Ape Yacht Club, CryptoPunks.
Use cases: Digital art, gaming, collectibles, tokenized property.
3.6 Tokenized Real-World Assets (RWA)
Physical assets represented on blockchain.
Examples: Tokenized gold (PAXG), tokenized real estate.
Use cases: Fractional ownership, liquidity for traditionally illiquid assets.
4. Crypto Trading Basics
4.1 How Crypto Markets Differ from Traditional Markets
24/7 Trading – No closing bell; markets are always active.
High Volatility – Double-digit daily price swings are common.
Global Participation – No national barriers; traders from anywhere can join.
No Central Exchange – Assets can be traded on centralized exchanges (CEXs) or decentralized exchanges (DEXs).
4.2 Major Crypto Exchanges
Centralized (CEX): Binance, Coinbase, Kraken, Bybit.
Decentralized (DEX): Uniswap, PancakeSwap, Curve Finance.
4.3 Crypto Trading Pairs
Assets are traded in pairs:
Crypto-to-Crypto: BTC/ETH, ETH/SOL
Crypto-to-Fiat: BTC/USD, ETH/USDT
5. Types of Crypto Trading
5.1 Spot Trading
Buying and selling actual crypto assets with immediate settlement.
5.2 Margin Trading
Borrowing funds to increase position size. Increases both profit potential and risk.
5.3 Futures & Perpetual Contracts
Betting on price movement without owning the asset. Allows leverage and short selling.
5.4 Options Trading
Trading contracts that give the right, but not the obligation, to buy/sell crypto.
5.5 Arbitrage Trading
Exploiting price differences between exchanges.
5.6 Algorithmic & Bot Trading
Using automated scripts to trade based on set rules.
6. Crypto Trading Strategies
6.1 Day Trading
Short-term trades executed within the same day, exploiting volatility.
6.2 Swing Trading
Holding positions for days or weeks to capture intermediate trends.
6.3 Scalping
Making dozens of trades per day for small profits.
6.4 Trend Following
Riding long-term upward or downward price movements.
6.5 Breakout Trading
Entering trades when price breaks a significant support or resistance level.
6.6 Mean Reversion
Betting that prices will return to historical averages.
7. Technical Analysis for Crypto
7.1 Popular Indicators
Moving Averages (MA)
Relative Strength Index (RSI)
MACD
Bollinger Bands
Fibonacci Retracements
Volume Profile
7.2 Chart Patterns
Bullish: Cup & Handle, Ascending Triangle
Bearish: Head & Shoulders, Descending Triangle
Continuation: Flags, Pennants
8. Fundamental Analysis for Blockchain Assets
8.1 Key Metrics
Market Cap
Circulating Supply
Tokenomics
Development Activity
Adoption & Partnerships
On-chain Metrics – Wallet addresses, transaction count, TVL in DeFi.
8.2 Events Impacting Prices
Protocol upgrades (Ethereum Merge, Bitcoin Halving)
Regulatory announcements
Exchange listings
Partnership news
9. Risk Management in Crypto Trading
9.1 Position Sizing
Risk only 1–2% of your portfolio per trade.
9.2 Stop Loss & Take Profit
Pre-define exit points to avoid emotional decisions.
9.3 Diversification
Spread investments across multiple coins and sectors.
9.4 Avoid Overleveraging
Leverage amplifies both gains and losses.
10. Trading Psychology in Crypto
Discipline over Emotion
Patience in Volatile Markets
Avoiding FOMO and Panic Selling
Sticking to Your Plan
Conclusion
Crypto trading and blockchain assets represent a paradigm shift in finance, offering unmatched transparency, security, and accessibility. For traders, the opportunities are massive — but so are the risks. Success in this space requires knowledge, discipline, and adaptability.
The market will continue to evolve, blending traditional finance with decentralized innovations, and traders who master both the technology and trading discipline will thrive.

Part1 Ride The Big Moves Types of Option Traders
1. Speculators
They aim to profit from market direction using options. Their goal is capital gain.
2. Hedgers
They use options to protect investments from unfavorable price movements.
3. Income Traders
They sell options to earn premium income.
Option Trading Strategies
1. Basic Strategies
A. Buying Calls (Bullish)
Used when you expect the stock to rise.
B. Buying Puts (Bearish)
Used when expecting a stock to fall.
C. Covered Call (Neutral to Bullish)
Own the stock and sell a call option. Earn premium while holding the stock.
D. Protective Put (Insurance)
Own the stock and buy a put option to limit losses.

Part11 Trading Masterclass How Options Work
Let’s break this down with an example.
Call Option Example:
You buy a call option on Stock A with a strike price of ₹100, paying a premium of ₹5. If the stock price rises to ₹120, you can buy it for ₹100 and sell it for ₹120—earning a ₹20 profit per share, minus the ₹5 premium, netting ₹15.
If the stock stays below ₹100, you simply let the option expire. Your loss is limited to the ₹5 premium.
Put Option Example:
You buy a put option on Stock A with a strike price of ₹100, paying a ₹5 premium. If the stock falls to ₹80, you can sell it for ₹100—earning ₹20, minus ₹5 premium = ₹15 profit.
If the stock stays above ₹100, the option expires worthless. Again, your loss is limited to ₹5.
Why Trade Options?
A. Leverage
Options require a smaller initial investment compared to buying stocks, but they can offer significant returns.
B. Risk Management (Hedging)
Options can hedge against downside risk. For example, if you own shares, buying a put option can protect you against losses if the price falls.
C. Income Generation
Writing (selling) options like covered calls can generate consistent income.
D. Strategic Flexibility
You can profit in bullish, bearish, or neutral markets using different strategies.

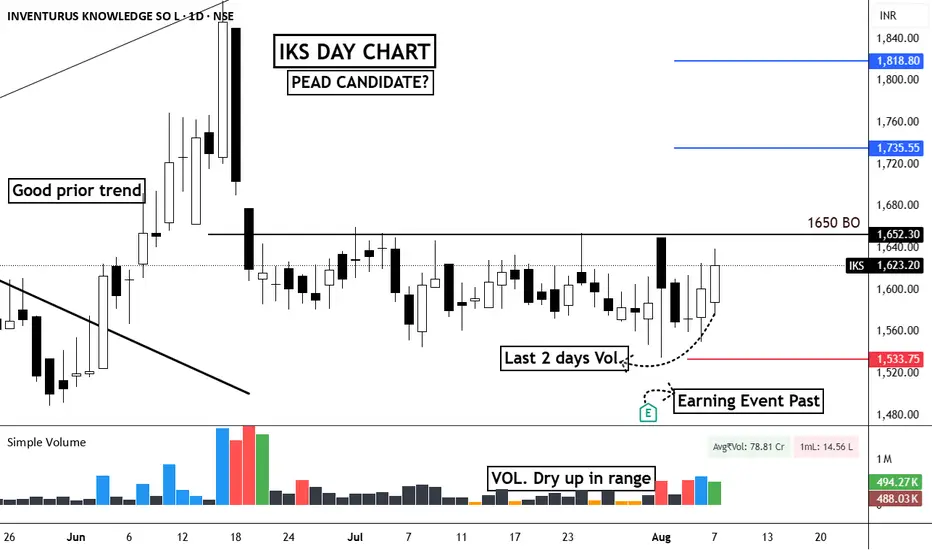
PEAD in Inventurus Knowledge (IKS)EQUITY SWING SETUP 📊
#IKS | Daily Chart Analysis
🔹Structure:-
Price is forming a rounded bottom inside a range, showing Volume Dry-Up during the consolidation phase.
Earnings event is past, reducing uncertainty, and the last two days show pickup in volume, hinting at accumulation.
Key breakout level is ₹1650, above which momentum can accelerate — possible PEAD (Post-Earnings Announcement Drift) candidate.
🟢ENTRY:
Buy above ₹1655 with strong volume confirmation.
♦️RISK:-
Stop Loss: ₹1533 (below recent swing low & support zone)
🎯TARGETS:-
1st Target: ₹1735
2nd Target: ₹1818
📌Detailed Analysis:
Volume dried up significantly during the range, a classic sign of weak hands exiting.
The base is tight, indicating strong hands holding.
Breakout above ₹1650 could trigger a quick momentum burst, especially given the post-earnings context.
Watch for strong volume on breakout day to confirm institutional participation.
📈Mark the levels on your chart and track price behavior near the breakout zone.
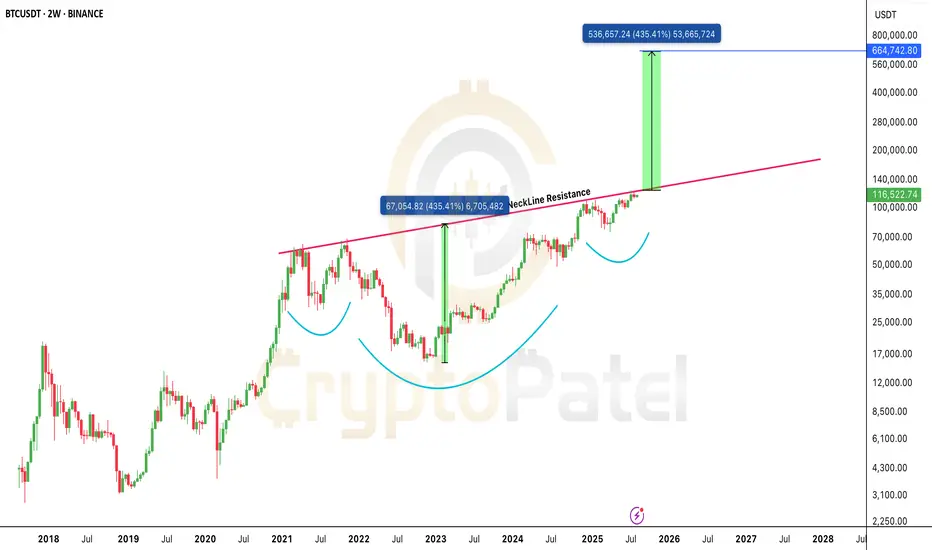
Bitcoin’s $664K Target Is Not a Joke: It’s a Chart-Based WarBitcoin is forming a massive macro structure and the neckline is the final barrier.
Break above it, and the technical target stretches to $664,000.
Yes, you read that right.
This isn’t hopium. It’s based on measured move projections from the breakout zone.
The only question now:
Does BTC explode to $664K this cycle… or in the next?
One breakout changes everything.
Watch the neckline. Stay focused.
Note: NFa & DYOR
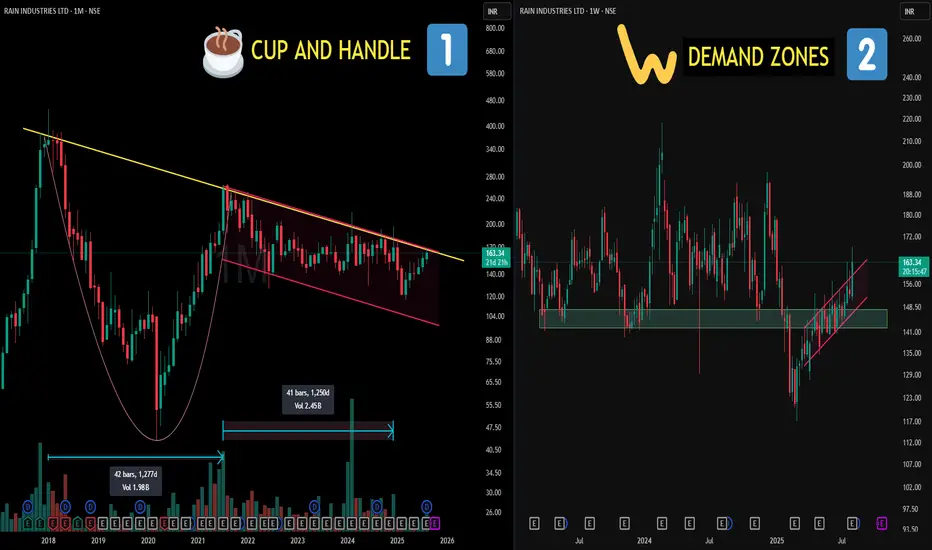
2500 Days of Structure? CUP & HANDLE Decoded!📌Left Side (Chart 1: Monthly TF)
🧠 Cup and Handle Pattern:
A bullish continuation pattern that resembles the shape of a tea cup on longer timeframes. The “cup” shows a gradual rounded bottom (accumulation phase), followed by a smaller downward or sideways "handle" (last shakeout), often before strength resumes. It reflects long-term accumulation and investor confidence.
📈 Cup Duration in this case : 1277 days (approx. 3.5 years)
🧠Parallel Channel (Handle):
A price structure where two trendlines contain price movement within a defined up or down slope. Often marks controlled consolidation or correction — neither side is dominating, until one breaks.
📈 Handle Formation in this case : 1250 days (approx. 3.4 years)
📌 Right Side (Chart 2: Weekly TF)
🧠 This is the zoom lens on the handle zone:
📍A key Demand Zone was breached temporarily… but reclaimed with conviction.
📍 Strong re-acceptance and consolidation followed, showing organized price behavior.
📍 The upper trendline of the parallel channel is where price recently pushed through — again, no forecasting — just a structural breakout from a well-defined zone.
Part4 Institutional Trading Tools & Platforms for Trading Options
Popular Brokers in India:
Zerodha
Upstox
Angel One
Groww
ICICI Direct
Option Analysis Tools:
Sensibull
Opstra
QuantsApp
TradingView (for charting)
NSE Option Chain (for open interest and IV analysis)
Important Metrics in Option Trading
1. Open Interest (OI):
Indicates how many contracts are active. Rising OI with price = strength.
2. Implied Volatility (IV):
Represents market expectation of volatility. High IV = expensive options.
3. Option Chain Analysis:
Used to find support, resistance, and market bias using OI and IV.

KAITO is holding strong - breakout could lead to 500% upside!KAITO is holding strong - breakout could lead to 500% upside!
Price is hovering above a strong accumulation zone ($0.75–$0.90) after hitting the recent bottom at $0.669.
If this base holds, a breakout above the trendline + $1.25 resistance could trigger a bullish move toward:
$2/$3.5/$5+
That’s a 542% upside from the lows.
Watch for breakout confirmation. This setup looks like a Bullish reaccumulation before markup.
Not Financial Advice so DYOR
