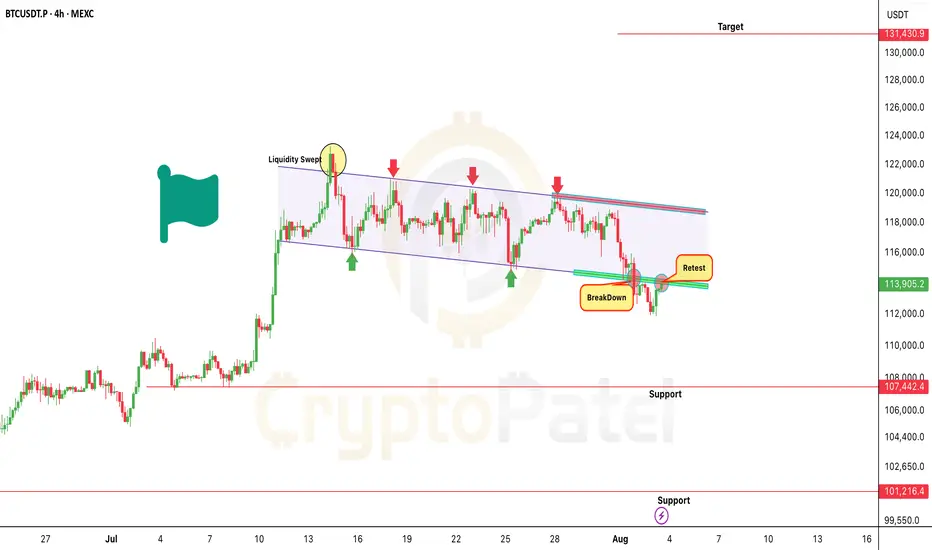
Bitcoin Breakdown or Bull Trap? $100K or $131KAs previously shared CRYPTOCAP:BTC had a potential to tap $114K when it was around $120K.
But now, $114K support has broken, and price is currently trading in the bearish retest zone post-breakdown.
Bearish Targets: $107,000/$101,000
Important Note:
Watch $115,700 zone closely- This could be a liquidity sweep trap.
If any HTF candle (4H/D) closes strongly above $115,700, it invalidates the bearish structure and may flip into a bull flag breakout.
Key Levels:
Bullish Flip Zone: $115,700 (Close Above HTF = Exit Shorts)
Trend Reversal Trigger: HTF close above $119,000 → Can open door to $131,000
Remember:
Trade with confirmation, not assumption.
Always respect key levels and adapt if market structure shifts.
NFA & DYOR
Trading
Part2 Institutional TradingFuture of Options Trading
With rising retail participation, AI-powered analytics, and mobile-first trading platforms, options trading is becoming increasingly democratized.
Emerging trends:
Weekly expiry popularity (e.g., Wednesday FinNifty, Thursday Nifty).
AI-based signals and automation.
Algo trading for executing option strategies.
SME & sectoral indices gaining traction.
Conclusion
Options trading is a dynamic and versatile approach to capital markets. Whether you're a conservative investor seeking protection or an aggressive trader chasing quick profits, options offer structured opportunities to meet your goals.
But with great power comes great responsibility — options must be approached with sound knowledge, strict discipline, and a clear strategy. Begin with basics, practice on simulators, and gradually scale as your understanding deepens

Part 9 Trading MasterclassPsychology of Options Trading
Success in options is 70% psychology and 30% strategy. Key mental traits:
Discipline: Stick to your rules.
Patience: Wait for right setups.
Control Greed/Fear: Avoid revenge trading or FOMO.
Learning Mindset: Options are complex — keep updating your knowledge.
Tips for Beginners
Start with buying options, not writing.
Avoid expiry day trading initially.
Study Open Interest (OI) and Option Chain data.
Use strategy builders before placing real trades.
Maintain a trading journal to review and improve.

Part8 Trading Masterclass Taxes on Options Trading (India)
Income Head: Classified under business income.
Tax Rate: Taxed as per income slab or presumptive basis.
Audit: Required if turnover exceeds ₹10 crore or loss is claimed.
GST: Not applicable to retail option traders.
Always consult a CA or tax expert for compliance and accurate filing.
Risk Management in Options
Key rules for managing risk:
Position Sizing: Never risk more than 1–2% of capital per trade.
Diversification: Avoid putting all capital in one strategy.
Stop Losses: Predefined exit points reduce emotional trading.
Avoid Illiquid Contracts: Wider bid-ask spreads hurt profitability.
Avoid Overleveraging: Leverage can magnify both gains and losses.

Part3 learn Institutional Trading Options Trading in India
In India, options are primarily traded on the National Stock Exchange (NSE). Some key features:
Lot Size: Options are traded in fixed lot sizes (e.g., Nifty = 50 units).
Settlement: Cash-settled (no delivery of underlying).
Expiry: Weekly (Thursday) and Monthly (last Thursday).
Margins: Sellers must maintain margin with their broker.
Popular contracts include:
Nifty 50 Options
Bank Nifty Options
Fin Nifty Options
Stock Options (e.g., Reliance, HDFC, TCS)
Tools & Platforms
Successful options trading often relies on good tools:
Broker Platforms: Zerodha, Upstox, Angel One, ICICI Direct.
Charting Tools: TradingView, ChartInk, Fyers.
Option Analysis Tools:
Sensibull
Opstra DefineEdge
QuantsApp
NSE Option Chain
These tools help visualize OI (Open Interest), build strategies, and simulate outcomes.

Trading Masterclass Options Trading Strategies
For Beginners:
Buying Calls: Bullish on the stock/index.
Buying Puts: Bearish on the stock/index.
For Intermediate Traders:
Covered Call: Holding the stock + selling a call for income.
Protective Put: Holding stock + buying a put to limit losses.
For Advanced Traders:
Iron Condor: Neutral strategy with limited risk/reward.
Straddle: Buy a call and put at the same strike; profits from big moves.
Strangle: Buy a call and put at different strikes.
Spreads:
Bull Call Spread: Buy a lower call, sell a higher call.
Bear Put Spread: Buy a higher put, sell a lower put.
These strategies balance risk and reward across different market outlooks.

Part4 Institution Trading Types of Options
American vs. European Options
American Options: Can be exercised anytime before expiry.
European Options: Can only be exercised at expiry.
Index Options vs. Stock Options
Stock Options: Based on individual stocks (e.g., Reliance, Infosys).
Index Options: Based on indices (e.g., Nifty, Bank Nifty).
Weekly vs. Monthly Options
Weekly Options: Expire every Thursday (India).
Monthly Options: Expire on the last Thursday of the month.

Part 4 Trading InstitutionHow Options Work
Example of a Call Option
Suppose a stock is trading at ₹100. You buy a call option with a ₹110 strike price, expiring in 1 month, and pay a ₹5 premium.
If the stock rises to ₹120: Your profit is ₹120 - ₹110 = ₹10. Net gain = ₹10 - ₹5 = ₹5.
If the stock stays at ₹100: The option expires worthless. Your loss = ₹5 (premium).
Example of a Put Option
Suppose the same stock is ₹100, and you buy a put option with a ₹90 strike price for ₹5.
If the stock drops to ₹80: Your profit = ₹90 - ₹80 = ₹10. Net gain = ₹10 - ₹5 = ₹5.
If the stock stays above ₹90: The option expires worthless. Your loss = ₹5.

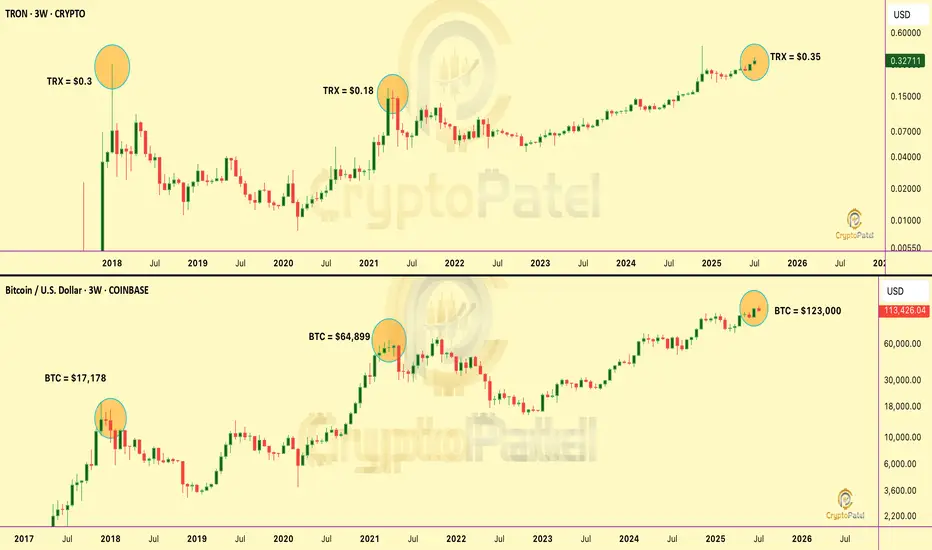
$TRX is the most slept-on asset in crypto. Here’s why🚨 CRYPTOCAP:TRX is the most slept-on asset in crypto. Here’s why 👇
📌 In Jan 2018, TRX hit $0.30 when #Bitcoin was only $17,178
📌 In 2021, TRX was $0.18 with BTC at $64,899
📌 Today BTC is $113,000, but TRX is still just $0.32
How is TRX still lagging… despite tech, adoption, and ecosystem growth?
It’s time to rewrite the narrative.
It’s time to Make TRON Great Again. #MTGA 🔺
Much respect to justinsuntron & trondao
Builders never stop. The community stands with you. 💪
NFA & DYOR
Part1 Ride The Big MoveCall Options vs Put Options
✅ Call Option (Bullish)
Gives you the right to buy the underlying asset at the strike price.
You profit when the price of the underlying asset goes above the strike price plus premium.
Example:
You buy a call on ABC stock with a strike price of ₹100, premium ₹5.
If ABC rises to ₹120, you can buy at ₹100 and sell at ₹120 = ₹15 profit (₹20 gain - ₹5 premium).
🔻 Put Option (Bearish)
Gives you the right to sell the underlying asset at the strike price.
You profit when the price of the underlying asset falls below the strike price minus premium.
Example:
You buy a put on XYZ stock with strike ₹200, premium ₹10.
If XYZ falls to ₹170, you sell at ₹200 while it trades at ₹170 = ₹20 profit (₹30 gain - ₹10 premium).

Part 6 Learn Institution Trading1. Introduction to Options Trading
Options trading is a fascinating and powerful segment of the financial markets. Unlike buying stocks directly, options offer flexibility, leverage, and a wide variety of strategic choices. But with that power comes complexity and risk.
What Are Options?
An option is a contract that gives the buyer the right (but not the obligation) to buy or sell an underlying asset (like a stock, index, or ETF) at a specific price (strike price) before or on a specific date (expiry date).
Two Types of Options:
Call Option – Right to Buy
Put Option – Right to Sell
🧩 2. The Key Components of an Option Contract
Before diving into strategies and profits, let’s break down the essential parts of any option:
Component Description
Underlying Asset The stock, index, or commodity the option is based on
Strike Price The pre-defined price at which the buyer can exercise the option
Expiry Date The date on which the option contract expires
Premium The price paid by the buyer to purchase the option

Tech’s Digital RevolutionIntroduction
The 21st century is witnessing a transformation unlike any in human history — the Digital Revolution. Driven by rapid advancements in technology, this revolution is altering how people live, work, interact, and even think. From smartphones to artificial intelligence, the world has moved beyond traditional analog systems to a deeply connected, digital-first environment.
While the Industrial Revolution mechanized human labor, the Digital Revolution is augmenting human intelligence and automating entire workflows. It is not merely a change in tools; it is a change in culture, economics, governance, and lifestyle.
1. What is the Digital Revolution?
The Digital Revolution refers to the sweeping changes brought about by digital computing and communication technologies. It began in the late 20th century and has accelerated exponentially in the 21st century.
Core Characteristics:
Replacement of analog systems with digital systems
Ubiquitous access to the internet and mobile networks
Automation and artificial intelligence
Cloud computing and data analytics
Real-time global communication
In essence, the Digital Revolution is the age where information is the most valuable asset, and data is the new oil.
2. A Brief History of the Digital Revolution
Phase 1: Birth of Computing (1940s–1960s)
Early computers like ENIAC and UNIVAC were massive and slow.
Technologies were primarily limited to governments and universities.
Phase 2: The PC Era (1970s–1980s)
Companies like Apple and IBM introduced personal computers.
Software, databases, and computer programming became accessible.
Phase 3: The Internet Age (1990s–2000s)
Introduction of the World Wide Web revolutionized communication.
Email, e-commerce, and digital media boomed.
Tech companies like Google, Amazon, and Microsoft reshaped the economy.
Phase 4: Mobile and Cloud Computing (2010s)
Smartphones and cloud services brought digital power into everyone's pocket.
Apps, GPS, mobile payments, and social media became everyday tools.
Phase 5: The AI and Automation Era (2020s–Today)
Artificial Intelligence, Machine Learning, Blockchain, and IoT are creating intelligent, interconnected ecosystems.
Robotics, automation, and virtual assistants are replacing human roles.
3. Key Technologies Driving the Revolution
a. Artificial Intelligence (AI) & Machine Learning
AI enables machines to learn, reason, and make decisions. It powers:
Chatbots like ChatGPT
Self-driving cars
Recommendation systems (e.g., Netflix, Amazon)
Predictive analytics in trading and healthcare
b. Cloud Computing
Cloud platforms like AWS, Azure, and Google Cloud allow data storage and computing power over the internet, reducing dependency on physical infrastructure.
c. Big Data Analytics
Data from social media, sensors, transactions, and IoT devices is analyzed in real time to derive insights and inform decision-making.
d. Blockchain Technology
A decentralized ledger system revolutionizing digital trust, finance, and data integrity — key to cryptocurrencies, NFTs, and smart contracts.
e. Internet of Things (IoT)
Devices connected via the internet collect and share data — from smart homes to industrial automation.
f. 5G and Connectivity
High-speed internet is enabling real-time, low-latency communication — vital for VR, telemedicine, remote work, and automated trading.
4. Societal Impact of the Digital Revolution
a. Communication and Connectivity
Social media platforms (Instagram, X, WhatsApp) allow instant global communication.
Remote work and virtual meetings (Zoom, Teams) are now mainstream.
Information spreads faster than ever, democratizing knowledge.
b. Education and Learning
Online learning platforms (Coursera, Udemy, Khan Academy) offer global access to education.
AI tutors, AR/VR classrooms, and gamified learning are reshaping how we learn.
c. Healthcare Innovation
Telemedicine, AI diagnosis tools, and health-tracking wearables (Fitbit, Apple Watch) personalize healthcare.
Drug discovery is accelerated by AI models.
d. Urban Life and Smart Cities
Smart traffic management, digital IDs, and surveillance systems are transforming city planning.
Public services are increasingly digital-first (e-governance, digital voting).
5. The Digital Revolution in Trading and Finance
a. Algorithmic & Quantitative Trading
Trading decisions are now driven by data models and algorithms.
AI scans charts, indicators, and news in milliseconds to execute trades.
b. High-Frequency Trading (HFT)
Specialized firms use ultra-low latency systems to execute thousands of trades in fractions of a second.
c. Mobile Trading Apps
Retail investors have access to platforms like Zerodha, Robinhood, and Groww, democratizing market access.
d. Cryptocurrency & Blockchain Finance
Bitcoin, Ethereum, and DeFi systems represent a new paradigm of decentralized finance (DeFi).
e. Robo-Advisors & AI Portfolios
AI-driven advisors like Wealthfront and Betterment customize investment portfolios based on risk appetite and goals.
f. Real-Time Analytics & Sentiment Tracking
Platforms analyze social sentiment (e.g., Reddit, Twitter) to gauge retail market moves (e.g., GameStop saga).
Traders track global events and volumes using data dashboards.
6. Digital Disruption Across Industries
a. Retail
E-commerce giants (Amazon, Flipkart) use AI to personalize shopping.
AR/VR is redefining the shopping experience.
b. Media & Entertainment
OTT platforms (Netflix, Prime, YouTube) personalize content delivery using AI.
Deepfakes, virtual influencers, and AI-generated content are becoming common.
c. Manufacturing & Logistics
Smart factories use sensors, robots, and AI for predictive maintenance.
Blockchain ensures transparency in supply chains.
d. Agriculture
Smart sensors, drones, and predictive analytics are optimizing crop yield, water use, and pest control.
e. Transportation
Autonomous vehicles, EVs, and ride-sharing apps (Uber, Ola) are digitizing mobility.
Conclusion
The Digital Revolution is more than a tech trend — it is a societal transformation reshaping every aspect of human life. From algorithmic trading and AI advisors in finance to smart cities and quantum computing, digital technologies are opening up vast new possibilities.
But with this power comes responsibility. Governments, corporations, and citizens must work together to ensure ethical innovation, inclusive access, and digital resilience. The future belongs not just to those who adopt technology — but to those who use it wisely, responsibly, and creatively.
Retail Trading vs Institutional TradingIntroduction
The financial markets have evolved into complex ecosystems where various participants operate with diverse objectives, capital sizes, and strategies. Among the most significant of these players are retail traders and institutional traders. While both engage in the buying and selling of financial assets such as stocks, bonds, derivatives, and currencies, their influence, behaviors, tools, and market access differ substantially.
This comprehensive article explores the nuanced differences between retail and institutional trading, shedding light on their advantages, limitations, and the evolving dynamics of global financial markets.
1. Understanding Retail and Institutional Traders
Retail Traders
Retail traders are individual investors who buy and sell securities for their personal accounts. They typically operate through online brokerage platforms and use their own money. These traders range from beginners experimenting with small amounts of capital to seasoned individuals managing sizable portfolios.
Key Characteristics:
Small to medium trade sizes
Access via retail brokerage accounts (Zerodha, Upstox, Robinhood, etc.)
Limited resources and data access
Mostly short- to medium-term strategies
Emotion-driven decision-making is common
Influenced by news, social media, and trends
Institutional Traders
Institutional traders, on the other hand, are professionals trading on behalf of large organizations such as:
Mutual funds
Pension funds
Hedge funds
Insurance companies
Sovereign wealth funds
Banks and proprietary trading desks
Key Characteristics:
Trade in large volumes (millions or billions)
Use high-level algorithmic and quantitative models
Employ teams of analysts and economists
Have access to privileged market data and direct market access (DMA)
Trade globally across asset classes
Execute trades with minimal market impact using advanced strategies
2. Capital & Trade Volume
Retail Traders
Retail traders operate with relatively small capital. Depending on the geography and economic status of the individual, a retail account may hold anywhere from a few hundred to a few lakh rupees or a few thousand dollars. Their trades typically involve smaller quantities, which means their impact on the broader market is minimal.
Institutional Traders
Institutions move massive amounts of capital, often in the hundreds of millions or even billions. Because such large orders can distort market prices, institutions split their trades into smaller chunks using algorithms and dark pools to avoid slippage and reduce impact costs.
3. Tools & Technology
Retail
Retail platforms have improved significantly over the last decade, offering:
User-friendly interfaces
Real-time charts
Technical indicators
News integration
Mobile apps
However, they lack the speed, depth, and accuracy of institutional platforms. Most retail traders use:
Discount brokers (e.g., Zerodha, Robinhood)
Retail APIs
Community forums (e.g., TradingView, Reddit)
Limited access to Level 2 data
Institutional
Institutions use high-frequency trading (HFT) platforms and low-latency networks. Tools include:
Bloomberg Terminals
Reuters Eikon
Custom-built execution management systems (EMS)
Direct market access (DMA)
High-frequency data feeds
Co-location near exchanges for speed advantage
They also use advanced machine learning models, AI-based analytics, and massive databases for fundamental and alternative data (like satellite images or credit card data).
4. Strategy & Trading Style
Retail
Retail traders often rely on:
Technical analysis
Chart patterns
Price action
Social media sentiment
Short-term scalping or swing trades
Due to lack of resources, retail traders are more susceptible to emotional decisions, overtrading, and following the herd.
Institutional
Institutions use a diverse mix of strategies, such as:
Statistical arbitrage
Event-driven strategies
Global macro
Quantitative models
Portfolio optimization
Algorithmic execution
Market making and hedging
They combine fundamental analysis, quant models, and econometric forecasting, managing risk in far more sophisticated ways.
5. Market Access & Order Execution
Retail
Retail traders execute orders through brokers who route trades through stock exchanges. These orders often face:
Latency delays
Higher spreads
No access to wholesale prices
Some brokers use Payment for Order Flow (PFOF), which may slightly impact execution quality.
Institutional
Institutions enjoy:
Direct Market Access (DMA)
Dark pools for anonymous large orders
Block trading facilities
Access to interbank FX markets, OTC derivatives, and custom structured products
Execution is often automated via algorithms that optimize for speed, price, and impact.
6. Regulation and Compliance
Retail
Retail traders face limited regulatory burdens. While they must comply with basic Know Your Customer (KYC) and taxation norms, their trades are not scrutinized as closely as institutions.
Institutional
Institutions are heavily regulated, facing:
SEBI (India), SEC (USA), FCA (UK), and others
Mandatory reporting (e.g., Form 13F in the U.S.)
Audits and compliance frameworks
Risk management systems
Anti-money laundering (AML) and know-your-client (KYC) rules
Any violation can lead to massive fines or suspension.
7. Costs & Fees
Retail
Retail brokers now offer zero-commission trades for many products, but:
There are hidden costs in bid-ask spreads
Brokerage fees for options/futures still apply
Data fees, platform charges, and leverage costs may apply
Institutional
Institutions negotiate custom pricing with exchanges and brokers. Their costs include:
Execution fees
Custodial charges
Co-location fees
Quant infrastructure costs
Trading technology and development costs
However, their costs per trade are lower due to volume, and they may receive rebates from exchanges for providing liquidity.
8. Impact on Markets
Retail
Retail trading has grown massively post-2020, especially in India and the U.S. (Robinhood, Zerodha). While they may move small-cap or penny stocks, they rarely influence blue-chip stocks on their own.
However, coordinated action (e.g., GameStop short squeeze) showed that retail can disrupt markets when acting collectively.
Institutional
Institutions are primary drivers of market movements.
Their trades shape volume, volatility, and price trends
They influence index movements
Their strategies arbitrage mispricings, increasing market efficiency
They are market makers, liquidity providers, and long-term holders of capital.
Conclusion
While retail and institutional traders operate in the same financial markets, they play very different roles. Institutional traders, backed by massive capital, advanced tools, and strategic discipline, dominate the landscape. Retail traders, despite having fewer resources, bring agility, grassroots sentiment, and unexpected market force—especially in the age of social media.
The line between them is slowly blurring as retail gets smarter and better equipped, while institutions adapt to retail dynamics. The future will likely see greater collaboration, retail data monetization, and increased hybrid models (e.g., social trading, copy trading).
Inflation Nightmare Introduction: What Is the Inflation Nightmare?
Inflation is often described as a slow-burning fire in the economy, but when it accelerates uncontrollably, it becomes a nightmare — distorting prices, eroding purchasing power, and triggering unpredictable market reactions. Traders, investors, and policymakers all dread this scenario, as inflation doesn't just change the numbers — it reshapes the economic landscape. From commodity spikes and interest rate hikes to sector rotations and recession fears, inflation is a force no one can ignore.
This article explores the anatomy of an inflation nightmare, its impact on various asset classes, central bank responses, and how traders can navigate this storm.
1. The Anatomy of Inflation
Inflation refers to the general rise in the price level of goods and services over time. While moderate inflation is considered normal in a growing economy, hyperinflation or sustained high inflation poses significant threats.
Types of Inflation:
Demand-pull inflation: Too much money chasing too few goods.
Cost-push inflation: Rising input costs (e.g., oil, labor) drive up prices.
Built-in inflation: Wage-price spiral — workers demand higher wages to keep up with inflation, causing costs to rise further.
Stagflation: A toxic mix of high inflation and stagnant growth (e.g., 1970s U.S. economy).
2. Causes of the Modern Inflation Nightmare
a. Supply Chain Disruptions
The COVID-19 pandemic and geopolitical conflicts (e.g., Russia-Ukraine war) created bottlenecks in supply chains, leading to shortages and surging prices for essential goods like semiconductors, food, and energy.
b. Monetary Policy & Stimulus
Central banks flooded economies with easy money and stimulus packages, particularly in 2020–2021. Low interest rates and quantitative easing increased liquidity — but once demand returned, supply couldn’t keep up.
c. Energy & Commodity Spikes
Natural gas, oil, wheat, and metals saw explosive price rallies due to global shortages, sanctions, and war-related disruptions, feeding directly into CPI inflation.
d. Wage Pressures & Labor Shortages
Post-pandemic labor shortages pushed wages higher in developed economies, particularly in service and logistics sectors, adding fuel to inflation.
3. How Inflation Distorts Financial Markets
a. Equity Markets: Sector Rotation & Volatility
Growth stocks (especially tech) suffer due to rising interest rates lowering the present value of future earnings.
Value stocks (e.g., banks, energy, industrials) gain favor as they often benefit from higher rates or pricing power.
Consumer discretionary gets hit hard; consumers cut spending on non-essentials as prices rise.
b. Fixed Income: Bond Yields Surge
Inflation erodes the real returns of fixed-income securities.
Investors demand higher yields → bond prices fall.
Central banks raise benchmark interest rates, making existing bonds less attractive.
c. Commodities: Inflation Hedges
Gold, silver, oil, wheat, and copper surge during inflationary periods.
Traders flock to commodities as real assets that hold value when fiat currencies weaken.
d. Currency Markets: Dollar Dominance or Decline
Inflation differentials between countries impact currency strength.
A hawkish U.S. Fed can cause dollar appreciation, pressuring emerging market currencies and debt.
4. Central Banks vs. Inflation: A Battle of Credibility
When inflation surges, central banks become market movers. Their policies have enormous implications for all asset classes.
Key Tools:
Interest rate hikes: Make borrowing costlier → reduce demand.
Quantitative tightening (QT): Reduces liquidity in the system.
Forward guidance: Sets expectations for future policy moves.
Inflation Targeting & Credibility
Central banks like the U.S. Federal Reserve, ECB, and RBI aim for 2% inflation targets. When inflation consistently overshoots, credibility is at risk, potentially unanchoring expectations and accelerating inflation further.
Soft Landing vs. Hard Landing
Soft landing: Cooling inflation without triggering a recession.
Hard landing: Aggressive tightening causes economic contraction, job losses, and market crashes.
5. Inflation's Psychological Impact on Trading
a. Uncertainty & Volatility
Unpredictable inflation leads to whipsaw price action. A single CPI or PPI print can send indices soaring or crashing.
b. Changing Correlations
Traditional correlations (e.g., stocks up when bonds up) break down.
Traders must adapt quickly to new inter-market relationships.
c. Fear vs. Greed
Inflation triggers fear-driven trading, especially in leveraged positions like options or futures. This fuels intraday volatility and wider bid-ask spreads.
6. How Traders Can Survive the Inflation Nightmare
a. Watch the Data Closely
Key indicators:
CPI & Core CPI
PPI (Producer Price Index)
Wage growth
Commodity indices
PMIs & Retail Sales
Economic calendars become vital. “Macro data trading” becomes the norm, with markets swinging based on even minor surprises.
b. Focus on Inflation-Resistant Assets
Commodities: Gold, oil, agricultural products
TIPS: Treasury Inflation-Protected Securities
Dividend stocks with pricing power
Real estate/REITs in inflation-tolerant regions
c. Sector Rotation Strategy
Shift from rate-sensitive growth stocks to:
Energy
Basic materials
Industrial goods
Financials
d. Use Derivatives Strategically
Options allow hedging against downside volatility.
Commodity and bond futures help in speculating or hedging inflation trends.
Volatility products (e.g., VIX futures) can offer short-term profits during CPI days.
e. Position Sizing & Risk Management
High volatility demands tight stops, smaller positions, and more disciplined exits.
Leverage must be managed conservatively — inflation-driven moves can be fast and brutal.
7. Real-World Examples: Historical Inflation Nightmares
a. The 1970s U.S. Stagflation
Oil embargo + policy missteps = soaring inflation and unemployment.
Fed eventually raised interest rates to 20% under Paul Volcker, causing a recession but taming inflation.
b. Zimbabwe (2000s)
Hyperinflation reached 79.6 billion percent per month.
Currency collapsed, barter and USD became alternatives.
c. Turkey & Argentina (2018–2024)
Currency depreciation and loose monetary policy led to double- and triple-digit inflation.
Savings wiped out; capital flight intensified.
8. Inflation & Geopolitics: A Dangerous Mix
Inflation can topple governments. Rising food and fuel prices have historically triggered protests and revolutions.
It increases global inequality, disproportionately hurting the poor.
Inflation linked to war and sanctions becomes even harder to control, as seen in energy and grain prices during the Ukraine conflict.
Conclusion: Turning Nightmare into Opportunity
Inflation may be a nightmare for governments and central banks, but for savvy traders and investors, it can also present unique opportunities. The key is to stay informed, flexible, and disciplined. Understanding macroeconomic indicators, adjusting asset allocation, rotating sectors, and using hedging instruments are critical.

Sector Rotation & Thematic TradingIntroduction
In the dynamic world of stock markets, not all sectors perform equally at all times. Market leadership often shifts as economic conditions change. This shift is known as sector rotation, and when paired with thematic trading—investing based on macro-level ideas or societal trends—it becomes a powerful strategy. Together, these approaches help traders anticipate where capital might flow next, allowing them to align their portfolios accordingly.
This guide explores the foundations, strategies, tools, and risks associated with Sector Rotation and Thematic Trading, especially from the perspective of an active Indian retail or institutional trader.
1. Understanding Sector Rotation
What is Sector Rotation?
Sector rotation is a strategy that involves shifting investments among different sectors of the economy based on the current phase of the business cycle. Each sector behaves differently under various economic conditions, and recognizing these shifts can help maximize returns.
The Four Phases of the Business Cycle:
Expansion: Economy grows, GDP rises, unemployment falls.
Strong Sectors: Industrials, Technology, Consumer Discretionary
Peak: Growth slows, inflation rises.
Strong Sectors: Energy, Materials, Utilities
Contraction (Recession): GDP falls, unemployment rises.
Strong Sectors: Consumer Staples, Healthcare
Trough (Recovery): Economy bottoms out, early growth.
Strong Sectors: Financials, Industrials, Technology
Why Does Sector Rotation Work?
Institutional flow: Big funds adjust their portfolios depending on economic forecasts.
Macroeconomic sensitivity: Some sectors are more interest-rate sensitive, others more dependent on consumer confidence.
Cyclical vs Defensive Sectors: Cyclical sectors move with the economy; defensive sectors offer stability during downturns.
2. Sector Rotation in Practice
Real-Life Example: Post-COVID Recovery
2020-21: Pharma, Tech (work-from-home, vaccines)
2021-22: Commodities, Real Estate (stimulus, demand revival)
2023 onwards: Industrials, Capital Goods (infrastructure push, global reshoring)
Indian Market Examples:
Banking & Financials: Surge when RBI eases interest rates or during credit booms.
FMCG & Healthcare: Outperform during inflation or slowdowns.
Auto Sector: Grows with consumer confidence and disposable income.
Infra & PSU Stocks: Outperform during budget season or government CapEx pushes.
Tracking Sector Rotation: Tools & Indicators
Relative Strength Index (RSI) comparisons between sectors.
Sector-wise ETFs or Index tracking: Nifty Bank, Nifty IT, Nifty FMCG, etc.
FII/DII Flow Analysis sector-wise.
Economic data correlation: IIP, Inflation, GDP data.
3. Thematic Trading Explained
What is Thematic Trading?
Thematic trading focuses on investing in long-term structural trends rather than short-term economic cycles. It’s about identifying a big idea and aligning with it over time, often across multiple sectors.
Key Differences vs Sector Rotation
Feature Sector Rotation Thematic Trading
Focus Economic cycles Societal or tech trends
Duration Medium-term (months) Long-term (years)
Scope Sector-based Cross-sector or multi-sector
Tools Macro indicators, ETFs Trend analysis, qualitative research
4. Popular Themes in Indian & Global Markets
a. Green Energy & Sustainability
Stocks: Adani Green, Tata Power, IREDA
Theme: ESG investing, net-zero targets, solar & wind energy
b. Digital India & Fintech
Stocks: CAMS, Paytm, Zomato, Nykaa
Theme: UPI adoption, e-governance, cashless economy
c. EV & Battery Revolution
Stocks: Tata Motors, Exide, Amara Raja, M&M
Theme: Electric mobility, lithium-ion battery, vehicle electrification
d. Infrastructure & CapEx Cycle
Stocks: L&T, IRFC, NCC, RVNL, BEL
Theme: Government spending, Budget CapEx push, Atmanirbhar Bharat
e. Manufacturing & China+1
Stocks: Dixon, Amber, Syrma SGS, Tata Elxsi
Theme: Global supply chain diversification, PLI schemes
f. AI & Tech Transformation
Stocks: TCS, Infosys, Happiest Minds
Theme: Cloud computing, automation, generative AI
g. Rural India & Agri-Tech
Stocks: PI Industries, Dhanuka, Escorts
Theme: Digital farming, Kisan drones, government subsidies
5. How to Implement Sector Rotation & Thematic Trading
Step-by-Step Framework
Macro Analysis:
Understand current phase of the economy.
Follow RBI policy, inflation, IIP, interest rate cycles.
Identify Sector Leaders:
Use Relative Strength (RS) comparison.
Look for outperforming indices or sector ETFs.
Stock Screening:
Pick stocks within strong sectors using volume, trend, and fundamentals.
Focus on high-beta stocks during sector rallies.
Thematic Mapping:
Overlay ongoing themes with sector strengths.
For example: In CapEx cycle (sector), Infra (theme), pick RVNL, L&T, NBCC.
Entry Timing:
Look for sector breakout on charts (weekly/monthly).
Confirm using sector rotation tools like RRG charts.
Exit/Rotate:
Monitor sector fatigue and capital rotation signals.
Shift to next sector as per business cycle or theme exhaustion.
Final Thoughts
Sector Rotation and Thematic Trading are no longer just institutional tools—they are critical for any modern trader or investor looking to outperform in both short-term and long-term markets. With macro awareness, charting skills, and access to quality data, traders can dynamically shift capital, aligning with both economic cycles and thematic tailwinds.
The trick is to stay informed, agile, and selective—rotating not just sectors, but your mindset as market conditions evolve.

Open Interest & Option Chain AnalysisOptions trading has grown rapidly among retail and institutional traders due to its strategic flexibility and leverage. Two of the most critical tools for options traders are Open Interest (OI) and Option Chain Analysis. These tools provide deep insights into market sentiment, potential support and resistance levels, and liquidity zones. This guide will walk you through the concepts of Open Interest, Option Chain interpretation, real-world strategies, and how to apply this knowledge for smarter trading decisions.
🔹 What is Open Interest?
Open Interest refers to the total number of outstanding options contracts (calls or puts) that have not been settled or closed. It reflects how much active participation exists in a particular strike price and expiry.
Key Points:
Increase in OI: Indicates that new positions are being added (either long or short).
Decrease in OI: Means traders are closing out positions.
High OI: Signals strong interest in that strike price – potentially a key level for support or resistance.
Unlike volume (which resets daily), OI is cumulative and updates after the close of each trading day.
Example:
You buy 1 lot of Nifty 17000 CE, and someone sells it to you → OI increases by 1.
You later sell it and the counterparty closes their position too → OI decreases by 1.
🔹 What is an Option Chain?
An Option Chain is a table displaying all available option contracts for a specific stock/index across various strike prices and expiries. It includes data such as:
Strike Call OI Call LTP Put LTP Put OI
17500 1,20,000 ₹75 ₹30 90,000
17600 2,40,000 ₹45 ₹40 2,00,000
Key Elements:
Strike Price: Price at which the option can be exercised.
Calls vs Puts: Calls are on the left; puts on the right (or vice versa).
LTP: Last Traded Price.
OI & Change in OI: Used to spot where the smart money is positioned.
🔹 How to Read Open Interest in the Option Chain
OI provides crucial support and resistance data. Here's how to read it:
1. High Call OI ➝ Resistance
Traders are selling call options at that level, expecting the price won’t rise above it.
2. High Put OI ➝ Support
Traders are selling puts, expecting the price won’t fall below it.
3. Change in OI (Today’s change) ➝ Trend confirmation
Positive change in Call OI + Price Falling → Bearish
Positive change in Put OI + Price Rising → Bullish
🔹 Multi-Strike OI Build-Up
Sometimes, OI builds up in multiple strike prices above/below the spot. This forms resistance/support zones.
Example:
Call OI: 17800 (3L), 17900 (2.7L), 18000 (4.1L)
Strong resistance between 17800–18000
Breakout above 18000 is significant.
🔹 Intraday Option Chain Analysis
For intraday traders, changes in OI on a 5- to 15-minute basis can reveal sharp shifts in sentiment.
Use Change in OI (Live updates).
Look at IV (Implied Volatility): Spikes can indicate event-based risk.
Combine with Volume Profile, VWAP, and Price Action.
Example:
At 11 AM, sudden jump in Put OI at 17700.
Price bouncing from 17720 → Intraday long trade setup.
🔹 Common Mistakes to Avoid
Looking at absolute OI only – Always compare to change in OI.
Ignoring context – Use OI in combination with price, volume, and trend.
Chasing false breakouts – Wait for OI shift confirmation.
Trading illiquid options – Stick to strikes with high volume and OI.
🔹 Tools for Option Chain Analysis
NSE India Website – Free option chain.
Sensibull, Opstra, StockMock – Visual OI charts and PCR.
TradingView OI Indicators – Live OI overlays.
Fyers/Webull/Zerodha – Broker-integrated data.
🔹 Advanced: OI Spreads & Traps
OI data can also reveal where retail traders are trapped:
Call writers trapped when price shoots up → Short covering leads to spikes.
Put writers trapped when price falls → Sudden breakdown.
Watch for spikes in volume + OI unwinding.
🔹 Summary: Step-by-Step Framework
Step Action
1 Identify spot price and trading range.
2 Look for highest Call & Put OI levels.
3 Observe changes in OI throughout the day.
4 Use PCR for overall bias.
5 Confirm with price action before trade.
6 Exit if OI starts shifting against your trade.
🔹 Conclusion
Open Interest and Option Chain Analysis are powerful tools when used correctly. They offer traders a real-time look at market sentiment, help identify key levels, and give clues about institutional activity. However, they should not be used in isolation. Combine them with price action, volume, and technical analysis for the best results.
Whether you're an intraday trader, swing trader, or options strategist, mastering the art of reading the option chain and open interest will give you a strong edge in today's fast-moving markets.
Intraday vs Swing Trading TechniquesTrading the financial markets is all about timing, strategy, and discipline. Among the most popular trading styles are Intraday Trading and Swing Trading—two techniques with distinct characteristics, goals, and risk profiles. While both aim to profit from short- to medium-term price movements, their approaches differ in terms of holding periods, analytical tools, risk management, and psychological demands.
This comprehensive guide explores the core principles, strategies, tools, and pros and cons of Intraday and Swing Trading, helping you determine which suits your goals and trading style best.
1. Understanding the Basics
Intraday Trading (Day Trading)
Definition: Intraday trading involves buying and selling securities within the same trading day. No positions are carried overnight.
Objective: Capitalize on small price movements using high frequency trades.
Holding Period: Minutes to hours (always closed by market close).
Markets Used In: Stocks, options, forex, futures, and indices.
Swing Trading
Definition: Swing trading is a strategy where positions are held for several days to weeks, aiming to capture price swings.
Objective: Benefit from medium-term trends and technical patterns.
Holding Period: Typically 2–10 days, sometimes longer.
Markets Used In: Equities, ETFs, forex, commodities, and crypto.
2. Key Differences Between Intraday and Swing Trading
Criteria Intraday Trading Swing Trading
Time Commitment High (Full-time or active daily) Moderate (Few hours per day)
Holding Duration Minutes to hours Days to weeks
Risk per Trade Lower (smaller moves, tight SL) Higher (wider SL for swings)
Return Potential Small gains per trade; adds up Bigger moves per trade
Stress Level High (quick decisions needed) Moderate (decisions after hours)
Tools Required Live charts, fast execution EOD analysis, less screen time
Capital Requirements Higher for active trading Moderate
3. Intraday Trading Techniques
A. Scalping
Goal: Capture small profits multiple times a day.
Strategy: Quick entries/exits based on tick or 1-min charts.
Tools: DOM (Depth of Market), momentum indicators (e.g., RSI, MACD), VWAP.
B. Momentum Trading
Goal: Ride strong directional moves caused by news or volume spikes.
Strategy: Enter when price breaks out of range on high volume.
Indicators: Moving averages, Bollinger Bands, volume analysis.
C. Reversal or Mean Reversion
Goal: Profit from overbought/oversold conditions.
Strategy: Fade extremes using RSI divergence or candlestick patterns (e.g., pin bar, engulfing).
Tools: RSI/Stochastics, support-resistance, Fibonacci levels.
D. VWAP Strategy
Goal: Enter long below VWAP or short above, expecting price to revert to average.
Strategy: Combine VWAP with price action near key levels.
Indicators: VWAP, volume, moving averages.
4. Swing Trading Techniques
A. Trend Following
Goal: Capture multi-day price trends.
Strategy: Buy on pullbacks in an uptrend or sell on rallies in a downtrend.
Indicators: 20/50/200 EMA, MACD, trendlines.
B. Breakout Trading
Goal: Enter on breakouts from consolidation or chart patterns.
Strategy: Identify key resistance/support levels, wait for breakout + volume confirmation.
Tools: Chart patterns (flags, triangles), volume, RSI.
C. Pullback Trading
Goal: Buy temporary dips in a bullish trend or sell rallies in bearish moves.
Strategy: Wait for retracement to Fibonacci level or support zone.
Indicators: Fibonacci retracements, candlestick patterns, moving averages.
D. Range Bound Swing
Goal: Trade within horizontal support/resistance.
Strategy: Buy at support, sell at resistance, exit before breakout.
Tools: RSI/Stochastic, Bollinger Bands, price action.
5. Technical Tools and Indicators
Common to Both:
Candlestick Patterns: Doji, Hammer, Engulfing
Support/Resistance Zones
Moving Averages (SMA/EMA)
Volume Analysis
More Used in Intraday:
VWAP, SuperTrend, Tick Charts, Order Flow
Lower timeframes: 1min, 5min, 15min
More Used in Swing Trading:
Daily/4H/1H Charts
RSI, MACD, Fibonacci, Trendlines, Bollinger Bands
6. Risk Management Techniques
Intraday:
Stop Loss (SL): Tight SLs (0.3%–1%)
Risk per Trade: Typically 1% of capital
Trade Size: Smaller targets, more frequent trades
Position Sizing: Scalability matters due to liquidity and slippage
Swing Trading:
Stop Loss: Wider SLs (1.5%–5%)
Risk per Trade: Still capped at 1–2% capital
Trade Size: Fewer trades, but larger moves expected
Gap Risk: Overnight gaps can trigger stop-loss or slippage
7. Pros and Cons
Intraday Trading
Pros:
No overnight risk
Daily profit potential
Frequent learning opportunities
High leverage usage in derivatives
Cons:
High stress and screen time
Requires fast execution and discipline
Brokerage and transaction costs add up
Risk of overtrading
Swing Trading
Pros:
Less screen time needed
Better suited for part-time traders
Higher reward-to-risk per trade
Uses EOD data, less noise
Cons:
Exposure to overnight risk (gaps, news)
Patience needed
Less frequent trades
Holding through volatility can be psychologically tough
8. Psychology of Trading Styles
Intraday Trader Mindset:
Fast decision-making
Ability to manage multiple trades under pressure
Accepting frequent small wins/losses
High emotional discipline to avoid revenge trading
Swing Trader Mindset:
Patience to wait for setups
Comfort with holding trades overnight
Ability to withstand market noise and temporary drawdowns
Strategic thinking and planning ahead
Case Example
Intraday Example:
Stock: Reliance
Event: Breakout above day’s high at ₹2,500 with high volume
Entry: ₹2,505
Stop Loss: ₹2,490 (tight)
Target: ₹2,525
Trade Duration: 45 minutes
Outcome: Quick 20-point gain, exited same day
Swing Trade Example:
Stock: TCS
Pattern: Cup and Handle on daily chart
Entry: ₹3,850 after breakout
SL: ₹3,720 (below handle)
Target: ₹4,200
Trade Duration: 8 trading days
Outcome: ₹350 gain, partial profit booked on trailing stop
Conclusion
Both Intraday and Swing Trading are powerful trading methods, each with its own merits and risks. The key to success lies in choosing a style aligned with your time availability, risk appetite, and personality.
If you enjoy fast-paced decision-making and have full-time availability, Intraday Trading might suit you.
If you prefer a calmer, more strategic approach with less screen time, Swing Trading is a strong choice.
Ultimately, both styles can be profitable when paired with solid risk management, proper strategy, and emotional discipline. The best traders often master one style first—then expand or blend techniques as their skill evolves.
Part5 Institution Trading Stratergy1. Introduction to Options Trading
Options trading is a powerful financial strategy that allows traders to speculate on or hedge against the future price movements of assets such as stocks, indices, or commodities. Unlike traditional investing, where you buy or sell the asset itself, options give you the right, but not the obligation, to buy or sell the asset at a specific price before a specified date.
Options are widely used by retail traders, institutional investors, and hedge funds for various purposes—ranging from hedging risk, generating income, or leveraging small amounts of capital for high returns.
2. Basics of Options
What is an Option?
An option is a derivative contract whose value is based on the price of an underlying asset. It comes in two forms:
Call Option: Gives the holder the right to buy the underlying asset.
Put Option: Gives the holder the right to sell the underlying asset.
Key Terms
Strike Price: The price at which the option can be exercised.
Premium: The price paid to buy the option.
Expiry Date: The last date the option can be exercised.
In-the-Money (ITM): Option has intrinsic value.
Out-of-the-Money (OTM): Option has no intrinsic value.
At-the-Money (ATM): Strike price is equal or close to the current market price.

Avoiding Breakout Traps Like a ProIntroduction
Breakouts are among the most exciting setups in technical trading. The concept is simple: a stock or index moves beyond a defined support or resistance level, signaling the beginning of a new trend. Traders rush to enter the trade in the direction of the breakout, hoping to ride the wave. However, not all breakouts are genuine. Many are traps — known as false breakouts — that lure traders in, only to reverse sharply, causing losses. These are commonly referred to as breakout traps.
In this guide, we’ll break down how breakout traps occur, how professionals avoid them, and provide actionable techniques to help you recognize and filter high-probability breakouts like a pro.
What Is a Breakout Trap?
A breakout trap occurs when price moves beyond a key level — like resistance or support — triggering entries for breakout traders, only to reverse direction soon after. This creates a trap for those who entered the trade expecting continuation, leading to losses or forced exits.
Example:
Price breaks above a resistance of ₹100.
Traders enter long expecting a breakout.
Price quickly falls back below ₹100 and drops to ₹95.
Traders are trapped; stop losses are hit.
These traps are often the result of:
Smart money manipulation (stop hunting).
Retail trader overenthusiasm.
Low-volume confirmations.
Fake news or premature entries.
Why Do Breakout Traps Happen?
1. Lack of Volume Confirmation
Breakouts without volume are suspect. Volume represents participation. If the price breaks out without sufficient volume, it's likely driven by a small group of traders or algorithms — not sustainable strength.
2. Liquidity Grabs (Stop Loss Hunting)
Market makers and large institutions often push the price just beyond a key level to trigger stop losses and breakout entries, then reverse the move to trap traders.
3. Overcrowded Trades
When too many traders spot the same setup, it becomes a self-fulfilling trap. Everyone buys the breakout, but without new demand, the price can’t sustain, leading to a reversal.
4. News-Driven Spikes
Sometimes a breakout is fueled by news or rumors. If the news is already “priced in” or not fundamentally strong, the move may not hold.
How Pros Avoid Breakout Traps
Professional traders understand that timing, context, and confirmation are crucial. Here’s how they navigate breakout environments:
1. Analyze the Bigger Picture (Multi-Timeframe Analysis)
A breakout on a 15-minute chart might be noise in the daily chart. Always zoom out.
If a 1-hour breakout occurs against a higher-timeframe trend, it's riskier.
Look for alignment: a breakout on 15-min, 1-hour, and daily = higher conviction.
Tip: Use weekly and daily resistance levels to filter “true” breakouts.
2. Wait for a Retest
One of the most effective techniques is waiting for a retest of the breakout level.
After breaking out, does the price come back to test the level?
If the breakout level turns into support (in long trades) or resistance (in shorts), it confirms strength.
Example:
Resistance at ₹200 breaks.
Price moves to ₹205, then comes back to ₹200.
If it holds ₹200 and reverses upward — it's likely a true breakout.
This method reduces false entries and gives better risk-reward.
3. Watch Volume Like a Hawk
Volume should increase during the breakout.
Low volume = lack of interest = high chance of trap.
Look for above-average volume bars during or immediately after the breakout.
Smart Tip:
Compare breakout volume to the 20-day average volume. If it’s significantly higher, institutions may be participating.
4. Use Traps to Your Advantage (Trap Trading Strategy)
Smart traders counter-trade false breakouts. Here’s how:
Wait for a breakout.
Let the price break the level and then reverse sharply.
Enter in the opposite direction, using the breakout level as a stop.
Example:
Stock breaks ₹500 resistance and quickly falls back below ₹500.
You enter short at ₹495.
Stop loss = ₹505.
Target = Previous support zone.
This is a high-probability setup because trapped buyers are forced to exit, pushing prices further down.
5. Use Indicators for Confluence
Indicators are not magic, but they help filter trades.
RSI Divergence: If price breaks out, but RSI shows divergence (new high in price, not in RSI), caution is needed.
Bollinger Bands: Breakouts outside the upper/lower bands with a quick return = potential trap.
MACD Crossovers: Confirm breakout with bullish/bearish crossovers near the breakout level.
6. Time of Day Matters
Breakouts during market open (first 15–30 min) are often fake due to volatility.
Mid-session or closing breakouts are more reliable.
Breakouts after consolidation during the day tend to have higher success rates.
7. News and Events Awareness
Avoid breakout trades just before earnings, budget announcements, Fed meetings, etc.
Breakouts during such periods can be whipsaw-prone.
Let the dust settle — then trade the direction of confirmation.
Common Breakout Trap Patterns
Let’s review visual patterns where breakout traps are common:
1. False Break + Engulfing Candle
Price breaks out, then prints a strong engulfing candle in the opposite direction.
This is a clear sign of rejection and trapping.
2. Rising Wedge into Resistance
Price narrows in a rising wedge, breaks out, then collapses.
Often seen in stocks with weak fundamental backing.
3. Breakout with Doji or Shooting Star
A breakout with indecision candles at the top (like doji or shooting star) signals potential reversal.
Breakout Trap Risk Management
Even with all filters, traps can still occur. That’s why risk management is essential.
Use tight stop losses just below (or above) the breakout level.
Scale in — enter partially at the breakout and more after retest.
Risk only 1–2% of your capital per trade.
Consider hedging with options if you trade larger positions.
Breakout Traps in Different Markets
Stocks
Often trap retail traders, especially low-float or penny stocks.
Watch for news-driven moves and low-volume breakouts.
Indices (Nifty, Bank Nifty)
Breakouts around round numbers (like 20,000) often get trapped.
Institutional flow (FII/DII) data helps validate direction.
Crypto
Extremely volatile. Trap breakouts are frequent due to 24/7 trading.
Use 4H and daily levels + sentiment analysis for confirmation.
Conclusion
Avoiding breakout traps isn't about avoiding all breakouts — it's about trading only the best ones with context and confirmation. Breakouts can offer explosive profits, but only if you're disciplined, patient, and skilled in filtering.
By focusing on volume, retests, multi-timeframe analysis, and risk management, you elevate your breakout trading to a professional level. Traps will still happen, but with a strategic approach, you’ll learn to either avoid them or profit from them.
Super Cycle in Trading (2025–2030 Outlook)Introduction: What is a Super Cycle in Trading?
A super cycle in trading refers to a long-term, secular trend that drives asset prices higher (or lower) across years—sometimes even decades. These macroeconomic cycles often result from structural shifts such as technological revolutions, global demographic trends, monetary policy changes, or supply-demand imbalances in key markets like commodities, equities, or currencies.
Historically, super cycles have influenced not just asset prices but global economies, wealth distribution, and geopolitical dynamics. For instance, the commodity super cycle of the early 2000s—driven by China's industrialization—triggered a worldwide surge in raw material prices. The tech super cycle in the 2010s saw exponential gains in the valuation of Silicon Valley and digital-first companies.
As we enter the second half of the 2020s, traders and investors are keenly watching for the 2025–2030 super cycle—which sectors will dominate, what risks lie ahead, and how to position themselves for maximum advantage.
Section 1: Characteristics of a Super Cycle
Understanding a super cycle involves recognizing its unique characteristics:
Extended Duration – Lasts 5–20 years.
Broad Market Impact – Affects multiple asset classes, not just isolated sectors.
Macro-Driven – Tied to global shifts in technology, demographics, or policy.
Momentum-Heavy – Once in motion, trends tend to self-reinforce.
High Volatility Phases – Though generally upward (or downward), corrections within the cycle can be sharp.
Section 2: Historical Super Cycles & Lessons Learned
To understand future super cycles, we must look at past ones:
1. Post-War Industrial Boom (1945–1965)
Driven by U.S. manufacturing and European reconstruction.
Equities soared while gold remained fixed under Bretton Woods.
2. Oil Shock & Stagflation (1970s)
Energy-driven cycle where oil-producing nations gained power.
Gold and commodities surged; equities stagnated.
3. Tech Bubble (1990s–2000)
Dot-com boom powered by internet expansion.
Unprecedented IPO mania followed by the 2001 crash.
4. China-Driven Commodity Cycle (2002–2011)
Massive demand for metals, energy, and raw goods.
Benefited countries like Australia, Brazil, and Russia.
5. Post-GFC Liquidity Super Cycle (2009–2021)
Central bank stimulus led to asset inflation.
Tech, real estate, and passive investing dominated.
Key Takeaway: Super cycles are driven by unique, structural themes. They reward early movers and punish late entrants who chase overheated trends.
Section 3: Super Cycle Themes Likely to Dominate 2025–2030
Here are the major themes expected to power the next super cycle:
1. Artificial Intelligence and Automation
Why? Generative AI (like ChatGPT), robotics, and LLMs are transforming productivity, disrupting white-collar jobs, and creating new digital business models.
Market Implications:
Long-term growth in AI chipmakers, cloud infra, and data platforms.
Emergence of “AI-first” companies replacing legacy tech.
ETFs and thematic funds based on AI and robotics to outperform.
Trading Tip: Watch for mid-cap tech breakouts and AI service enablers in emerging markets.
2. Green Energy & Climate Tech
Why? Energy transition is no longer optional—climate policy, regulation, and ESG demand are forcing real capital shifts.
Market Implications:
Massive investment in solar, wind, EVs, hydrogen, and battery storage.
Decline in legacy oil demand by late 2020s, despite short-term spikes.
New carbon trading platforms and climate hedge instruments.
Trading Tip: Focus on battery metals like lithium, cobalt, and rare earth ETFs.
3. De-Dollarization & Multi-Currency Trade Systems
Why? BRICS+ countries are pushing for alternative trade systems, reducing dependency on USD.
Market Implications:
Volatility in forex markets, with rising prominence of gold, yuan, and digital currencies.
Pressure on U.S. Treasury yields and broader financial dominance.
Trading Tip: Keep an eye on emerging market currencies, sovereign digital currency rollouts, and gold-based ETFs.
4. Demographic Super Cycle
Why? Aging populations in the West vs. youth booms in South Asia & Africa.
Market Implications:
Long-term bullishness on India, Vietnam, Indonesia due to labor and consumption booms.
Bearish tilt on EU and Japan due to declining productivity.
Trading Tip: Sectoral rotation into consumer stocks, fintech, and healthcare in these high-growth regions.
5. Decentralized Finance & Blockchain Integration
Why? Post-crypto winter, serious institutional adoption of DeFi is happening under regulated models.
Market Implications:
Ethereum and newer chains like Solana could see super cycle price surges.
Traditional finance will start integrating blockchain infrastructure (e.g., tokenized bonds, real estate).
Trading Tip: Long horizon positions in select Web3 tokens, DeFi apps, and stablecoin rails.
Section 4: Risks That Could Disrupt the Super Cycle
Super cycles aren’t guaranteed. Several factors can derail or delay them:
Geopolitical Tensions – Taiwan Strait, Middle East, Russia-Ukraine could fracture global trade.
Inflation Persistence – Sticky inflation may force central banks to tighten longer.
Tech Bubble 2.0 – Overhyped AI or green tech stocks could deflate.
Debt Crisis – Soaring global debt levels could trigger defaults or banking stress.
Climate Black Swans – Extreme weather events might upend agriculture, insurance, or energy markets.
Mitigation Strategy for Traders: Use options hedging, sector rotation, and diversified portfolio allocations. Follow global macro signals religiously.
Section 5: Trading Strategies to Ride the 2025–2030 Super Cycle
1. Thematic ETFs & Sectoral Allocation
Invest in AI, green energy, EM consumption, blockchain infrastructure via sector-focused ETFs.
2. Momentum & Breakout Trading
Super cycles create strong trend-following environments. Use weekly/monthly breakout setups for swing trades.
3. Options Writing with Super Cycle Bias
Sell puts on long-term bullish assets to accumulate at lower prices.
Use vertical spreads to capture trend-based price movement.
4. Position Trading in Commodities
Long metals and energy on dips; stay alert to seasonal and geopolitical triggers.
Super cycles often start in commodity inflation before equity re-ratings.
5. SME IPO Participation
India's SME boom is part of its structural super cycle. High-risk, high-reward territory for traders.
Use strict due diligence, avoid hype-based entries.
6. Macro Event Calendar Trading
Plan around key policy events: U.S. Fed meets, BRICS summits, G20, COP summits, Indian Budget, etc.
These can signal inflection points within super cycles.
Conclusion: Prepare, Don’t Predict
The 2025–2030 super cycle is forming amidst rapid technological shifts, rising geopolitical complexity, climate urgency, and generational demographic changes. Traders who align their strategies with these megatrends—rather than chasing short-term narratives—stand to benefit the most.
Use this cycle not just to profit, but to learn, adapt, and evolve as a market participant.
Options Trading Strategies (Weekly/Monthly Expiry)Introduction
Options trading is a powerful tool that offers flexibility, leverage, and hedging opportunities to traders. While buying and selling options is accessible, mastering strategies tailored for weekly and monthly expiries can significantly improve your chances of success. These expiry-based strategies are designed to take advantage of time decay (Theta), volatility (Vega), direction (Delta), and price range (Gamma).
This guide will deeply explore how traders approach weekly vs monthly expiry, key option strategies, risk-reward setups, and market conditions under which they’re best applied. It’s designed in simple, human-friendly language, ideal for both beginners and experienced traders.
Part 1: Understanding Expiry Types
Weekly Expiry Options
Expiry Day: Every Thursday (for NIFTY, BANKNIFTY) or the last Thursday of the week if Friday is a holiday.
Time Horizon: 1–7 days
Used by: Intraday and short-term positional traders
Purpose: Quick premium decay (theta decay is faster), suitable for short-duration strategies.
Monthly Expiry Options
Expiry Day: Last Thursday of every month
Time Horizon: 20–30 days
Used by: Positional traders, hedgers, and institutions
Purpose: Manage risk, longer setups, or swing trades; smoother premium decay compared to weeklies.
Part 2: Key Greeks in Expiry-Based Strategies
Understanding how Greeks behave around expiry is crucial:
Theta: Time decay accelerates in the final days (especially for weekly options).
Delta: Determines direction sensitivity; weekly options are more delta-sensitive near expiry.
Vega: Volatility effect; monthly options are more exposed to volatility changes.
Gamma: High near expiry, especially in ATM (At-the-Money) options — can lead to quick losses/gains.
Part 3: Weekly Expiry Strategies
1. Intraday Short Straddle (High Theta Play)
Setup: Sell ATM Call and Put of current week’s expiry.
Objective: Capture premium decay as the price stays around a range.
Best Time: Expiry day (Thursday), typically after 9:45 AM when direction becomes clearer.
Example (NIFTY at 22,000):
Sell 22000 CE and 22000 PE for ₹60 each.
Conditions:
Low India VIX
Expected range-bound movement
No major news or global event
Risks:
Sudden movement (delta risk)
Need for proper stop-loss or delta hedging
2. Short Iron Condor (Neutral)
Setup: Sell OTM Call and Put; Buy further OTM Call and Put for protection.
Risk-defined strategy, ideal for weekly expiry when you expect low movement.
Example:
Sell 22100 CE and 21900 PE
Buy 22200 CE and 21800 PE
Benefit:
Controlled loss
Decent return if the index stays in range
When to Use:
Mid-week when implied volatility is high
Event expected to cool off
3. Long Straddle (Directional Volatility)
Setup: Buy ATM Call and Put of the same strike.
Best for: Sudden movement expected — news, results, RBI event.
Example (Bank Nifty at 48,000):
Buy 48000 CE and 48000 PE
Break-even:
Needs large move to be profitable (due to premium paid on both sides)
Risk:
Premium loss if market remains flat
4. Directional Option Buying (Momentum)
Setup: Buy CE or PE depending on market trend.
Ideal for: Trending days (Tuesday to Thursday)
Time decay: High risk in weekly expiry. Must be quick in entries and exits.
Example:
Bank Nifty bullish -> Buy 48000 CE when price breaks above a resistance.
Tips:
Use support/resistance, volume, and OI data
Avoid buying deep OTM options
5. Option Scalping on Expiry Day
Method: Trade ATM options in 5-minute or 15-minute chart using price action.
Goal: Capture small moves multiple times — 10 to 20 points in NIFTY or BANKNIFTY
Works Best:
Thursday (expiry)
Volatile days with good volumes
Tools:
VWAP, OI buildup, Breakout strategy, Moving Averages
Part 4: Monthly Expiry Strategies
1. Covered Call (Long-Term Positioning)
Setup: Buy stocks (or futures), sell OTM call options
Goal: Earn premium while holding stocks
Example:
Buy Reliance stock at ₹2800
Sell 2900 CE monthly option for ₹50
Best For:
Investors with long-term holdings
Stable stocks with limited upside
2. Calendar Spread (Volatility Strategy)
Setup: Sell near expiry (weekly), buy far expiry (monthly)
Example:
Sell 22000 CE (weekly)
Buy 22000 CE (monthly)
Goal:
Earn premium from weekly decay, protect via long monthly
Best Time:
When volatility is expected to rise
Ahead of big events like elections, RBI meet
3. Bull Call Spread (Directional)
Setup: Buy ATM Call, Sell OTM Call
Risk-defined bullish strategy
Example:
Buy 22000 CE, Sell 22200 CE (monthly)
Payoff:
Limited profit, limited risk
Better risk-reward than naked option buying
Use When:
Monthly expiry in bullish trend
Budget rallies, earnings momentum
4. Bear Put Spread (Downside Protection)
Setup: Buy ATM Put, Sell OTM Put
Use for: Bearish view with limited loss
Example:
Buy 22000 PE, Sell 21800 PE (monthly)
Ideal For:
Volatile times with expected downside
FII outflows, global corrections
5. Ratio Spread (Moderately Bullish or Bearish)
Setup: Buy 1 ATM Option, Sell 2 OTM Options
Warning: Can cause unlimited loss if trade goes against you
Example (Bullish Ratio Call Spread):
Buy 22000 CE, Sell 2x 22200 CE
Conditions:
Monthly expiry
Expect mild upward move but not aggressive rally
Conclusion
Trading weekly and monthly expiry options offers unique opportunities and risks. Weekly options give fast profits but demand sharp timing and discipline. Monthly options offer more flexibility for directional, volatility, and income-based strategies.
Whether you’re a scalper, trend trader, or risk-averse investor, there’s a strategy suited for your style — but success depends on combining the right strategy with sound analysis, proper risk control, and emotional discipline.
GIFT Nifty & Global Index Correlations1. Introduction
The Indian financial ecosystem has undergone a significant transformation with the emergence of GIFT Nifty, a rebranded and relocated avatar of the former SGX Nifty. As India sharpens its global financial ambitions through GIFT City (Gujarat International Finance Tec-City), the GIFT Nifty has become a key component of the country’s market-linked globalization strategy.
But how does GIFT Nifty correlate with global indices like the Dow Jones, NASDAQ, FTSE 100, Nikkei 225, Hang Seng, and others? What signals can traders extract from global market trends before the Indian markets open?
This article explores in detail the correlation dynamics, strategic trading implications, and macroeconomic interlinkages between GIFT Nifty and major global indices.
2. Understanding GIFT Nifty
2.1 What is GIFT Nifty?
GIFT Nifty is the derivative contract representing the Nifty 50 index, now traded on the NSE International Exchange (NSE IX), based in GIFT City, Gujarat. It replaced SGX Nifty, which was earlier traded on the Singapore Exchange.
2.2 Trading Timings (as of 2025)
GIFT Nifty offers nearly 21 hours of trading, split into:
Session 1: 06:30 AM to 03:40 PM IST
Break: 03:40 PM to 04:35 PM IST
Session 2: 04:35 PM to 02:45 AM IST (next day)
This extended timing gives Indian and global investors the chance to react to major international events before the NSE opens.
3. Why GIFT Nifty Matters in Global Context
3.1 Price Discovery
Previously, SGX Nifty was used globally to gauge early cues on Indian markets. Now, GIFT Nifty fulfills that role and is even more significant because it's regulated by Indian authorities.
3.2 Liquidity Bridge
Foreign investors prefer GIFT Nifty because of:
Tax neutrality (IFSC jurisdiction)
Global accessibility
Ease of hedging and arbitrage opportunities
3.3 Strategic Global Position
Being open almost all day, GIFT Nifty trades during:
Asian trading hours
European sessions
Part of US session
This makes it a strategic derivative bridge between Indian equity markets and global macro flows.
4. Global Indices Overview: Benchmarks that Influence
Index Country Nature
Dow Jones USA Blue-chip, Industrial
NASDAQ USA Tech-heavy, Growth
S&P 500 USA Broad-market gauge
FTSE 100 UK Multinational, Export-led
DAX Germany Industrial + Auto-heavy
Nikkei 225 Japan Export, Tech-heavy
Hang Seng Hong Kong/China China proxy
Kospi South Korea Semiconductors & Auto
ASX 200 Australia Commodities & Finance
5. Key Correlation Patterns: GIFT Nifty & Global Indices
5.1 US Markets (Dow, NASDAQ, S&P 500)
Time Lag Advantage:
GIFT Nifty's evening session overlaps with the US market opening hours, making it sensitive to Dow/NASDAQ moves.
Risk-On/Risk-Off Trends:
If the NASDAQ or S&P 500 is sharply rising or falling due to earnings, inflation data, or Fed policy, GIFT Nifty reacts instantly.
Example:
Fed raises interest rates → US markets drop → GIFT Nifty falls in Session 2 → Nifty 50 opens gap-down next day.
Correlation Type:
Short-term positive correlation, especially during high-volatility events like CPI data or FOMC meetings.
5.2 European Markets (FTSE 100, DAX, CAC 40)
Mid-Day Influence:
European indices open in the afternoon IST, during GIFT Nifty’s Session 1. Their influence is moderate, often acting as early signals.
Macroeconomic Impact:
German or UK GDP data, ECB policy, or political issues (e.g., Brexit) affect GIFT Nifty during Session 1.
Example:
Weak PMI in Europe → FTSE falls → Risk aversion spreads → GIFT Nifty may drift lower.
Correlation Type:
Indirect correlation; significant during global crises or common central bank themes (e.g., inflation).
5.3 Asian Markets (Nikkei 225, Hang Seng, Kospi, ASX 200)
Morning Cue Providers:
Asian indices open before or along with GIFT Nifty’s Session 1, providing the first directional hint for Indian markets.
China Sentiment Impact:
Hang Seng and Shanghai Composite are highly sensitive to China policy. Their movements impact EM sentiment, which includes India.
Example:
Weak China export data → Hang Seng crashes → GIFT Nifty opens weak → Nifty follows suit.
Correlation Type:
Early session leading indicators, often showing short-term correlation due to regional capital flow sentiments.
6. Real Market Scenarios (Case Studies)
6.1 Fed Rate Hike Day – March 2025
US Market:
Dow fell 500 points post-Fed hawkish tone.
GIFT Nifty Reaction:
Dropped 120 points in the 2nd session.
Next Day NSE Open:
Nifty 50 gapped down by 110 points.
Inference:
Strong US market correlation, with GIFT Nifty acting as a real-time risk indicator for Indian markets.
6.2 China Lockdown News – July 2024
Asian Markets:
Hang Seng fell 4% due to Beijing lockdown.
GIFT Nifty Session 1:
Opened weak and stayed under pressure.
European Markets:
Added to risk-off mood.
Inference:
GIFT Nifty reflected immediate EM sentiment decline, even before Indian equities opened.
7. Correlation Statistics (Indicative)
Index Average Correlation Coefficient (6-Month Daily Returns)*
S&P 500 +0.55 (moderate positive)
NASDAQ +0.47 (tech-led directional link)
Dow Jones +0.52 (risk sentiment)
Nikkei 225 +0.41 (Asian correlation)
Hang Seng +0.48 (China-linked flows)
FTSE 100 +0.35 (weak to moderate)
Note: Correlation coefficients range from -1 (inverse) to +1 (perfect positive). Above +0.4 shows moderate correlation.
8. Correlation Factors: What Drives Interlinkage
8.1 Global Risk Sentiment
Markets move together when there is either extreme fear (e.g., war, recession) or exuberance (e.g., tech rally, global rate cuts).
8.2 Dollar Index (DXY) & US Bond Yields
When the Dollar rises, emerging markets like India often see outflows, affecting GIFT Nifty.
8.3 Crude Oil
India imports >80% of its oil. Rising crude → inflation risk → negative for Indian markets → reflected in GIFT Nifty.
8.4 Institutional Flows
Foreign Institutional Investors (FIIs) hedge positions through GIFT Nifty based on global triggers like Fed policy or earnings in the US.
8.5 Tech & IT Linkage
Indian IT stocks (Infosys, TCS) are correlated with NASDAQ performance due to global outsourcing demand.
Conclusion
The GIFT Nifty’s correlation with global indices is not just statistical—it’s strategic. It acts as a real-time risk barometer for Indian markets, influenced by global capital flows, geopolitical risks, tech trends, and central bank moves. While the correlations vary across geographies, they offer a powerful predictive framework for active traders and investors alike.
By mastering how GIFT Nifty reflects or diverges from global benchmarks like the Dow Jones, NASDAQ, Nikkei, or FTSE, traders can make more informed entry-exit decisions, especially during pre-market and overnight sessions.
Gold Recovery Fails at 3300 - Bearish Bias ContinuesBased on the gold chart analysis, here's a simplified price action breakdown:
Gold attempted a decent recovery and pullback yesterday, but the price is still struggling to sustain above the crucial 3300-3305 area. This inability to hold above key support levels is concerning for bullish sentiment. Additionally, gold has failed to break above the resistance trendline (black line on the chart), which further weakens the bull case.
For any meaningful upward movement, gold needs to generate at least one higher low formation, which hasn't printed yet. The immediate support zone lies at 3267-3275, and if this level breaks down, we could see further decline toward lower price levels. From a price action perspective, sellers are still in control of the market despite yesterday's recovery attempt.
The key levels to watch are the 3300-3305 resistance above and 3267-3275 support below. Until gold can break and sustain above the resistance trendline while forming higher lows, the overall sentiment remains bearish.
