“Still losing? It’s not your system – it’s your state of mind.”Still Losing Money? It's Not Your Strategy – It’s Your Mind That’s Failing You
Let’s be brutally honest.
Have you been repeating the same mistakes over and over… even though you know they’re wrong?
You know you shouldn’t enter trades without confirmation – but you do.
You know your stop-loss should be fixed – yet you keep moving it.
You know your mental state isn’t stable today – but you open the chart anyway and… trade again.
Don’t blame the market.
You’re not losing because it’s “manipulated.”
You’re losing because your emotions are in control – not your logic.
💣 The most dangerous mindset: Knowing it’s wrong… and still doing it
It’s not about lacking knowledge.
It’s not about having a weak strategy.
It’s about being hijacked by your own emotional reactions.
Ask yourself sincerely:
Are you trading to avoid boredom, anxiety, or emotional pain?
Do you open charts just to escape from real-life stress?
Are your trades a form of self-soothing rather than strategic action?
If yes, then it’s no longer about technical skills.
It’s about emotional management – and inner healing.
👹 Three psychological traps that silently ruin your trading every day:
1. FOMO – Fear of Missing Out
You see price running.
You see others winning.
You panic – “I cannot miss this one!”
→ You enter the trade impulsively, not logically.
FOMO means you don’t trust yourself to wait for better chances.
It’s fear-driven, not system-driven.
2. Revenge Trading – You just can’t stand losing
One loss and your ego is bruised.
You want to "get it back" instantly.
So you fight the market like it owes you something.
But the market doesn’t care.
You’re just venting your frustration – and losing even more in the process.
3. Overtrading – You tie your self-worth to every single trade
You feel valuable only when you’re placing trades.
Doing nothing feels like failure.
So you keep clicking – even without a plan.
Overtrading reflects your need to feel in control, even if it costs you your capital.
🔍 Harsh truth: You’re not losing to the market – you’re losing to your expectations
You expect to win fast.
To become rich fast.
To prove something to others – or to yourself.
And when that doesn’t happen, you spiral.
You're not really trading the charts.
You're trading your emotions.
✅ So what’s the solution?
Stop immediately when you feel emotionally unstable – no matter if you're in profit or loss.
Maintain a journal for your thoughts, not just your trades – track what you feel, not just what you did.
Ask yourself honestly:
Am I trading for profit, or to escape something?
Is this setup real, or am I afraid of missing out?
Invest in your inner self: meditation, walks, talking to a coach or mentor, resting properly.
💬 Final message:
Losing is not the problem.
Refusing to confront the real reason behind your losses – that’s the real danger.
You don’t need a new indicator.
You don’t need a magical strategy.
You need one decent system – and a calm, emotionally neutral mind to execute it.
The game is not on the screen.
It’s inside your head.
#TradingPsychologyIndia #MindsetForSuccess #FOMOTrading #RevengeTrading #OvertradingIssues
#ForexIndia #NSETrader #DisciplineInTrading #TradingStruggles #EmotionalAwareness #TradeLikeAPro
#MentalStrengthInMarkets #TradingMindsetMatters #ConsistencyInTrading
Trading
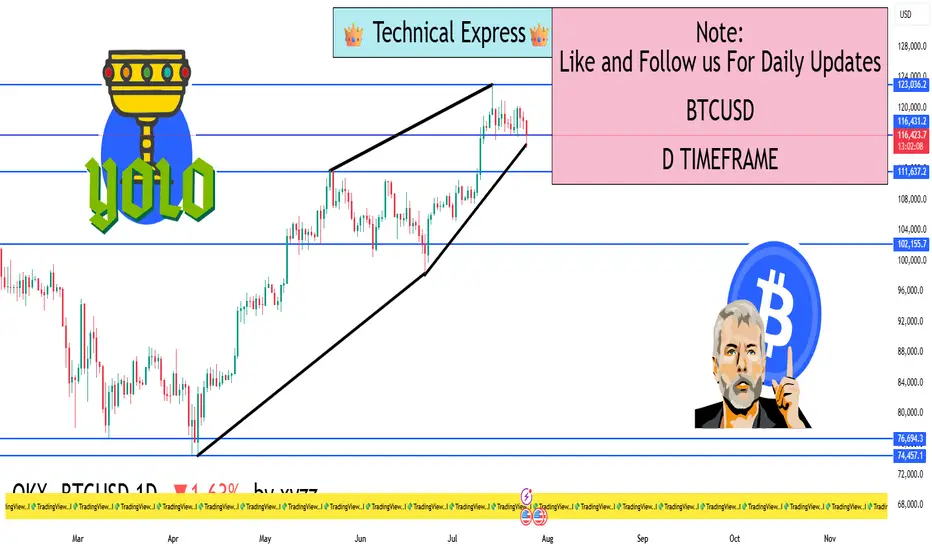
BTCUSD 1D Timeframe📈 BTC/USD 1D Timeframe Overview (as of Today)
Current Price: Around $116,100
Price Change: Down by approximately 2.1% from the previous close
Day’s High: Around $119,436
Day’s Low: Around $115,002
📊 Chart Analysis (1-Day Candle)
Each candle on the 1D chart represents one full day. Today’s candle shows:
Bearish Momentum: The candle is red, indicating sellers dominated.
Wick at Bottom: Suggests some buying pressure or support near the day's low.
Rejection from Highs: Price tried to go higher but failed, showing resistance near $119,400.
🔍 Key Support and Resistance Levels
Resistance Zone: $119,000 – $120,000 (recent highs)
Support Zone: $115,000 – $113,500 (demand area and previous consolidation)
If BTC breaks below the $115,000 support, it may test lower levels like $112,000 or $110,000. If it bounces, it could reattempt $120,000.
🧠 Technical Perspective (Daily View)
Trend: BTC is currently in a short-term pullback phase after a recent rally.
Structure: Higher lows are intact if it stays above $112,000, which suggests uptrend continuation.
Volume: Decreasing volume on red candles could mean weak selling — possible sign of reversal soon.
🔄 Daily Timeframe Strategy Insight
Swing Traders: Wait for bullish reversal candle or break above resistance to go long.
Breakout Traders: Watch if price breaks and closes above $120,000 for trend continuation.
Risk-averse Traders: Wait for confirmation of direction before entering (like bullish engulfing or hammer candle).
📉 Summary
BTC is showing short-term weakness but remains in a larger range.
$115,000 is the key short-term support, and $120,000 is the key resistance.
Watch for candle patterns, volume, and reaction at support/resistance zones.
Institution Option Trading📌 1. Multi-leg Strategic Trades
Institutions rarely take single-leg naked options. They use advanced setups like:
✅ Vertical Spreads (Bull Call / Bear Put)
✅ Iron Condor / Iron Butterfly
✅ Calendar / Diagonal Spreads
✅ Ratio Spreads
✅ Box Spreads (riskless arbitrage)
These strategies offer:
Defined risk
Better reward-to-risk ratios
Controlled exposure to market direction and volatility
📌 2. Delta Hedging
Institutions holding large stock or futures positions hedge delta using options.
For example:
Holding ₹50 crore worth of Reliance shares
Buy Reliance PUT options to protect against fall
Or, dynamically sell call options as price rises to adjust exposure
This is called Delta Hedging, and it’s done in real-time using algorithms.
📌 3. Open Interest (OI) Tracking
Institutions use option chain OI to:
Spot support/resistance based on strike activity
Identify traps and short-covering zones
Detect institutional presence via unusual OI spikes
For example:
Sudden OI surge at 22,000 PE in Bank Nifty
Might indicate put writers protecting downside, expecting reversal
📌 4. Time Decay (Theta) Exploitation
Institutions are the real beneficiaries of theta decay.
They sell options (straddles, strangles, spreads) around key levels (like VWAP, CPR) and let time decay eat the premium.
Especially on:
Expiry day (Thursday in India)
After big moves
In range-bound markets
They deploy millions of rupees in premium-selling strategies to generate daily/weekly returns.
🔶 Institutional Option Strategies Explained
Let’s break down some common institutional strategies in real terms:
🔷 1. Short Straddle
Sell ATM Call and ATM Put at same strike
Works in sideways markets
Profits from time decay and low movement
✅ Used heavily by institutions on weekly expiry
✅ Risk: Sharp move in either direction
🔷 2. Bull Call Spread
Buy a lower strike Call
Sell a higher strike Call
Lower cost, limited risk & reward
✅ Used when institutions expect moderate bullish move
✅ Controlled exposure + reduced premium
🔷 3. Iron Condor
Sell OTM Call & Put
Buy further OTM Call & Put
Net credit strategy with limited risk
✅ Best in low volatility, non-trending markets
✅ Profitable if market stays between two levels
🔷 4. Calendar Spread
Sell near-term option
Buy far-month option (same strike)
Used when:
Near-term IV is high
Long-term view is neutral or unclear
✅ Profits from IV difference and time decay advantage
🔷 5. Protective Put
Holding equity or futures
Buy Put Option to insure position
Institutions use this to hedge large portfolios during high uncertainty (e.g., elections, war threats, Fed rate decisions)
🔶 Real Example – How an Institution Trades Nifty Options
Let’s say Nifty is at 22,000.
📊 Scenario:
IV is high
No major event ahead
OI buildup seen at 22000 PE and 22100 CE
📈 Institutional Strategy:
Sell 22000 PE and 22100 CE (Short Straddle)
Buy 21900 PE and 22200 CE (hedge legs)
Result:
If Nifty stays in range → theta decay = profit
If it breaks out → hedge legs protect loss
✅ Low-risk, smart premium capture strategy
🔶 Key Tools Institutions Use in Options Trading
Bloomberg Terminal (real-time global data)
Opstra / Sensibull / QuantsApp (for Greek/OI analysis)
Option Vega/IV scanners
Algo trading engines
Python/R-based custom backtesting engines
Retail traders can start by using TradingView + Sensibull/Opstra.
🔶 How to Learn Institutional Options Trading?
Here’s a step-by-step approach:
✅ Understand Options Basics – Calls, Puts, Moneyness
✅ Study Greeks Deeply – Delta, Theta, Vega, Gamma
✅ Learn Option Chain Analysis – OI, IV, Max Pain
✅ Explore Spreads & Multi-leg Setups
✅ Practice Risk Management & Position Sizing
✅ Track Institutional Behavior via OI shifts & volume
✅ Backtest Your Strategy before going live
🔶 Final Takeaways
Institutional Options Trading is not about guessing. It’s about data, structure, and risk.
Retail traders who try to copy institutions without understanding their objectives often get trapped.
But if you:
Study Smart Money behavior
Use strategic entries based on volume + volatility
Respect risk and capital preservation
…you can trade with the institutions, not against them.

Gold Tests Key Support – Time to Buy or More Downside Ahead?🌐 Market Overview
Gold remains under pressure following yesterday’s sharp sell-off, driven largely by macro-political tensions and profit-taking at recent highs.
🔻 On July 24th, former President Trump made a surprise visit to the Federal Reserve headquarters — a move interpreted by markets as subtle pressure on the Fed to start cutting rates.
While the Fed hasn’t signaled any immediate easing, short-term bond yields have dipped slightly — reflecting growing rate-cut expectations.
The US Dollar, however, remains firm, showing markets are still hesitant to fully price in a Fed pivot after strong economic data.
📊 Technical Outlook
On the H2 timeframe, gold continues to trade within a broader bullish structure, but price action is now hovering near a critical Keylevel at 3338, aligned with a rising trendline and VPOC zone. A breakdown below this level could open the door for deeper liquidity grabs toward 332x and even 329x.
Volatility is high, and price is moving in wide ranges — ideal conditions for short-term scalp setups.
🎯 Trading Strategy
🔽 Scalp Buy (Short-Term Bounce Opportunity)
Entry: 3338 – 3336
Stop Loss: 3332
Targets: 3342 – 3346 – 3350 – 3354 – 3360 – 3365 – 3370 – 3380
🟢 Buy Zone (Deeper Pullback, Reversal Potential)
Entry: 3312 – 3310
Stop Loss: 3305
Targets: 3316 – 3320 – 3325 – 3330 – 3340 – 3350 – 3360 – 3370 – 3380
🔻 Sell Zone (If Price Retests Resistance)
Entry: 3374 – 3376
Stop Loss: 3380
Targets: 3370 – 3366 – 3360 – 3355 – 3350 – 3340 – 3330
🧭 Key Price Levels
Support: 3350 – 3338 – 3325 – 3310 – 3294
Resistance: 3374 – 3390 – 3400 – 3421
⚠️ Risk Management & Notes
As we head into the weekend, the market is prone to unexpected liquidity sweeps and sharp reversals.
Only consider short-term BUY positions for today. Avoid holding long-term buys until there's confirmation that the lower liquidity zones have been fully swept.
Strictly follow TP/SL discipline to protect capital — especially in volatile, low-news sessions like this.
💬 Enjoying these detailed trade plans?
📈 Follow the MMF TradingView channel for daily market updates, high-probability trade setups, and pro-level insights designed for serious traders.

Gold Pulls Back as Expected, Long-Term Buying Opportunity Ahead🟡 XAUUSD 24/07 – Gold Pulls Back as Expected, Long-Term Buying Opportunity Ahead
🧭 Market Overview
Gold dropped sharply from the 343x area, exactly as anticipated, after breaking the rising channel on the H1 chart and starting to sweep liquidity zones below.
Key factors influencing price action today:
Global markets are awaiting the final outcome of US-EU-China tariff negotiations.
Focus now shifts to next week’s FOMC meeting, where talks of potential rate cuts are intensifying.
Tonight’s PMI and Jobless Claims from the US could introduce unexpected volatility.
📊 Technical Outlook
While the broader trend remains bullish on D1 and H4 timeframes, the short-term H1 chart shows a clear break in structure. Price is currently exploring key FVG zones and OBS levels below.
If these liquidity zones are fully filled, it could set up a highly attractive long-term BUY opportunity, especially as markets price in future Fed rate cuts.
🎯 Today’s Trading Strategy
📌 Short-Term SELL Opportunity
→ Look for early entries at resistance zones, but only with proper confirmation.
📌 Long-Term BUY Setup
→ Target strong technical confluences at deeper levels. Be patient — focus on clean RR setups, don’t rush into early longs.
🔎 Key Price Levels to Watch
🔺 Resistance Zones (Above):
3393 – 3404 – 3414 – 3420 – 3428
🔻 Support Zones (Below):
3375 – 3366 – 3352 – 3345 – 3330
🔽 Trade Scenarios
✅ BUY ZONE: 3352 – 3350
SL: 3345
TP: 3356 → 3360 → 3364 → 3370 → 3375 → 3380 → 3390 → 3400
🔻 SELL ZONE: 3414 – 3416
SL: 3420
TP: 3410 → 3406 → 3400 → 3395 → 3390 → 3380
⚠️ News Alert
Stay cautious with tonight’s US PMI and Jobless Claims releases — these could cause sharp spikes.
✔️ Use proper SL/TP
✔️ Avoid emotional trades
✔️ Let structure confirm before entries
📣 From MMF Team – Trade Smarter Together
If you find this analysis helpful and want more daily trading plans like this:
👉 Follow the MMF channel right here on TradingView — we deliver real, actionable market strategies, not just generic analysis.
🎯 Updated daily. Straight from the charts. Built for traders.

HCLTECHBased on my analysis for long Only for education purpose only not for any buying or selling recommendations.

Gold Trading Strategy XAUUSD July 24, 2025Gold Trading Strategy XAUUSD July 24, 2025:
Yesterday's trading session, after rising to the 343x area, created a double-top pattern and fell sharply at the beginning of today's trading session.
Basic news: The EU is close to a 15% tariff agreement with the United States. The yield on 10-year US Treasury bonds fell more than 5 basis points to 4.332% before recovering to 4.364% but is still very low. The US real yield also fell 4.5 basis points to 1.932%.
Technical analysis: Gold prices fell sharply after forming a double-top pattern at the 343x area. RSI H1 is approaching the oversold area; RSI H4 and D1 are currently showing signs of correction to the average line. We will wait for the recovery of gold prices and continue trading at resistance areas.
Important price zones today: 3400 - 3405, 3420- 3425 and 3360 - 3365.
Today's trading trend: SELL.
Recommended orders:
Plan 1: SELL XAUUSD zone 3400 - 3402
SL 3405
TP 3397 - 3387 - 3377 - 3367.
Plan 2: SELL XAUUSD zone 3420 - 3422
SL 3425
TP 3417 - 3407 - 3387 - 3367.
Plan 3: BUY XAUUSD zone 3363 - 3365
SL 3360
TP 3368 - 3378 - 3388 - 3400.
Wish you a safe, favorable and profitable trading day.🌟🌟🌟🌟🌟

Option Chain Analysis + Open Interest (OI)🧠 Let’s First Understand: What is Option Chain?
An Option Chain is a table that shows available strike prices for a particular stock/index along with their Call and Put option data—like premium, volume, open interest, change in OI, etc.
✅ Where can you find it?
NSE Website (most reliable)
Trading Platforms like Zerodha, AngelOne, etc.
Apps like Sensibull, Opstra, etc.
The option chain is divided into two parts:
Left side – Call Options (CE)
Right side – Put Options (PE)
Each row shows the strike price and various data like:
LTP (Last Traded Price) – the premium.
Open Interest (OI) – total contracts outstanding.
Change in OI – new positions added or removed.
Volume – how many contracts traded today.
🔍 What is Open Interest (OI)?
OI = Open Interest = Open positions in the market.
It shows how many contracts are live at a particular strike. It’s like a pulse of the market—it tells us where the action is happening.
If OI is going up → Traders are adding positions
If OI is going down → Traders are closing positions
🔑 Why Is OI Important?
Because institutions and smart money create large positions—and OI helps us identify where they’re betting.
OI gives an idea of:
Support and Resistance zones
Strength of a trend
Where market might reverse
Where volatility might increase
📘 Understanding Support & Resistance Using Option Chain
Support and resistance levels can be seen through the OI data in the option chain.
✅ How to Identify Support?
Look at Put OI:
The strike price with highest Put OI is considered strong support.
Why? Because put writers (who are mostly smart money) don’t expect the price to fall below this level.
Example:
If 22,500 PE has the highest OI, it acts as a support level.
✅ How to Identify Resistance?
Look at Call OI:
The strike price with highest Call OI is considered strong resistance.
Why? Because call writers are betting price won’t go above this level.
Example:
If 23,200 CE has the highest OI, it acts as a resistance level.
🔁 Change in OI – Fresh Positions vs Exits
Don't just look at total OI—look at the change in OI today.
Increase in OI = Fresh positions are being added
Decrease in OI = Traders are squaring off positions
It helps confirm if the current market move is genuine or fake.
Example:
If Nifty is going up and Call OI at 23,000 is increasing, it means fresh selling → possible resistance.
But if Call OI is decreasing, it means sellers are exiting → breakout possible.
🧩 How Option Chain + OI Help in Intraday Trading
Find Support & Resistance Zones
Use highest OI levels to set your boundaries.
Avoid buying near strong resistance; avoid selling near strong support.
Use OI to Validate Breakouts
Watch how OI changes near key strike prices.
If resistance strike sees short covering (OI falling), breakout is real.
Trend Confirmation
Long buildup (Price ↑, OI ↑) = Uptrend
Short buildup (Price ↓, OI ↑) = Downtrend
Expiry Day Strategy
Focus on where OI is building rapidly.
Use max pain and max OI to sell straddles/strangles safely.
🧠 Advanced Concepts
🔸 Max Pain Theory
Max Pain is the strike price where the most option buyers lose money on expiry. It is the level where option sellers are most profitable. It usually acts like a magnet near expiry.
Example:
If Max Pain for Nifty is 23,000, market may stay near this level on expiry day.
🔸 PCR (Put Call Ratio)
PCR = Total Put OI / Total Call OI
PCR > 1: More Puts than Calls → Bullish sentiment
PCR < 1: More Calls than Puts → Bearish sentiment
PCR near 1 = Neutral/Rangebound market
Use it with caution—extremely high or low PCR may signal reversal zones.
🛠️ Tools to Use (Free)
NSE India Website – Best for raw data
Sensibull, Opstra, Quantsapp – Visual OI charts
TradingView – Combine charts + option levels
Telegram OI Bots – For quick OI updates
📌 Do's & Don'ts in Option Chain + OI Analysis
✅ Do:
Use OI + Price + Volume together
Watch OI shifts during the day (especially 9:30–10:30 AM and 2–3 PM)
Combine with support/resistance zones from charts
❌ Don’t:
Trade blindly based only on highest OI
Ignore rapid changes in OI—it could signal smart money exit
Confuse high OI with direction—it just means “interest,” not bias
🎯 Final Words
Option Chain + OI analysis isn’t just a tool—it’s your insight into the mind of the market. It tells you what others are doing, especially the big players who move the markets.
To master it, keep practicing:
Observe how OI builds around events (like RBI policy, earnings)
Watch price + OI behavior on breakout and breakdown days
Pair OI with basic technical analysis for solid confidence
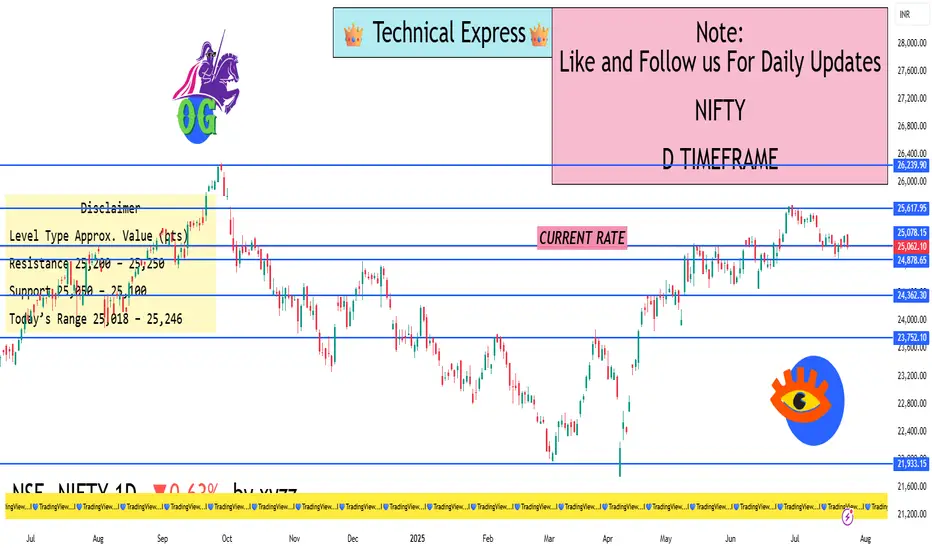
NIFTY 1D Timeframe📌 Current Data (as of early afternoon):
Current Price: Around 25,060
Opening Price: Approx. 25,200
Day’s High: ~25,246
Day’s Low: ~25,018
Previous Close: 25,216
Net Change: Down by ~155 points (–0.62%)
🔍 Intraday Price Action Analysis
Opening Weakness: Nifty opened lower than yesterday’s close due to weak global cues and selling in major sectors.
Bearish Pressure: Sellers dominated early in the day, dragging the index below 25,100.
Support Level Tested: Nifty hovered near 25,050, which acted as a short-term support.
Limited Bounce: Despite attempts to recover, resistance near 25,200–25,250 is capping upside movement.
📊 Technical Summary – 1D Timeframe
Type Range / Value
Support Levels 25,050 / 25,000
Resistance Levels 25,200 / 25,250
Trend Bias Slightly Bearish
Momentum Weak, with mild recovery attempts
Volatility Moderate
If Nifty holds above 25,050, it could try to reclaim 25,200–25,250.
A break below 25,018–25,000 may trigger further downside toward 24,950.
🧠 Why Nifty Is Down Today
IT Sector Weakness: Poor performance in tech stocks after recent earnings reports is dragging the index.
Banking Stocks Pressure: Major private and PSU banks are showing weakness due to profit booking.
Profit Booking: Traders are cashing out after last week's rally near all-time highs.
Global Market Impact: Uncertainty in international markets and trade concerns are weighing on sentiment.
🎯 What Traders Should Watch Next
Key Intraday Level: 25,050 — If Nifty stays above this level, short-term stability is possible.
Breakout Point: 25,250 — A close above this may indicate fresh bullish momentum.
Breakdown Point: Below 25,000 — Could lead to deeper correction toward 24,950–24,900.
Volatility Spike?: Stay alert around closing hours—FII/DII data and global market opening will affect the closing trend.
✅ Conclusion
Nifty 50 is under pressure today due to sectoral weakness and lack of strong domestic triggers. The index is currently range-bound between 25,000–25,250. Traders should monitor these levels closely for the next directional move.
AT&T Inc BREAKOUTAT&T Inc Share has broken its previous pattern after a strong bullish move. It increased by 100% in two years, from 14 to 27, and now it’s breaking out with a big bullish monthly candle. Due to this strong upward momentum over the past few years, the stock might consolidate for a while before moving higher. This means the upward move could take some time or even a year, so we should keep that in mind when swing trading or investing.
The target and stoploss levels depend on each person’s risk appetite. A minimum risk-reward ratio of 1:1 is always good for swing trades. For example, if our target is around 32 or 33, we could set the stoploss below 25, like at 24.5. This would give a risk-reward ratio of approximately 1.77.
This is just an analysis based on the chart pattern. We can't always expect the share to move exactly as we want. That's why we always put a stoploss. Because many different people are trading based on their own thoughts and decisions. So, never feel bad if a share doesn’t move the way you expect. There’s always an opportunity somewhere else to grab.

Institution Option Trading🏢 Who Are These Institutions?
Institutions involved in option trading include:
🏦 Hedge Funds
🏢 Proprietary (Prop) Trading Firms
💼 Investment Banks
🌍 FIIs/DIIs
🧠 Pension Funds & Insurance Companies
They trade options across equities, indices (like Nifty/Bank Nifty), commodities, and currencies, often managing portfolios worth hundreds of crores.
🔍 Institutional Option Trading Strategies
1. Delta Neutral Strategy (Market-Neutral)
Example: Sell ATM straddle and hedge with futures.
Objective: Profit from time decay (theta) while keeping position neutral to price movement.
2. Volatility Arbitrage
Institutions bet on difference between implied and actual volatility.
Buy options when IV is low, sell when IV is high.
3. Calendar Spreads
Sell near expiry option, buy longer expiry of the same strike.
Used when institutions expect IV to rise but minimal short-term price movement.
4. Iron Condors and Butterflies
Multi-leg strategies for range-bound markets.
Used with large capital to generate steady income with limited risk.
5. Protective Puts / Covered Calls
Portfolio hedging: buy puts to protect against downturns, sell calls to earn extra income.
Very common among mutual funds and long-term portfolios.
📈 Option Chain Reading – Institutional Footprint
When institutions enter or adjust option positions, they leave footprints in the option chain. You can spot them by watching:
Sudden spike in OI (Open Interest) at specific strikes
Sharp rise in IV without much price movement
Heavy Put or Call writing near resistance/support zones
Unusual option activity (UOA) before key events
⚠️ How Retail Traders Can Learn From Institutional Option Trading
Track Option Chain + OI Changes Daily
Learn to Read Greeks Before Taking a Trade
Watch How IV Shifts Before & After Events
Backtest Simple Institutional Strategies (e.g. ATM Straddles)
Focus on Consistency and Capital Protection
🛑 Common Retail Mistakes in Options (Avoided by Institutions)
Buying deep OTM options blindly
Overtrading in low-volume strikes
Selling naked options without hedge
Ignoring IV or theta decay
Trading without stop-loss or adjustment plans
🧘 Conclusion: Why Mastering Institutional Option Trading Matters
Understanding how institutions trade options allows you to:
✅ Avoid emotional traps
✅ Trade with the flow of smart money
✅ Use real risk management
✅ Build income and protection strategies
✅ Improve win-rate and longevity in trading

Institutional Objectives in Options Trading1. ✅ Hedging Existing Positions
Primary use of options by institutions is to hedge large portfolios against downside risk.
Example:
A mutual fund holding ₹100 crore of Nifty 50 stocks may buy ATM or slightly OTM Put options to protect against market correction.
Protective puts and collars are commonly used to limit drawdowns while staying invested.
🧠 Why?
Institutions can’t exit positions quickly without affecting prices. Hedging gives them protection without selling.
2. 💸 Generating Consistent Premium Income
Institutions frequently sell options (especially OTM calls or puts) to generate passive income.
Strategies like:
Covered Call Writing
Iron Condors
Short Strangles
They profit from time decay (theta) and the fact that most options expire worthless.
🧠 Why?
Consistent income + statistical edge + capital utilization = institutional trading edge.
3. 📊 Volatility Trading
Institutions exploit differences between implied volatility (IV) and expected volatility (realized).
If IV is overpriced: they sell options (e.g., strangles, straddles)
If IV is underpriced: they buy options (vega-positive strategies)
They may also trade volatility directionally, using long vega positions before events, then closing post-event for IV crush profits.
🧠 Why?
Volatility is measurable, forecastable, and less random than price.
4. ⚖️ Market-Neutral Strategies (Delta-Neutral Trading)
Institutions construct delta-neutral portfolios using options + futures or stock positions.
Aim: To remain neutral to price movement and profit from volatility or theta decay.
Example: Sell ATM straddle, hedge delta with futures, adjust gamma regularly.
🧠 Why?
Neutral strategies reduce directional risk and offer better control over large portfolios.
5. 🧮 Arbitrage Opportunities
Institutions exploit pricing inefficiencies between:
Spot and Futures vs. Options
Call-Put Parity violations
Time spread (Calendar arbitrage)
Skew arbitrage (buy underpriced, sell overpriced)
These strategies are often automated and require fast execution & deep capital.
🧠 Why?
Low-risk opportunities with high-frequency trading models.
6. 🧱 Portfolio Construction & Rebalancing
Options help institutions structure complex multi-asset portfolios using derivatives to offset sectoral risk, beta exposure, and drawdowns.
Example:
Hedging a tech-heavy portfolio by buying sector puts or using index options to balance exposure.
🧠 Why?
Options allow flexible risk management without directly altering core holdings.
7. 🔍 Event-Based Positioning
Institutions position themselves before key events:
Central bank meetings
Earnings reports
Budgets & elections
Fed rate decisions
They use options to:
Capture volatility spikes
Benefit from large moves
Hedge against adverse outcomes
Common strategy: Buy straddles or strangles pre-event, close post-event.
🧠 Why?
Leverage big events for volatility profit, while limiting risk to premium paid.
8. 🔐 Capital Efficiency and Leverage
Options allow institutions to:
Take positions with lower capital
Control large amounts of underlying using premiums
Enhance portfolio yield without leveraging core assets
Example: Buying call options instead of holding stocks for limited upside exposure.
🧠 Why?
Use of derivatives increases return-on-capital with controlled downside.
9. 🧠 Strategic Positioning via Open Interest (OI)
Institutions often create positions in options to:
Build pressure zones
Influence price action at key strikes (especially on expiry)
Track and trap retail option buyers (via fake breakouts or max pain theory)
🧠 Why?
Control over OI levels gives them an edge over uninformed players.
10. 🔁 Rolling, Adjusting & Managing Large Positions
Institutions don’t just enter and exit. They:
Roll positions across strikes or expiries
Adjust delta/gamma exposure
React to market shifts quickly without liquidating core holdings
Example:
Rolling a short call up if market is bullish
Converting short put into put spread if volatility increases
🧠 How Can Retail Traders Learn from Institutional Objectives?
Avoid naked option buying unless IV is low
Learn to sell options in range-bound or high-IV markets
Use Greeks to manage risk and adjust positions
Start tracking OI shifts before expiry
Never trade based on emotions — trade based on structure
🔚 Conclusion
Institutional options trading is driven by clear objectives, probability-based decisions, and risk frameworks. They use options not to gamble, but to optimize performance, protect portfolios, and generate edge.
If retail traders start thinking like institutions — by focusing on risk, volatility, structure, and data, rather than emotions — they’ll not only survive in the market, but begin to thrive.

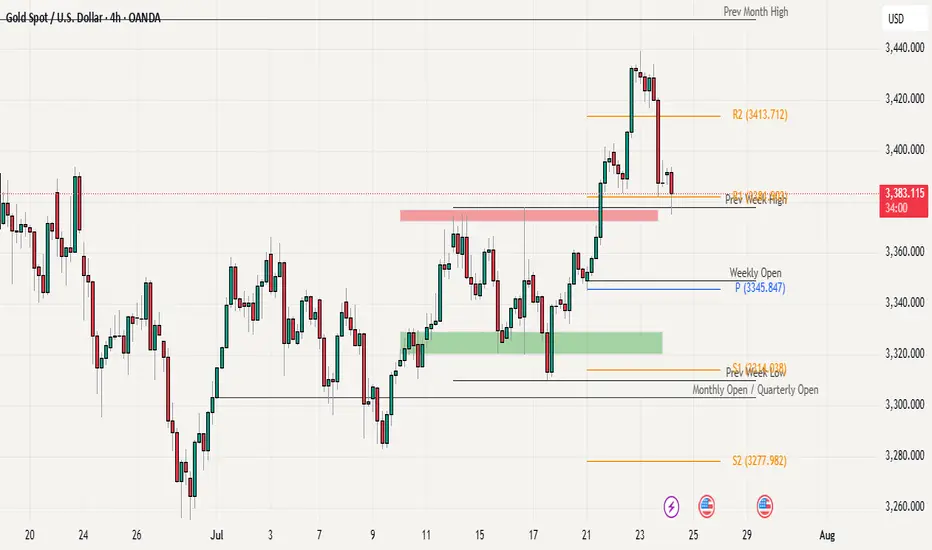
Gold :Back in range , again ??We have seen solid rally over the last two weeks, but that momentum seems to be losing steam. In yesterday’s session, price faced a sharp rejection near 3440 (Near to major resistance of 3450) and closed below the key 3400 level which is a clear warning sign for the bulls. Even though price is still holding above last week’s high (around 3377) and Weekly R1, the failure to sustain above 3400 weakens the bullish structure. If gold dips back below last week’s high, it could open the door for deeper correction and possibly trigger more selling pressure.
On the upside, a decisive move and close above 3400 is needed for buyers to regain control and attempt another leg higher. Until then, upside looks capped and short-term sentiment has turned cautious. Immediate support now lies around 3345, which is also the weekly pivot level, followed by 3333.
The price action suggests that gold may be slipping back into a range-bound phase, with no clear directional strength unless key levels break decisively. For now, the bias remains neutral to slightly bearish unless we see a strong reclaim of 3400 with momentum.
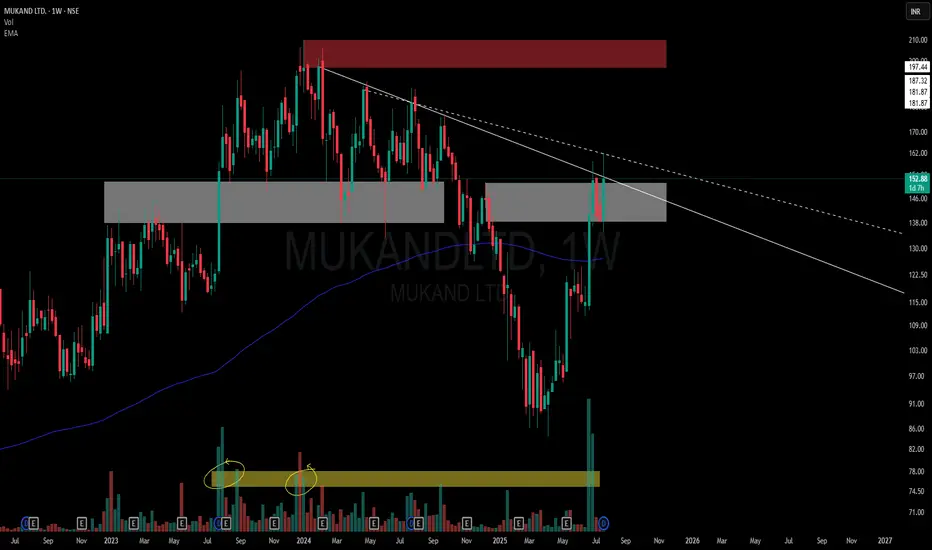
Simple Price Action Chart ( Observations )This chart is a visual case study of how price behaves when historic supply meets structural compression.
📌 Structural Highlights:
⚪ Primary Descending Trendline – Clean and persistent resistance from the top, still unbroken in a meaningful way.
▫️ Secondary Dotted Trendline – Shorter-term descending pressure also in play, giving us a dual resistance dynamic.
🟫 Strong Overhead Supply – Marked in red, this zone has held significance multiple times in the past.
⚪ Active Flip Zone – A broad grey zone showing a role reversal from supply to demand, currently interacting with price again.
📊 Volume Belt:
-Highlighted Yellow Volume Belt at the bottom shows repeated heavy interest.
🧠 Not a call – Just a neutral lens on structural context and how the market respects its own footprints.
Watch for a Potential Pullback (July 23) - GOLD PLAN XAUUSD – Is the Bullish Wave Losing Steam? Watch for a Potential Pullback (July 23)
📰 Market Overview
Gold made a strong rally last night, fueled by:
Fed Chair Powell’s speech, which avoided any controversial remarks or hints about stepping down.
Rising geopolitical tensions between the US, China, and the EU, with August 1st looming as a critical deadline.
A dip in US bond yields and the dollar, giving risk assets — including gold — room to rise.
While there’s no major news on today’s calendar, the market could remain volatile within a wide range.
📉 Technical Outlook
Gold seems to be wrapping up its bullish wave as seen on the H4 chart. On the H1 and M30 timeframes, reversal candles are starting to form — an early signal of potential correction.
The short-term support at 3412 – 3410 is the key zone to watch. If that breaks and we get a clean breakdown from the trendline, a deeper pullback could be underway — possibly heading toward liquidity zones lower down.
Two main Fair Value Gap (FVG) areas on H1 are also in play as high-probability liquidity targets.
Down at the 335x region, we have a confluence of FIB 0.618 retracement and historical buying interest — making it an attractive zone for long setups if the price reacts properly.
📌 Trade Setups for Today
🔻 SELL ZONE: 3469 – 3471
Stop Loss: 3475
Take Profits: 3465, 3460, 3455, 3450, 3445, 3440, 3430, 3420
→ Ideal zone to look for bearish setups after a retest.
🔸 BUY SCALP: 3385 – 3383
Stop Loss: 3379
Take Profits: 3390, 3394, 3398, 3402, 3406, 3410
→ Short-term buy for intraday traders catching the pullback.
🔹 LONG-TERM BUY ZONE: 3356 – 3354
Stop Loss: 3350
Take Profits: 3360, 3364, 3368, 3372, 3376, 3380, 3390, 3400
→ This is the deep liquidity zone worth watching for high-conviction buy entries.
⚠️ Risk Reminder
With fewer news catalysts, gold may trap traders by sweeping liquidity in both directions.
Stick to your plan, follow TP/SL strictly, and avoid chasing price. Let the market come to you.
💬 Sometimes the best trade is waiting for the right level. Stay patient, stay sharp.

Institutional Intraday option Trading High Volume Trades: Institutions trade in huge lots, often influencing Open Interest.
Data-Driven Strategy: Backed by proprietary models, AI, and sentiment analysis.
Smart Order Flow: Institutions use algorithms to hide their positions using Iceberg Orders, Delta Neutral Strategies, and Volatility Skew.
⚙️ Tools & Indicators Used:
Option Chain Analysis
Open Interest (OI) & OI%
Put Call Ratio (PCR)
Implied Volatility (IV)
Max Pain Theory
Gamma Exposure (GEX)
🧠 Common Institutional Strategies:
Covered Calls – Generate income on large stock holdings.
Protective Puts – Hedge downside risk.
Iron Condor / Butterfly Spread – Capture premium with neutral view.
Long Straddle/Strangle – Expecting big move post-news.
Synthetic Longs/Shorts – Replicating stock exposure using options.

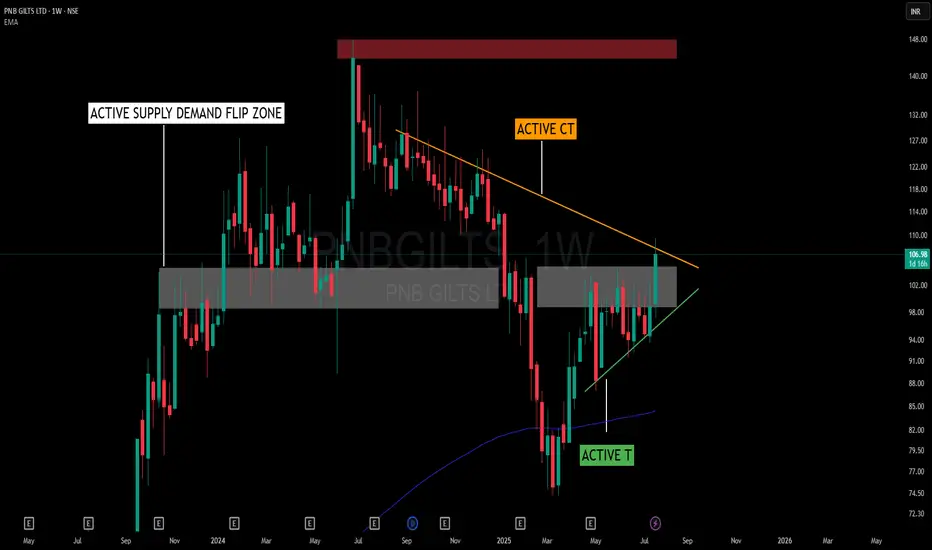
Squeezed by Structure – When Trendlines and Flip Zones CollideThis chart presents an interesting interaction between structure and zone dynamics without adhering to a textbook pattern name. The price is being squeezed within a random, yet well-defined structural form, shaped by the forces of support and resistance.
📌 Key Structural Notes:
🟠 Active Counter Trendline (CT) – Acting as overhead resistance, capping price for several weeks.
🟢 Rising Trendline (T) – Offering a base of support, encouraging higher lows and structural tightening.
🟫 Supply-Demand Flip Zone – A previously reactive supply zone now serving a dual role, showing consistent relevance to price behavior.
🟥 Major Supply Overhead – Remains untested, yet significant from a broader structure perspective.
Rather than labeling this as a triangle or cup-handle, it’s more about how CT and T are working together to compress price into a decision area. The presence of the flip zone adds to the friction, making this a valuable case to observe from a structural and behavioral standpoint.
🧠 Not a prediction or setup – just a visual study of how structure evolves when opposing pressures meet within a contextual zone.
Macro + Rate-Sensitive Asset Trading✅ What is Macro + Rate-Sensitive Asset Trading?
In basic terms:
Macro Trading is trading based on big picture economic trends — like inflation, interest rates, GDP growth, central bank policies, and geopolitical risks.
Rate-Sensitive Asset Trading focuses on those assets that react strongly when interest rates change, like:
Government bonds
Bank stocks
Real estate investment trusts (REITs)
Gold
Growth tech stocks
Commodities
Currency pairs (like USD/INR, EUR/USD)
Together, macro and rate-sensitive asset trading means analyzing global and national economic data to predict movements in specific assets and sectors.
🧠 Why is This So Important?
Because big players (FII, DII, Hedge Funds) move billions of dollars based on these macro themes.
Imagine this:
If inflation spikes → Central bank may raise interest rates
If rates go up → Bond yields rise → Bank profits rise
At the same time → Real estate slows down, gold may fall, tech stocks may suffer
And the currency (like USD or INR) may strengthen or weaken
As a trader, understanding these domino effects lets you ride big, high-conviction trades that can last for days, weeks, or even months.
🏛️ Who Controls Interest Rates?
Central banks — like the Federal Reserve (USA) or RBI (India) — adjust interest rates to control inflation and support economic growth.
Rate Hike = Borrowing becomes expensive = Slows the economy
Rate Cut = Borrowing becomes cheaper = Boosts growth
Market participants react even to expectations of these changes.
So, successful traders often read between the lines of central bank speeches, economic releases, and policy statements.
🧮 Examples of Rate-Sensitive Assets
Let’s break them down one by one:
1. Banking Stocks (HDFC Bank, ICICI Bank, SBI, Axis)
Banks make more profit when interest rates are high.
They charge more on loans and earn better margins.
So, when the RBI hikes rates, banking stocks usually go up.
📈 Trade Idea: Buy banking stocks on rate hike expectations, especially when inflation is rising.
2. Bonds and Bond Yields
Bond prices move inversely to interest rates.
When rates go up, bond prices go down, and yields go up.
Traders use this to position in debt instruments or short-duration bonds.
📉 Trade Idea: Short long-duration bonds when interest rates are expected to rise.
3. Gold and Silver
Gold is a non-interest-bearing asset.
When rates rise, bonds become more attractive → People shift from gold to fixed income → Gold falls
But during high inflation or crisis, gold can also rise as a hedge.
⚖️ Trade Idea: If real interest rates (adjusted for inflation) rise → Sell gold. If inflation is rising faster than rates → Buy gold.
4. Tech and Growth Stocks (Rate-Sensitive Equities)
High-growth companies (like tech startups or innovation companies) often rely on borrowing.
Rising interest rates increase their cost of capital.
This can compress future profits, and stock prices fall.
📉 Trade Idea: Avoid high-P/E or growth stocks during rising rate cycles. Favor value or dividend-paying stocks.
5. Real Estate / REITs
Real estate is interest-rate sensitive because home loans, EMIs, and mortgages get costlier.
When rates rise, property demand slows, and REITs (real estate investment trusts) fall.
📉 Trade Idea: Short REITs or reduce allocation during rate hike cycles.
6. Currency Pairs (Forex)
When a country hikes rates, its currency becomes stronger because it offers better returns to foreign investors.
For example, if the US Fed raises rates, the USD strengthens against INR, EUR, JPY, etc.
📈 Trade Idea: Go long on USD/INR or USD/JPY when Fed is expected to hike.
📌 How Traders Use This Information (Practical Steps)
Step 1: Develop a Macro View
Ask: Is the global economy growing or slowing?
Is inflation rising or under control?
What are central banks signaling?
Step 2: Find Asset Classes That React
If inflation rising → Buy banks, sell bonds and gold
If growth slowing → Buy bonds, sell cyclicals, maybe gold
Step 3: Time Your Entry with Technicals
Use charts (e.g., TradingView) to find good levels to enter.
Look for breakout or pullback entries.
Step 4: Manage Risk
Macro trades can move fast and big.
Always use stop losses and size your position smartly.
🧠 Pro Tips From Institutional Traders
Macro moves are slow but deep.
These trades often play out over days or weeks. Be patient.
Market moves on expectations, not news.
Price reacts before the news comes out. Get in early.
Central banks don’t always do what they say.
Learn to interpret tone, not just statements.
Watch global flows.
US rate hikes can affect Indian markets. Always zoom out.
Be aware of cycles.
Every asset class has cycles. Learn when each one outperforms.
⚠️ Risks of Macro and Rate-Sensitive Trading
Data surprises can flip the market instantly
Correlations can break (e.g., gold going up with rates)
Over-trading on news can lead to losses
Requires understanding of multiple asset classes
Long holding periods may tie up capital
📈 Real-Life Example: RBI Hike Cycle in India
Let’s say inflation in India is rising fast — food prices, fuel, etc.
RBI responds by:
Raising repo rates from 6.5% to 7.0%
Goal: Slow down spending and borrowing
What happens?
Banks rally → Nifty Bank goes up
Bonds fall → 10-year yield rises
Real estate cools off
Gold weakens if INR strengthens
Tech stocks underperform
A smart trader could:
Go long on Bank Nifty Futures
Short REITs or real estate stocks
Exit tech or auto sector temporarily
This is a textbook example of macro + rate-sensitive trading in action.
📚 Final Thoughts: Is This For You?
Macro trading with rate-sensitive assets is not for absolute beginners, but it is a powerful approach for intermediate and advanced traders.
✅ Advantages:
Big moves with logic behind them
Insight into how institutions think
Ability to diversify across assets
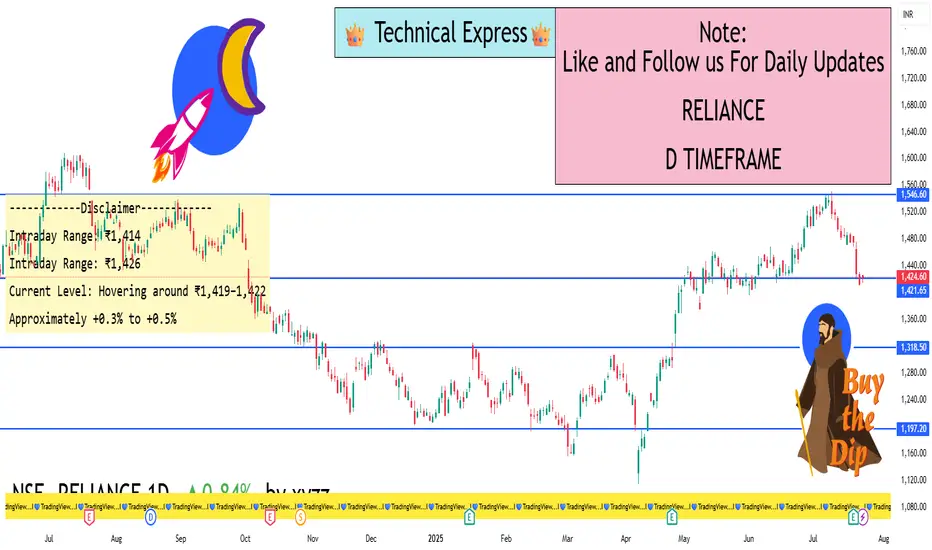
RELIANCE 1D TIMEFRAME🧾 Basic Market Overview
Open: ₹2,990
High: ₹3,012
Low: ₹2,943
Close: ₹2,956
Change: Down by ~₹34 (approx. -1.13%)
Today, Reliance started strong but faced immediate selling near the ₹3,000 mark, resulting in a negative close. The price remained weak for most of the session, and closed near the day’s low, which is a bearish sign.
🕯️ Candlestick Formation
The candle formed on the daily chart resembles a strong bearish candle — possibly a long red candle or bearish engulfing if it closes below the previous day’s close. This shows:
📈 Trend Overview
Short-Term Trend: Weak — downward momentum building
Medium-Term Trend: Sideways to slightly bullish
Long-Term Trend: Bullish — still intact unless price breaks ₹2,850
Today’s weakness has not yet broken long-term structure, but short-term traders should be cautious.
🔮 What Could Happen Next?
✅ Bullish Recovery:
If Reliance moves back above ₹3,000 and sustains with volume, it can retest ₹3,050–₹3,080
A bullish engulfing or reversal pattern needed for upside confirmation
⚠️ Bearish Continuation:
If it breaks below ₹2,940, more downside is possible toward ₹2,915–₹2,875
Traders may take short positions below this level with tight stop-loss
🔄 Consolidation:
If the price holds between ₹2,940 and ₹3,000, expect sideways movement or base building before a big move
🎯 Strategy Suggestions
For Intraday Traders:
Watch ₹2,940 – ₹3,000 levels closely
Short below ₹2,940 with a target of ₹2,915
Long above ₹3,000 only if backed by strong buying
For Swing Traders:
Avoid new longs until daily candle shows strength
Consider fresh buys near ₹2,900–₹2,915 with SL below ₹2,875
Wait for a breakout above ₹3,050 to confirm bullish reversal
For Investors:
No need to panic; long-term uptrend still valid
Add in dips if it reaches ₹2,875–₹2,850 with confirmation
Fundamental strength supports medium-to-long-term outlook
📌 Summary
Reliance showed bearish sentiment today, breaking below the short-term support of ₹2,975 and closing weak at ₹2,956. It’s trading between a critical support zone of ₹2,940–₹2,915 and facing resistance around ₹3,000–₹3,020.
Short-term: Bearish bias
Medium-term: Neutral to weak bullish
Long-term: Still bullish unless ₹2,850 breaks decisively
Traders should be cautious and wait for confirmation before taking aggressive positions.
Buyers attempted a push above ₹3,000 but failed.
Bears took over the session.
Closing near the day’s low suggests strong downside momentum.
Reliance, HDFC Bank, PSU Banks Special Focus📌 Why These Stocks Are in the Spotlight
The Indian stock market in 2025 has been witnessing a powerful bull run, and three segments are consistently making headlines:
Reliance Industries – Due to digital, energy, and demerger buzz
HDFC Bank – Despite recent underperformance, it's at a crucial turning point
PSU Banks – The comeback kings, leading the financial sector with strong balance sheets and credit growth
These aren't just stocks—they are pillars of the Indian economy and barometers for sentiment, both for domestic and foreign investors. Let’s dive into each of them in depth.
🛢️ 1. Reliance Industries – The Giant with Multiple Growth Engines
📈 Market Cap & Relevance
Reliance is India’s largest company by market cap. It’s not just a conglomerate—it’s a full-blown economic ecosystem spanning:
Oil & Petrochemicals
Telecom (Jio)
Retail
Digital services (Jio Platforms)
Green Energy
⚙️ Key Drivers in 2025:
🔹 1. Jio Financial Demerger (JFS)
Post-demerger, Reliance has unlocked significant shareholder value.
JFS is slowly becoming a digital finance powerhouse with lending, insurance, and asset management plans.
Investors see JFS as a potential fintech disruptor.
🔹 2. Green Energy & Hydrogen
Ambani’s ₹75,000 crore green push is gaining traction.
New announcements around solar panel manufacturing, battery storage, and hydrogen fuel cells are bullish triggers.
India’s energy transition policies support this narrative.
🔹 3. Retail & E-commerce Expansion
Reliance Retail is aggressively expanding into Tier 2/3 towns.
Synergies with WhatsApp and JioMart are boosting the omni-channel model.
IPO expectations for Retail arm in 2025–2026.
🔹 4. Petrochemicals Recovery
With global crude stabilizing and demand picking up, O2C margins are improving.
This helps Reliance's traditional cash cow business.
💡 Technical View:
Stock recently gave a breakout above ₹3,000.
Strong institutional buying seen.
Analysts setting targets between ₹3,200–3,500 in short-medium term.
🧠 Trader Takeaway:
Ideal for long-term portfolio and sector rotation strategy.
Short-term trades possible on earnings announcements, subsidiary IPO news, or divestments.
🏦 2. HDFC Bank – Sleeping Giant at Turning Point
📉 What Happened?
HDFC Bank, post-merger with HDFC Ltd, became India’s largest private bank by balance sheet size. But ironically, the stock underperformed for much of 2023–2024.
🧾 Reasons for Underperformance:
Confusion and uncertainty post-merger
Weak deposit growth vs. credit growth
Net Interest Margins (NIMs) under pressure
Weak earnings in multiple quarters
But 2025 tells a different story.
📈 Fresh Catalysts for Re-rating:
🔹 1. Integration Settling
The merger is now largely complete from an operational standpoint.
Synergies in housing finance and cross-sell are beginning to show.
🔹 2. Deposit Base Stabilizing
Aggressive branch expansion and new digital products have improved CASA ratio.
Focus is on rural/semi-urban penetration.
🔹 3. Tech & AI Focus
New investment in digital infrastructure, robo-advisory, and AI-based lending systems.
Competing directly with fintechs rather than fearing them.
🔹 4. Valuation Comfort
Price-to-book (P/B) of ~2.1x vs historic avg of 3.2x
Institutions are seeing value accumulation zone
💡 Technical View:
After bottoming around ₹1,350–1,400, strong bounce seen.
Next key resistances: ₹1,700 and ₹1,800.
Many traders are positioning for mean reversion plays.
🧠 Trader Takeaway:
Best suited for positional trades or long-term SIP-style entries
Watch for upcoming quarterly earnings as turning point confirmation
🏛️ 3. PSU Banks – From Forgotten to Frontline
🧭 What’s Driving the PSU Bank Rally?
After years of being ignored due to NPAs, corporate defaults, and government inefficiency stigma, PSU banks are now the stars of the financial sector.
Key reasons behind this dramatic shift:
🔹 1. Asset Quality Improvement
GNPA ratios have fallen to multi-year lows
Most PSU banks are now net NPA below 1%
🔹 2. Credit Growth Resurgence
Double-digit loan growth across retail, MSME, and infrastructure
Focus on digital banking and mobile-first services have helped increase customer base
🔹 3. Government Push
Massive infra push (railways, roads, housing) is fueling credit demand
Capex-linked lending growth is largely happening via PSU banks
🔹 4. Strong Financials
BoB, Canara Bank, Union Bank, and SBI have posted record profits
Net Interest Income (NII) and Operating Profit are at all-time highs
Dividend yields of 4–6% make them attractive to income investors
🔹 5. Re-Rating by FIIs and DIIs
PSU Banks were under-owned; that’s now reversing.
With global macro uncertain, foreign funds are betting on domestic demand-driven banks.
📈 Stocks in Focus:
State Bank of India (SBI): India’s largest lender, breaking out of long-term ranges
Bank of Baroda: Strongest PSU performer in 2024, tech-heavy
Canara Bank & Union Bank: Solid earnings, undervalued
💡 Technical View:
PSU Bank index hitting new all-time highs
BoB, Canara, Union, PNB giving weekly/monthly breakouts
🧠 Trader Takeaway:
Best for momentum trading, swing trades, and F&O strategies
Investors focusing on value + dividend + PSU story
🧠 Final Thoughts
In the 2025 trading and investment landscape, Reliance, HDFC Bank, and PSU Banks offer three distinct opportunities:
Reliance is a structural long-term compounder with growth in multiple verticals.
HDFC Bank is a value + recovery bet, especially appealing to contrarian investors.
PSU Banks are momentum machines backed by real earnings and strong policy tailwinds.
They are each being watched closely by FIIs, DIIs, retail traders, and even global strategists due to India’s growing weight in global indices like MSCI and FTSE.

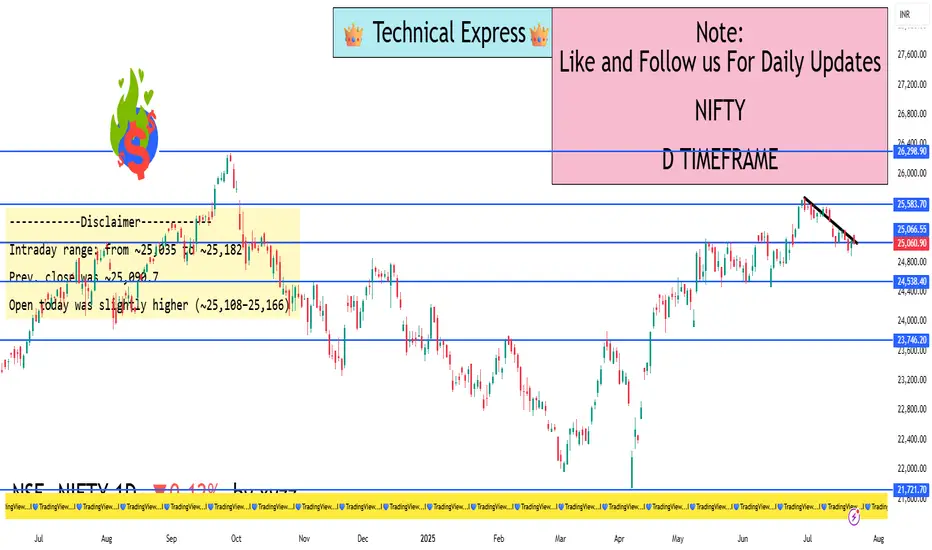
Nifty 1D Timeframe📈 Nifty 50 – Market Overview
Opening Level: Nifty 50 opened positive above 25,100, continuing momentum from the previous session.
Intraday High: Touched around 25,166 during the early session.
Intraday Low: Hovered around 25,111 in the later session.
Current Range: Mostly trading between 25,110 to 25,160, with a slight upward bias.
Previous Close: Around 25,090.
Current Gains: Around +0.1% to +0.3% for the day.
🔍 What’s Driving Nifty Today
Banking Sector Strength: Strong performance from HDFC Bank, ICICI Bank, and other financial stocks lifted the index.
Quick Commerce Rally: Companies like Eternal (Zomato parent) showed double-digit gains, adding upward pressure.
Volatility Decline: The India VIX dropped nearly 3%, suggesting reduced market fear and more stable price action.
Mid-Session Profit Booking: Sectors like Realty, Pharma, and Media witnessed some selling, causing small dips during the day.
📊 Technical Snapshot
Support Level: Immediate support seen around 25,100, below which the next strong zone is around 24,950.
Resistance Level: Strong resistance around 25,160–25,200, with breakout potential toward 25,300–25,400 if breached.
Trend Outlook: The market is holding a bullish tone, with minor intraday corrections typical in a trending market.
💡 Traders’ Perspective
Direction Trigger Level Expected Move
Bullish Scenario Above 25,166–25,200 Target next zone between 25,300–25,400
Neutral/Range-bound Between 25,100–25,160 Choppy movement, watch sector rotation
Bearish Scenario Below 25,100 Possible quick slide toward 24,950–25,000
✅ Summary
Today’s session on Nifty 50 shows mild positivity driven by financial stocks and quick-commerce momentum. The market remains range-bound near recent highs, with sectors like realty and pharma underperforming. The index is showing strength above 25,100, and a breakout above 25,200 could lead to further upside in the coming days
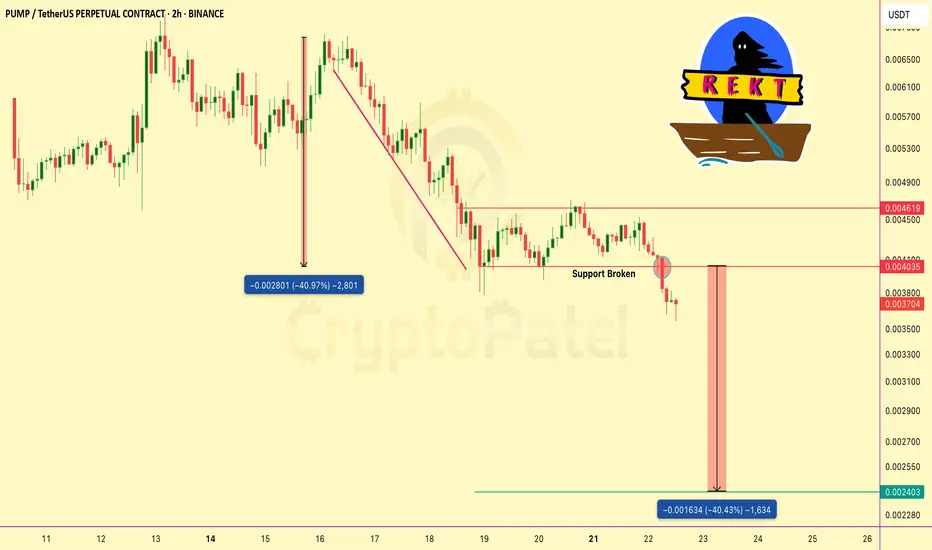
PUMP just lost a major support level—is another 40% drop coming?Caution: PUMP just lost a major support level — is another 40% drop coming?
The chart shows a clear breakdown in structure after price lost key support at 0.004035.
That level acted as a strong base during the recent consolidation, but once broken, it triggered strong selling pressure.
Retest Failed:
Price attempted to reclaim the support zone but faced rejection and a bearish retest, confirming the breakdown.
Previous Drop:
🔸 We already saw a major drop of nearly 50% earlier.
🔸 Now, the projected move suggests a similar drop is likely, targeting the 0.0024 zone and a possible liquidity pool and demand area.
Bias:
🔸 Momentum remains bearish below 0.004035.
🔸 Unless price reclaims and holds above that level, the structure favors downside continuation.
Keep managing your risk. Avoid chasing entries blindly. More updates soon.
NFa & DYOR
Technical Class📊 Technical Class — Complete Guide for Technical Trading
A Technical Class is focused on teaching traders how to analyze price action, chart patterns, indicators, and market behavior using technical analysis. This class is ideal for beginners and intermediate traders who want to understand how to make trading decisions based purely on market charts — without needing insider news or fundamentals.
✅ What is Technical Trading?
Technical trading means you:
Read the charts to find trading opportunities.
Use price history, patterns, and indicators to predict future price moves.
Do not rely on news, instead focus on what the market shows through charts.
Big traders (institutions) also use technical setups, combined with liquidity and order flow, making technical analysis an essential skill.
📚 What You Will Learn in a Technical Class
1. Chart Basics
Candlestick chart vs Line chart vs Bar chart
Timeframes: from 1 minute to monthly
Volume and market sessions
2. Candlestick Patterns
Reversal Patterns: Pin Bar, Engulfing, Morning Star, Evening Star
Continuation Patterns: Inside Bar, Flags, Pennants
Indecision Candles: Doji, Spinning Top
3. Support & Resistance
How to draw key support/resistance levels
Identifying key zones where price reacts
Turning resistance into support (flip zones)
4. Trend Trading Techniques
Recognizing Higher Highs and Higher Lows (uptrend)
Spotting Lower Highs and Lower Lows (downtrend)
Using Trendlines effectively
5. Indicators Used by Pros
Moving Averages (MA) — 50 EMA, 200 EMA for trend
RSI — Overbought/Oversold zones
MACD — Trend and momentum detection
Fibonacci Retracement — Spotting pullback levels
Volume Profile — Finding high-volume zones
6. Chart Patterns
Double Top/Bottom, Head & Shoulders, Triangles
Breakout Strategies — entering after confirmation
Fakeouts and Trap Patterns
7. Risk Management & Psychology
Setting proper Stop Loss (SL) and Take Profit (TP)
Position sizing: how much to risk per trade
Building discipline and patience like a pro trader.
🎯 Benefits of Learning Technical Trading
✅ Trade any market: Forex, Stocks, Crypto, Commodities
✅ Become an independent trader — no reliance on signals
✅ Combine with institutional concepts for Smart Money Trading
✅ Understand why market moves and avoid beginner mistakes
✅ Build a professional mindset with proper risk management
🎓 After Completing Technical Class You Will Be Able To:
Analyze any chart professionally
Trade with higher win-rate setups
Control risk like institutional traders
Identify market traps and avoid fakeouts
Grow your account safely with discipline + strategy.
