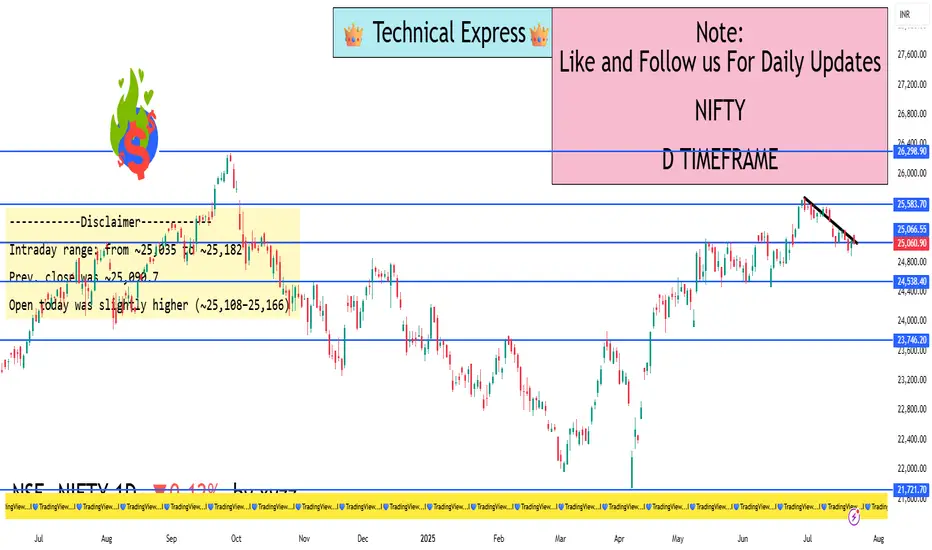
Nifty 1D Timeframe📈 Nifty 50 – Market Overview
Opening Level: Nifty 50 opened positive above 25,100, continuing momentum from the previous session.
Intraday High: Touched around 25,166 during the early session.
Intraday Low: Hovered around 25,111 in the later session.
Current Range: Mostly trading between 25,110 to 25,160, with a slight upward bias.
Previous Close: Around 25,090.
Current Gains: Around +0.1% to +0.3% for the day.
🔍 What’s Driving Nifty Today
Banking Sector Strength: Strong performance from HDFC Bank, ICICI Bank, and other financial stocks lifted the index.
Quick Commerce Rally: Companies like Eternal (Zomato parent) showed double-digit gains, adding upward pressure.
Volatility Decline: The India VIX dropped nearly 3%, suggesting reduced market fear and more stable price action.
Mid-Session Profit Booking: Sectors like Realty, Pharma, and Media witnessed some selling, causing small dips during the day.
📊 Technical Snapshot
Support Level: Immediate support seen around 25,100, below which the next strong zone is around 24,950.
Resistance Level: Strong resistance around 25,160–25,200, with breakout potential toward 25,300–25,400 if breached.
Trend Outlook: The market is holding a bullish tone, with minor intraday corrections typical in a trending market.
💡 Traders’ Perspective
Direction Trigger Level Expected Move
Bullish Scenario Above 25,166–25,200 Target next zone between 25,300–25,400
Neutral/Range-bound Between 25,100–25,160 Choppy movement, watch sector rotation
Bearish Scenario Below 25,100 Possible quick slide toward 24,950–25,000
✅ Summary
Today’s session on Nifty 50 shows mild positivity driven by financial stocks and quick-commerce momentum. The market remains range-bound near recent highs, with sectors like realty and pharma underperforming. The index is showing strength above 25,100, and a breakout above 25,200 could lead to further upside in the coming days
Trading
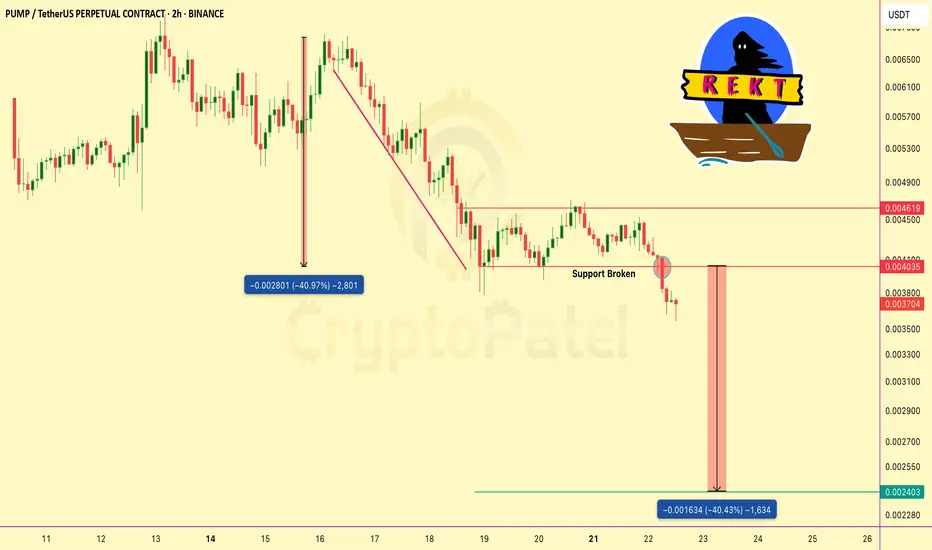
PUMP just lost a major support level—is another 40% drop coming?Caution: PUMP just lost a major support level — is another 40% drop coming?
The chart shows a clear breakdown in structure after price lost key support at 0.004035.
That level acted as a strong base during the recent consolidation, but once broken, it triggered strong selling pressure.
Retest Failed:
Price attempted to reclaim the support zone but faced rejection and a bearish retest, confirming the breakdown.
Previous Drop:
🔸 We already saw a major drop of nearly 50% earlier.
🔸 Now, the projected move suggests a similar drop is likely, targeting the 0.0024 zone and a possible liquidity pool and demand area.
Bias:
🔸 Momentum remains bearish below 0.004035.
🔸 Unless price reclaims and holds above that level, the structure favors downside continuation.
Keep managing your risk. Avoid chasing entries blindly. More updates soon.
NFa & DYOR
Technical Class📊 Technical Class — Complete Guide for Technical Trading
A Technical Class is focused on teaching traders how to analyze price action, chart patterns, indicators, and market behavior using technical analysis. This class is ideal for beginners and intermediate traders who want to understand how to make trading decisions based purely on market charts — without needing insider news or fundamentals.
✅ What is Technical Trading?
Technical trading means you:
Read the charts to find trading opportunities.
Use price history, patterns, and indicators to predict future price moves.
Do not rely on news, instead focus on what the market shows through charts.
Big traders (institutions) also use technical setups, combined with liquidity and order flow, making technical analysis an essential skill.
📚 What You Will Learn in a Technical Class
1. Chart Basics
Candlestick chart vs Line chart vs Bar chart
Timeframes: from 1 minute to monthly
Volume and market sessions
2. Candlestick Patterns
Reversal Patterns: Pin Bar, Engulfing, Morning Star, Evening Star
Continuation Patterns: Inside Bar, Flags, Pennants
Indecision Candles: Doji, Spinning Top
3. Support & Resistance
How to draw key support/resistance levels
Identifying key zones where price reacts
Turning resistance into support (flip zones)
4. Trend Trading Techniques
Recognizing Higher Highs and Higher Lows (uptrend)
Spotting Lower Highs and Lower Lows (downtrend)
Using Trendlines effectively
5. Indicators Used by Pros
Moving Averages (MA) — 50 EMA, 200 EMA for trend
RSI — Overbought/Oversold zones
MACD — Trend and momentum detection
Fibonacci Retracement — Spotting pullback levels
Volume Profile — Finding high-volume zones
6. Chart Patterns
Double Top/Bottom, Head & Shoulders, Triangles
Breakout Strategies — entering after confirmation
Fakeouts and Trap Patterns
7. Risk Management & Psychology
Setting proper Stop Loss (SL) and Take Profit (TP)
Position sizing: how much to risk per trade
Building discipline and patience like a pro trader.
🎯 Benefits of Learning Technical Trading
✅ Trade any market: Forex, Stocks, Crypto, Commodities
✅ Become an independent trader — no reliance on signals
✅ Combine with institutional concepts for Smart Money Trading
✅ Understand why market moves and avoid beginner mistakes
✅ Build a professional mindset with proper risk management
🎓 After Completing Technical Class You Will Be Able To:
Analyze any chart professionally
Trade with higher win-rate setups
Control risk like institutional traders
Identify market traps and avoid fakeouts
Grow your account safely with discipline + strategy.

Gold XAUUSD Trading Strategy on July 22, 2025Gold XAUUSD Trading Strategy on July 22, 2025:
Yesterday's trading session, gold prices rebounded strongly from the 3345 area to the 3402 area after the previous multi-timeframe compression.
Basic news: President Donald Trump's trade stance towards Europe became tougher; Europe plans to develop a retaliation plan.
Technical analysis: After the previous multi-timeframe compression, gold prices rebounded strongly again. The previous resistance zone of 3365 - 3370 has now become a support zone for gold prices. Currently, a strong uptrend is showing in multiple timeframes. However, the RSI on the H1 frame is currently quite overbought, we will wait for a correction to the support zone to trade.
Important price zones today: 3365 - 3370, 3347 - 3352 and 3422 - 3427.
Today's trading trend: BUY.
Recommended orders:
Plan 1: BUY XAUUSD zone 3365 - 3367
SL 3362
TP 3370 - 3380 - 3400 - 3420.
Plan 2: BUY XAUUSD zone 3347 - 3349
SL 3344
TP 3352 - 3362 - 3372 - 3400.
Plan 3: SELL XAUUSD zone 3425 - 3427
SL 3430
TP 3422 - 3412 - 3402 - 3382 (small volume).
Wish you a safe, favorable and profitable trading day.💯💯💯💯💯

Nifty 50 Intraday Plan for July 22, 2025🔼 Bullish Levels (Call Side - CE):
Above 25,038 : If the market opens and sustains above this level for 10 minutes, you can consider buying CE. This is the first breakout point, indicating possible upward movement.
Above 25,128: Holding above this level indicates a positive trade view. Momentum is expected to increase, and buyers may become more aggressive. Good zone to initiate or add to CE positions.
Above 25,260 : This is the CE entry level where breakout confirmation happens. If price reaches and sustains this zone, it signals strong bullish strength.
Above 25,380 : This is marked as the short-covering zone. If the price reaches here, it means many short traders may exit, creating a spike. Ideal for booking profits on CE trades.
🔽 Bearish Levels (Put Side - PE):
Below 25,038 : If the price fails to sustain above this level and breaks down with 10-minute candle confirmation, it indicates weakness. PE trades can be considered from here.
Below 24,938 : This level is a clear PE entry level. Sustained trading below this suggests downward continuation.
Below 24,920 : This is the risky PE zone. If the market trades here, PE positions should be handled with caution unless strong selling pressure is seen.
Below 24,800 : This is a safe PE zone. Breakdown below this signals confirmed bearish sentiment, and you can aggressively hold PE options.
Below 24,780 : This is the unwinding level, meaning big players may start exiting their positions, possibly triggering sharp declines. Ideal for booking PE profits or trailing stop-loss tightly.

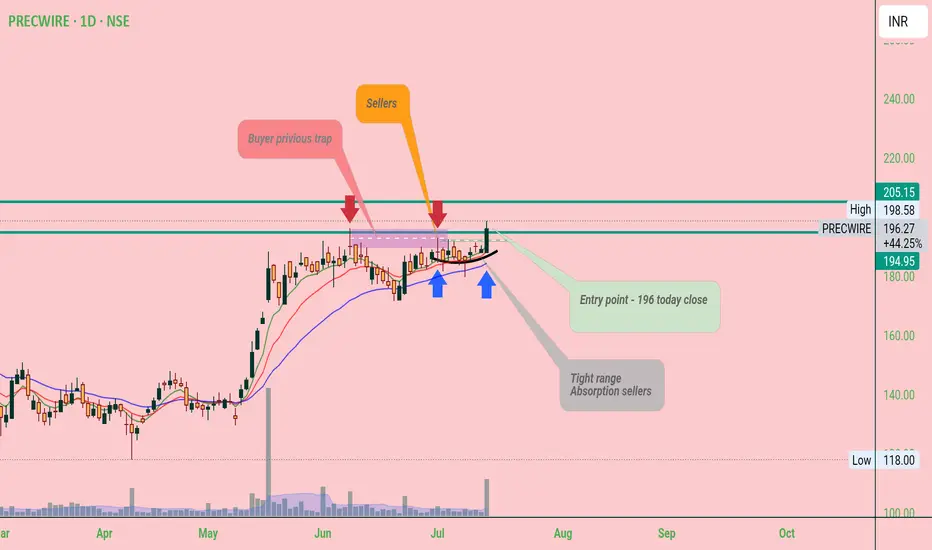
Precwire Price trading at near resistance area if close above 205₹
Good move up side posible
Pattern look like cup & handle
Put your sl below handle below risk max 10% around
HeranbaSwing Trade -
Look interesting at current level - still closing pending
If today close above break out level
Maybe we can see Good move upside.
Risk around 8-10% around
Target next resistance

Learn Institutional Trading Part-3🔍 What You'll Learn:
✅ Market Structure Mastery
Understand how price moves through different phases — accumulation, manipulation, expansion, and distribution — and how institutions position themselves at each level.
✅ Order Flow & Liquidity Concepts
Institutions focus on liquidity. Learn how they seek out stop-losses and resting orders to fill large positions without moving the market too much.
✅ Smart Money Concepts
Identify where "smart money" (institutional money) is entering and exiting the market using tools like:
Fair Value Gaps (FVG)
Order Blocks
Breaker Blocks
Liquidity Pools
Inducement and Mitigation zones
✅ Volume & Open Interest Analysis
Discover how volume analysis and options open interest reveal institutional footprints in futures and options markets.
✅ Institutional Risk Management
Learn how institutions manage massive portfolios with strict risk control, position sizing, and hedging techniques.
✅ High Probability Trade Setups
Master trade setups based on institutional logic — including trap setups, liquidity grabs, and imbalance trades — with better reward-to-risk ratios.
🧠 Why Learn Institutional Trading?
Retail traders often fall prey to emotional trading and market manipulation. Institutional traders, however, rely on logic, data, and strategy. By learning institutional trading:
You'll stop chasing price and start anticipating moves.
You'll learn to trade with the big players, not against them.
You'll gain confidence by using smart money principles instead of random indicators.
🚀 Who Should Learn This?
Day traders looking to level up
Swing traders aiming for high precision
Option traders focusing on large-scale setups
Anyone who wants to understand how real money moves the market
📈 Ready to Ride the Big Moves?
“Learn Institutional Trading” is your pathway to mastering the strategies that drive the global markets. Say goodbye to confusion and emotional trades — and start thinking like a professional.

Chainlink’s Bull Run: Up 80% After the Dip — Is $100 the Next?Chainlink’s Bull Run: Up 80% After the Dip — Is $100 the Next Target?
If you followed my chart, you likely caught the move.
✅ We entered below $10
✅ It pumped to over $30
✅ Recently dipped near $11 and another good Profit.
It’s still up 80% from our entry zone, and I believe CRYPTOCAP:LINK still has room to grow.
My updated targets: $50 / $75 / $100
Tip: Take some profits along the way and ride the trend smartly.
NFA & DYOR

Liquidity Concepts & Smart Money Trading💧 What is Liquidity in the Stock Market?
In simple terms, liquidity means how easily you can buy or sell a stock (or any asset) without affecting its price too much.
📌 Imagine This:
You're at a crowded market and want to sell 10 bags of rice. If there are many buyers, you’ll sell quickly at your price. That’s high liquidity.
But if only 1 buyer is there, you’ll need to lower the price—or wait. That’s low liquidity.
✅ High Liquidity Stocks:
Easy to enter and exit
Tight bid-ask spread
High volume and interest
Examples: Reliance, HDFC Bank, TCS, Infosys
🚫 Low Liquidity Stocks:
Wide spread
May not execute large orders fast
Often in smallcap or SME segments
Prone to manipulation
So, as a trader or investor, liquidity matters because it affects:
Speed of your trades
Slippage (difference between expected and executed price)
Risk of getting trapped in illiquid counters
🧠 Who is “Smart Money”?
“Smart Money” refers to the big, institutional players who move the market silently.
🧱 Types of Smart Money:
FIIs (Foreign Institutional Investors)
DIIs (Domestic Institutional Investors)
Mutual Funds, Pension Funds
Hedge Funds
Prop Desks (Proprietary traders of large brokers or banks)
These players do not trade like retail traders. They have:
Huge capital
Access to better research
Advanced tools and algorithms
Patience to accumulate or distribute over days/weeks
The power to create or absorb liquidity
They don’t chase stocks. They build positions strategically.
🎯 The Relationship Between Liquidity & Smart Money
This is where it gets interesting.
Smart Money doesn’t want you to know what they’re doing. So they operate in stealth mode, using liquidity zones to enter/exit.
Let’s break this down in real terms.
💡 Real Example: How Smart Money Uses Liquidity
Scenario: Let’s say a mutual fund wants to buy ₹500 crore worth of a midcap stock.
If they suddenly place a large buy order, the price will shoot up.
So what do they do?
They wait for panic selling, like during news, results, or false breakdowns.
They create liquidity pools—zones where many stop-losses are triggered.
Retail traders sell in panic, creating supply.
Smart money absorbs quietly.
This is called accumulation.
Similarly, when they want to sell, they:
Push price up with breakout candles
Attract retail buyers chasing the move
Slowly distribute their holdings
Leave small players trapped at the top
🔄 Concepts You Must Know
1. Accumulation Zone
Where smart money buys silently
Flat or range-bound price action
Volume slowly rising
No major breakout yet
2. Distribution Zone
Where smart money sells quietly
Price looks strong, but momentum slows
Volumes stay high
Sudden rejections from resistance
3. Liquidity Grab / Stop Hunt
A deliberate move to trigger stop-losses and create liquidity
Often seen before real trend begins
Can be traps for retail traders
Example: Price breaks below support, then sharply reverses
📊 How to Track Liquidity & Smart Money Moves
Here are tools and techniques used by traders:
📌 1. Volume Profile
Shows where most trading has happened
High Volume Nodes (HVN): Liquidity zones
Low Volume Nodes (LVN): Price moves quickly
Watch for consolidation near HVNs—could be accumulation/distribution
📌 2. Order Book / Market Depth
For intraday traders
Shows how many buy/sell orders exist at various levels
Spikes in orders may signal liquidity traps or fake pressure
📌 3. Open Interest (OI) in Options
Rising OI + flat price = buildup
Long unwinding or short covering signals smart money behavior
📌 4. FII/DII Data
Track daily net buy/sell figures
Sectoral trends from mutual fund holdings
FII selling = market weakness, especially in large caps
📌 5. Wyckoff Method (Optional but powerful)
Focuses on market cycles
Accumulation → Markup → Distribution → Markdown
Helps understand the intent behind price action
🔥 Common Smart Money Setups
✅ 1. False Breakout Trap
Price breaks above resistance
Retail traders enter long
Smart money sells into strength
Price reverses
How to Spot:
Check volume
See if candle closes above or within resistance
Confirm with next bar’s reaction
✅ 2. Stop-Loss Hunting
Price dips below support
Retail SLs get hit
Price reverses sharply with strong volume
How to Spot:
Sudden wick below major swing low
Sharp V-shaped recovery
Volume spike + reversal candle
✅ 3. Liquidity Sweep Before Rally
Sideways phase ends with a big red candle
Then reversal and trend begins
This is smart money loading positions
🛠️ How to Use This in Trading (With Practical Tips)
✅ For Swing Traders:
Identify consolidation zones with rising volume
Wait for breakout or breakdown with volume
Add volume profile to spot high-activity zones
Check if OI is building around a strike in options
✅ For Intraday Traders:
Track OI buildup + price action around round numbers
Use Market Profile or VWAP to understand liquidity zones
Watch for traps near open or just before close
✅ For Investors:
Watch mutual fund buying sectors
Use MF/ETF monthly reports for accumulation patterns
Avoid chasing rallies—enter during base formation
✅ Final Thoughts
Most retail traders lose money not because their analysis is wrong—but because they don’t understand the rules smart money plays by.
In 2025’s market, where FIIs, algorithms, and institutions dominate, understanding liquidity and smart money behavior is not optional—it’s essential.
You don’t need millions to trade like smart money. You just need the right mindset, tools, and the patience to wait for clean setups.
📌 Remember: “Volume reveals the truth. Price tells the story. Liquidity is the language smart money speaks.
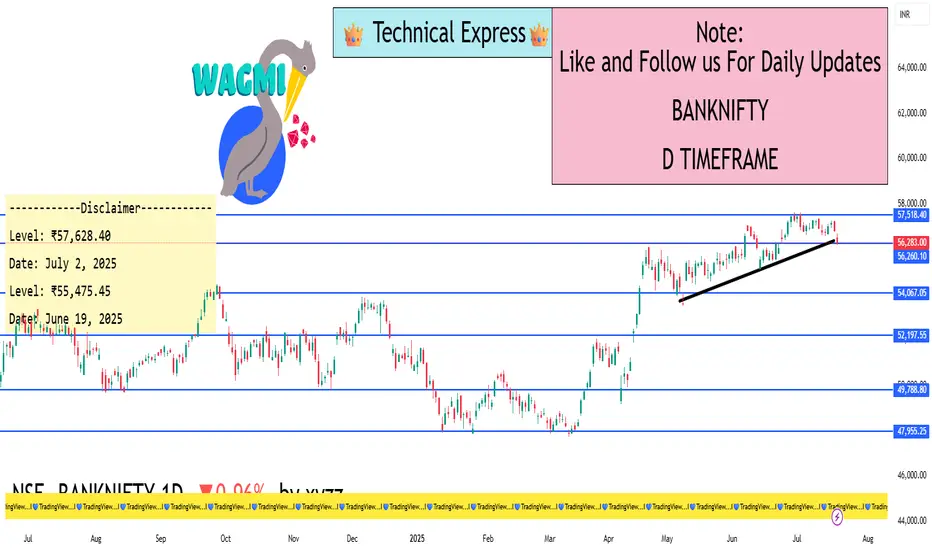
BANKNIFTY - 1D Timeframe📅 Current Market Status (as of July 18, 2025)
Closing Price: ₹56,283
Fall Today: –547 points (–0.96%)
Intraday Range: ₹56,205 (Low) to ₹56,849 (High)
52-Week Range: ₹43,199 (Low) to ₹57,817 (High)
2025 Performance So Far: Up around 9.5%
🧮 Moving Averages – All Are Negative
From 5-day to 200-day, all moving averages are giving SELL signals.
This confirms a strong downtrend.
Price is below every major moving average → means no strength for recovery yet.
📉 Support and Resistance Levels
Type Price Range
Support ₹55,800 – ₹56,000
Resistance ₹56,700 – ₹57,200
If the price falls below ₹55,800, we may see further fall toward ₹55,000.
For any upward trend to begin, Bank Nifty must close above ₹57,200.
⚠️ Market Mood – What’s Going On?
Strong Downtrend: Bears are in control; market is falling continuously.
High Volume on red candles: Big traders are selling heavily.
Oversold Condition: Market has fallen too much, may bounce a little.
High Volatility: Big movements (500–600+ points) can happen daily.
✅ Easy Summary
Overall Trend: Bearish (Downtrend)
Short-Term Possibility: Small upward bounce may come due to oversold indicators
But: No proper recovery signal until Bank Nifty moves above ₹57,200
Traders should be cautious – trend is still weak and selling pressure is high.
🔮 What to Watch Next?
RSI Above 35: Could be an early sign of recovery.
MACD Crossover: Needed for trend reversal.
Low Red Candle Volume: Means selling may be ending.
₹55,800 Support: If this breaks, further downside likely
Nifty 50 - 1D Timeframe📊 Nifty 50 – Daily Chart Overview (1D Timeframe)
Current Close (July 18): Around 24,968
Change: Down ~143 points (–0.57%)
Intraday Range: High ~25,145 | Low ~24,918
52‑Week Range: 21,744 to 26,277
YTD Performance: Approximately +5.6%
📈 Technical Indicators
RSI (14-day): ~32.5
This shows that the market is entering bearish territory, but not yet oversold.
MACD: Below signal line, value ~–67
A clear sell signal, confirming negative momentum.
Stochastic Oscillator: Above 98
Indicates that the index is overbought, and a correction may be due.
ADX (Average Directional Index): ~48
Signifies a strong trend—right now, it’s favoring bearish movement.
Other Oscillators (CCI, ROC, Ultimate): Mostly giving sell signals
🧠 Market Sentiment & Context
Nifty has been bearish for the third straight week
Trading is happening below the 20-day EMA, suggesting downward pressure
Overall tone is range-bound and lacking momentum due to:
Weak quarterly earnings
Foreign investor selling
Global market uncertainty
📉 Volatility & Risk Gauge
India VIX: ~11.2 to 11.4
This is the lowest in 15 months, signaling low market fear
Low VIX often means sideways consolidation and narrow movement
📊 Put-Call Ratio (PCR) & Options View
PCR (based on open interest): ~0.80
Indicates a bearish bias
More calls being written compared to puts
🏦 Bank Nifty Overview (for Comparison)
Close: ~56,283
Drop: ~1%
RSI: ~28 (Bearish)
MACD: Sell signal
Resistance: 57,200 – 57,600
Support: 56,300 – 55,800
Bank Nifty is also showing bearish momentum and mirrors Nifty’s structure.
📅 What to Watch Next
Corporate Q1 results – especially from large caps like Reliance, HDFC, ICICI
Global cues – US inflation, interest rate decisions, global markets
India VIX – If it spikes above 14–15, market fear might return
FIIs activity – Any strong buying/selling can swing the market
✅ Summary (Daily Timeframe)
Nifty is currently weak and range-bound
Key level to hold: 24,900
Key level to break: 25,250
Momentum is with sellers; cautious approach recommended
If no trigger appears, expect sideways movement or slow decline

Trade Like Istitution Why Learn to Trade Like Institution?
Financial markets are not random. They are highly manipulated and structured systems, controlled by major financial entities. When you trade like institution, you stop guessing and start understanding:
Where the big players place their orders.
How liquidity zones work.
Why certain price levels are targeted before major moves.
How you can identify smart money footprints and follow the dominant trend.
This approach teaches you to trade strategically, patiently, and professionally — eliminating the emotional rollercoaster most traders experience.
What You Will Learn in “Trade Like Institution”
✅ Smart Money Trading Concepts
Understand how institutions manipulate markets, create liquidity, and trap retail traders. Learn the basics of accumulation, manipulation, and distribution phases.
✅ Market Structure and Order Flow
Read the market from an institutional perspective using pure price action and market structure analysis. Identify break of structure (BOS) and change of character (CHoCH) signals that reveal when the market is about to move.
✅ Order Block Identification
Learn to locate order blocks, where institutions place their large orders. These zones are often the key areas where price reverses or explodes in a specific direction.
✅ Liquidity Zones and Stop-Loss Hunting
Discover how to identify liquidity pools, understand stop-loss hunting techniques, and position yourself for trades after liquidity grabs.
✅ Risk Management Like Institutions
Master the art of risk management, learning how big players manage risk efficiently to stay profitable long-term, even after losses.
✅ High-Probability Trade Setups
Get access to reliable entry techniques with precise stop-loss placement and optimal reward-to-risk setups that minimize risk and maximize returns.
✅ Live Market Application
Learn through real-world market examples, live sessions, and chart analysis to see how institutional concepts apply in active markets like forex, stocks, indices, and crypto.
Who Should Learn to Trade Like Institution?
This course is designed for:
📊 New traders who want to start the right way without falling into retail traps.
💡 Intermediate traders who have experience but struggle with consistency.
💼 Full-time or part-time traders who wish to level up their skills.
📈 Investors who want to actively manage and grow their wealth.
🎯 Ambitious traders who want to make trading a serious and professional income source.
Benefits of Trading Like Institution
✅ Stop being a victim of market manipulation and start trading with the market movers.
✅ Eliminate confusion, follow clean price action, and trade with confidence.
✅ Avoid low-probability trades by understanding where the real market action happens.
✅ Build strong discipline and follow a professional trading process.
✅ Achieve long-term profitability by managing risk like professionals.
✅ Become a confident, independent trader capable of thriving in any market condition.
Trading success comes from learning the truth behind market movements and following the professional path. This course will completely transform your approach to the markets. With Trade Like Institution, you’ll stop guessing, start predicting, and trade with an edge just like the top institutional traders do every single day

18/07 Gold Outlook – Final Friday Liquidity Moves Ahead!🟡 Gold Outlook – Final Friday Liquidity Moves Ahead!
Will Gold maintain its bullish pace or face weekend volatility? Stay ahead of the market!Why Gold is Moving – Key Macro Drivers
Gold bounced back sharply after a dip caused by stronger-than-expected US economic data. Here’s what Indian traders need to keep in mind:
📊 Rate cut hopes remain high as US core inflation remains sticky.
💣 Middle East tensions continue, with Israel launching more airstrikes on Syria.
🌐 Trade war risks increase as EU threatens $84B in tariffs on US goods.
🟡 Gold is acting as a safe haven in times of inflation concerns and global uncertainty.
👉 All of these factors support gold’s upside — especially heading into the weekend when low liquidity can cause price swings.
📉 Technical Picture – Zones in Play
Gold reversed from FLZ H2 (3310) — a key liquidity and demand zone. Sellers took profits, triggering a surge in buy volume. The price has since tested the OBS Sell Zone + Continuation Pattern (CP) around 334x with strong resistance.
Today, we expect price to revisit lower liquidity pools on the M30–H2 timeframe before the next breakout.
🧭 Key Levels for Friday – Watch Closely
✅ Buy Zone: 3318 – 3316
SL: 3312
TP Targets: 3322 – 3326 – 3330 – 3335 – 3340 – 3345 – 3350 – 3360
💼 Scalp Buy Zone: 3326 – 3324
SL: 3320
TP: 3330 – 3335 – 3340 – 3345 – 3350 – 3360
⚠️ Sell Zone: 3363 – 3365
SL: 3370
TP: 3360 – 3355 – 3350 – 3346 – 3342 – 3338 – 3335 – 3330
🔔 Important Notes for Indian Traders
Today is Friday, and even though there’s no major economic news, the risk of liquidity sweeps and volatility is high. Protect your capital with solid risk management and stick to your TP/SL strategy.
📌 Plan your entries from strong technical zones and don’t chase price — let the market come to you.

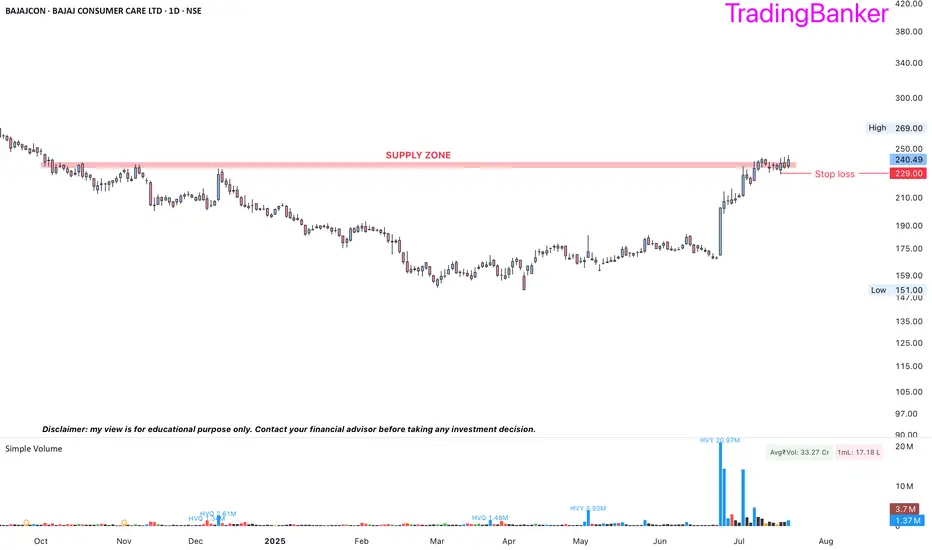
BAJAJCON: a probable long trade➡️heavy volumes and big candles are the footprints of institutions
➡️entry price 233 with a SL of 229
➡️consumption theme
➡️supply zone breakout in the offing and may turn out to be a high reward to risk trade
DOGE Long Swing Setup – Institutional Narrative Heating UpThe Dogecoin narrative is back in focus! Bit Origin ( NASDAQ:BTOG ) is raising $500M to build one of the world’s largest DOGE treasuries—becoming the first U.S.-listed company to treat CRYPTOCAP:DOGE as a core asset. With institutional interest rising, DOGE could see renewed momentum. Our last trade surged 50%—here’s the next entry:
📌 Trade Setup:
• Entry Zone: $0.20 – $0.21
• Take Profit Targets:
o 🥇 $0.23 – $0.24
o 🥈 $0.27 – $0.28
• Stop Loss: Daily close below $0.18
#crypto #DOGE #BTOG

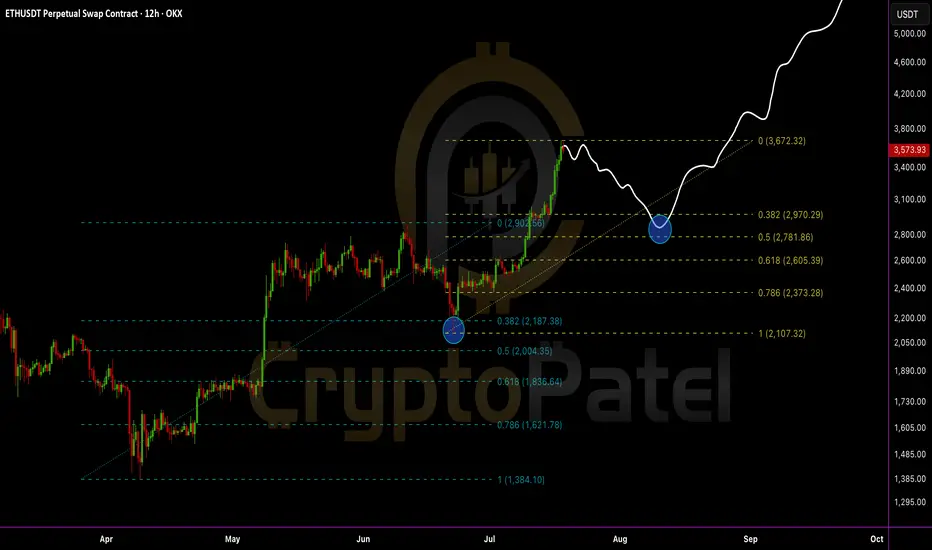
Everyone’s bullish now… but smart traders are waiting for this EEthereum just tapped a key resistance near $3,672 and is starting to show signs of cooling off.
A healthy retracement could bring ETH back to:
0.382 Fib – $2,970
0.5 Fib – $2,781
0.618 Fib – $2,605 (Strong demand zone)
IMO, we can expect ETH to revisit the $2,700–$3,000 zone before the next leg up.
This area will be the golden re-entry for long-term targets of $6,000–$8,000.
Stop-loss: Recent high and candle close above $3,675
Structure remains bullish:
✅ Previous dips into Fibs triggered strong buybacks
✅ Clean higher highs and higher lows
✅ Demand zone + retracement = opportunity
My View: Let price pull back. Then load up again. Bigger wave incoming.
DYOR | NFA
Geopolitical & US Macro WatchWhat Is Geopolitical & US Macro Watch?
This is a two-part term:
1. Geopolitical Watch
This refers to tracking and analyzing global political situations that can impact trade, oil, currency, defense, or investor confidence. Examples include:
Wars or conflicts (Ukraine-Russia, Israel-Gaza, China-Taiwan)
Global oil sanctions
Strategic alliances (e.g., BRICS+ expansion, NATO decisions)
Diplomatic tensions between countries
These events influence:
Crude oil prices
Foreign exchange rates
FII flows (Foreign Institutional Investment)
Global demand-supply outlooks
2. US Macro Watch
This focuses on tracking economic developments in the United States, the world's largest economy. Key areas to watch include:
Inflation reports (CPI, PCE)
US Federal Reserve interest rate decisions
Jobs data (non-farm payrolls, unemployment rate)
Retail sales, housing starts
US GDP growth
U.S. debt levels and political decisions on trade/tariffs
Because the US dollar is the world's reserve currency, and because Wall Street often sets the tone for global markets, these macro signals directly affect India’s equity market, bond yields, and rupee valuation.
🧠 Why Does This Matter to Indian Traders & Investors?
You may ask—“Why should I care about some news in the U.S. or Europe when I’m only buying shares of Indian companies?”
Here’s the reality:
Over 50% of the daily movement in Indian indices like Nifty and Sensex is now influenced by global cues.
Foreign investors (FIIs), who own a huge portion of Indian stocks, take buy/sell decisions based on global trends, not just local stories.
US interest rates affect where FIIs want to put their money—if US bonds are yielding more, they might pull out of India.
Crude oil, which India imports heavily, is priced globally—if a war breaks out, oil shoots up and hits inflation in India.
In short: What happens outside India often decides how India trades.
🔥 Major Geopolitical Risks in 2025
Let’s look at some real-world developments that have been shaking or supporting markets this year:
1. Russia-Ukraine Conflict (Still Ongoing)
Even in 2025, the war isn’t over.
It affects wheat prices, natural gas, and military spending globally.
India has been balancing ties with both Russia and the West, but disruptions affect commodity markets, logistics, and inflation.
2. Middle East Tensions (Gaza, Iran, Red Sea Attacks)
Ongoing conflicts have kept crude oil prices elevated.
Shipping through the Suez Canal and Red Sea has become riskier, increasing global logistics costs.
This directly affects India’s import bill, trade deficit, and rupee stability.
3. US–China Trade Friction
The US has imposed tech restrictions on China; China is retaliating.
If tensions escalate further, it will impact the global supply chain, especially for semiconductors, electronics, and electric vehicles.
Indian tech companies (like TCS, Wipro) may see ripple effects due to changes in global outsourcing dynamics.
4. Taiwan Risk
Any Chinese military action on Taiwan could be catastrophic for markets, especially in electronics and semiconductors.
Since semiconductors power everything from phones to EVs, even a threat here affects stocks globally.
📊 Key US Macro Trends Impacting Markets in 2025
1. US Inflation is Cooling, But Not Gone
After peaking in 2022, inflation has come down, but in 2025, it’s still sticky.
That means the Federal Reserve (US central bank) is not cutting rates as aggressively as markets hoped.
➡️ When the Fed keeps rates high:
US bond yields rise
FIIs pull money out of emerging markets like India
Nifty and Sensex feel the pressure
2. US Job Market Is Strong
A robust job market signals continued economic expansion, good for global demand.
This is why metals, IT, and manufacturing stocks in India rally when US jobs data is good.
3. The Fed’s Interest Rate Policy
The biggest global event each month is the Fed meeting.
If they cut rates, stocks rally globally.
If they pause or raise rates, money flows into safe assets like gold or the US dollar—hurting Indian equities.
Real-Time Example: July 2025
In July 2025, Indian markets have been:
Rallying due to strong US jobs data and earnings
Cautious due to potential Trump-era tariffs on countries buying Russian oil
Watching closely for US inflation print and Fed meeting signals
GIFT Nifty shows bullish strength in pre-market hours when the US ends green. But we’ve also seen sell-offs on days of oil spikes or war-related news.
🧭 How to Track These Developments (Even If You’re Busy)
Here’s a simple checklist for staying informed:
✅ Every Morning
Check GIFT Nifty
Read major global headlines (US data, oil prices, geopolitics)
Note the USDINR trend
Watch India VIX
✅ Every Week
Look at US job reports, inflation (CPI), and Fed speeches
Follow crude oil and gold charts
Track FII/DII activity
Keep an eye on shipping, metals, and defense-related stocks
✅ Final Thoughts
"Geopolitical & US Macro Watch" is not just a fancy term—it's a crucial lens for today’s markets. The biggest stock market moves often come not from company news but from macroeconomic surprises or global tensions.
In 2025, being globally aware gives you an edge:
You’ll avoid panic on news-driven crashes
You’ll better understand why your portfolio is up or down
You’ll identify trade setups ahead of others
👉 Think global, act local—that’s the new mantra for smart Indian investors.
If you want daily or weekly updates summarizing these events and their impact on Indian markets, let me know—I’ll be happy to prepare a custom watchlist or dashboard for you
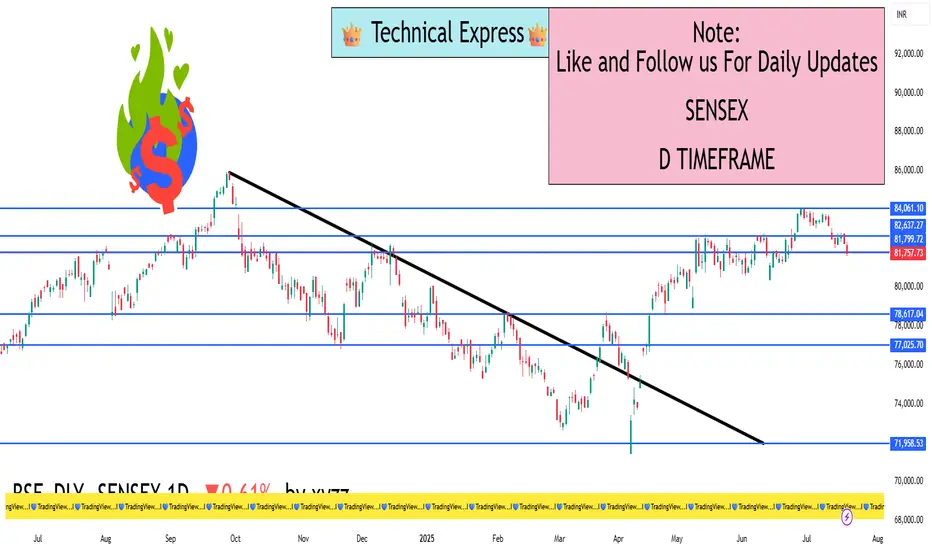
Sensex – 1 Day Timeframe✅ Closing Summary:
Closing Price: ₹82,540.65
Change: −₹501.34 (−0.60%)
Opening Price: ₹83,081.80
Intraday High: ₹83,114.95
Intraday Low: ₹82,488.25
The Sensex fell over 500 points, reflecting broad-based selling across banking, IT, and financial services. The index struggled to hold gains and faced resistance at higher levels throughout the day.
🔍 Key Reasons for the Decline:
Weak Earnings from Financials:
Axis Bank and other financial stocks reported disappointing quarterly results.
As financial stocks hold significant weight in the Sensex, this created negative sentiment across the board.
IT and Tech Sector Pressure:
Global uncertainty, U.S. Fed rate concerns, and weak guidance from global tech firms contributed to a fall in Indian IT stocks like Infosys and TCS, dragging the index.
Foreign Institutional Investor (FII) Selling:
FIIs were net sellers in July, putting pressure on large-cap blue-chip stocks.
Persistent outflows created downward pressure on the index despite support from domestic institutional buyers.
Global Market Cues:
Mixed global signals, rising oil prices, and uncertain interest rate outlooks kept risk sentiment subdued.
Caution ahead of major global economic data further prevented buying enthusiasm.
📈 Technical Outlook (Short-Term):
Support Zone: ₹82,300 to ₹82,000
This is a key demand zone. A breakdown below could lead to further downside towards ₹81,500.
Resistance Zone: ₹83,150 to ₹83,500
Any bounce-back will face selling near this region unless backed by strong buying volume.
Indicators:
RSI: Dropped below 45, indicating weakening strength.
MACD: Shows a bearish crossover, confirming short-term negative momentum.
Volume: Heavier than average, signaling increased institutional activity on the sell side.
📆 Recent Trend Performance:
1-Day Return: −0.60%
1-Week Return: −0.45%
1-Month Return: +1.85%
6-Month Return: +12.3%
1-Year Return: +11.7%
The index remains strong over the long term, but the short-term chart reflects a corrective phase amid sectoral weakness.
🧠 What Traders & Investors Should Know:
Short-Term Traders: Monitor the 82,300 level for signs of bounce or breakdown. Potential intraday setups are forming, but caution is advised.
Swing Traders: Wait for a confirmation candle—like a bullish engulfing or hammer—near the support before entering long positions.
Long-Term Investors: This correction may offer a healthy buy-on-dip opportunity, particularly in stocks with strong fundamentals in auto, capital goods, and FMCG sectors.
💬 Conclusion:
The Sensex declined nearly 0.60% due to earnings pressure from major financials and global uncertainty impacting IT and large-cap stocks. While the market sentiment remains weak in the short term, the long-term uptrend is still intact. Key support around ₹82,300 will determine the near-term direction. If held, a rebound may follow next week, especially if major earnings turn out better than expected.
Advance Option Trading✅ What is Advanced Options Trading?
At the advanced level, traders use option combinations, multi-leg strategies, and hedging techniques to:
Maximize profits
Minimize risks
Take advantage of market volatility and time decay (Theta)
You don’t just predict direction; you trade direction, volatility, and time decay together.
✅ Core Concepts in Advanced Options Trading
1. Greeks Mastery
Delta: Measures how much the option price moves with the underlying asset.
Gamma: Rate of change of Delta.
Theta: Time decay — how much the option loses value every day.
Vega: Sensitivity to volatility changes.
Rho: Impact of interest rate changes (used less by retail).
Understanding Greeks helps you manage profits and risks more precisely
3. Volatility Trading
Institutions trade implied volatility (IV), not just price direction. Advanced traders use tools like IV Rank and IV Percentile to:
Sell options when IV is high (premium rich)
Buy options when IV is low (cheap options)
4. Hedging Techniques
Use options to protect your portfolio from major losses.
Example: Holding stocks and buying Protective Puts to limit downside risk.
Example: Selling Covered Calls to generate monthly income on stock holdings.
✅ Benefits of Advanced Options Trading
💸 Profit in Any Market Condition (up, down, sideways)
⏳ Earn from Time Decay (Theta Decay)
🛡️ Control Risk with Defined Risk Strategies
🎯 Higher Probability of Consistent Returns
📉 Less Capital, More Leverage
✅ Who Should Learn Advanced Option Trading?
✅ Traders with basic options knowledge
✅ Investors wanting to hedge portfolios
✅ Intraday or positional traders
✅ Those seeking consistent monthly income
✅ Final Thoughts
Advanced Options Trading transforms you from a simple buyer/seller to a strategic trader who uses market forces smartly. You don’t chase trades — you set up calculated, high-probability positions and let the market work for you.

Radhika Jeweltech – Classic Contraction PatternTimeframe: Weekly
Structure Observed: Contraction Pattern between Trendlines
Volume: Significant recent uptick 📊
Key Zones:
🔴 Supply Zone above 123
🟢 Dynamic Support from ascending trendline
🟠 Active counter-trendline now breached
After months of lower highs and higher lows, the price has been squeezing into a classic contraction pattern between a descending orange trendline (acting as counter-trendline resistance) and a rising green trendline providing consistent support.
This week’s candle has decisively broken above the descending trendline on strong relative volume.
With the weekly close due tomorrow, all eyes remain on how the candle settles — will it sustain this breakout structurally or retreat below the trendline?
📌 Important Note: This is a technical observation — not a trade recommendation.

Gold’s Next Move After False Headlines & Liquidity sweepXAUUSD 17/07 – MMF Insights: Gold’s Next Move After False Headlines & Liquidity Sweep
🧭 Market Sentiment: Macro Distractions Fuel Uncertainty
The gold market remains under pressure as conflicting geopolitical news and central bank rumors stir volatility. The week opened with rumors that Donald Trump might fire Fed Chair Jerome Powell, sending temporary fear across markets. While Trump later denied the claim, the damage was already done – sentiment remains fragile.
Other active drivers:
Israel’s airstrikes in Syria increase global tension.
EU proposes tariffs on US imports, adding trade friction.
BlackRock warns of delayed inflation pressure as tariffs begin impacting electronics & consumer goods.
💡 All these elements support gold’s potential role as a hedge, but technical signals suggest the market remains undecided.
🔍 MMF Technical Flow Outlook
According to MMF analysis, price structure is unfolding in line with expected liquidity sweeps and order block reactions:
Price rejected from key supply zones near 3,342 – 3,344 (OB + CP structure).
Current bounce around 3,330 – 3,320 signals possible accumulation.
If buyers hold above 3,310, we may see price test the upper OB/VPOC zones again.
Break below 3,310 opens the door toward the MMF liquidity trap zone at 3,296 – 3,294.
🎯 Trade Plan – Precision Entries
🟩 Buy Zone
Entry: 3,312 – 3,310
Stop Loss: 3,306
Take Profits:
→ 3,316 → 3,320 → 3,324 → 3,328 → 3,335 → 3,340 → 3,350
✅ This zone aligns with MMF liquidity retention and H1 continuation structure. Watch for bullish confirmation candles before entry.
🟥 Sell Zone
Entry: 3,362 – 3,364
Stop Loss: 3,368
Take Profits:
→ 3,358 → 3,354 → 3,350 → 3,345 → 3,340
⚠️ Ideal for short-term scalping or reversal confirmation setups. Rejection at VPOC or CP structure validates this zone.
⚠️ Key Notes for Indian Traders
Today’s sentiment is fragile and can shift fast with any unexpected statement from US Fed or geopolitical update.
Apply MMF structure in lower timeframes (M15/H1) for cleaner confirmation.
Avoid early entries. Wait for reaction signals near the marked zones.
💬 What Do You See Ahead?
Will MMF signals lead the market toward the deep FVG zone around 3,296?
Or are bulls getting ready to reclaim 3,360+ zones?
👇 Share your view and let’s trade smarter together with MMF precision.

KOTAKBANK 1D TimeframeWhy KOTAKBANK?
Kotak Mahindra Bank is one of India’s most reputed private banks. It’s known for its conservative lending practices, healthy balance sheet, and strong retail plus corporate banking mix. Over the past few quarters, the bank has focused on digital transformation, stable asset quality, and maintaining margins despite rising interest rate pressures. Because of this, it’s always on the radar of long-term investors.
Now in 2025, with the financial sector showing resilience, KotakBank is gaining attention again—especially among those looking to buy on dips or add during consolidation phases.
✅ Current Price Range
As of mid-July 2025, KotakBank is trading near ₹2,185–₹2,190.
On the 1-day chart, it is showing signs of sideways consolidation with support at lower levels and limited upside pressure—this is perfect for long-term accumulation.
🔍 Key Investment Levels (Support & Resistance)
Let’s break it down into zones:
🟩 Support Zones (Ideal Buy Areas)
These are the levels where buyers often enter and prices tend to bounce back.
₹2,160 – ₹2,175
→ This is your first buy zone. It’s a cushion where the price may fall and stabilize before heading back up. Great for small quantity entry.
₹2,140 – ₹2,154
→ A stronger support zone. If the stock dips further, this is where serious long-term buyers often start accumulating. This level has held up multiple times in the past few months.
₹2,125 – ₹2,130
→ This is the last major support level on the daily timeframe. If the price falls below this zone, it might signal short-term weakness, and one should be cautious or wait for stability.
🟥 Resistance Zones (Profit Booking Areas)
These are levels where the stock might face selling pressure, especially short-term traders looking to book profits.
₹2,194 – ₹2,196
→ This is the first resistance area. If you’re already holding from lower levels, consider partial profit booking here.
₹2,209 – ₹2,228
→ A stronger resistance zone. This has acted as a ceiling for the stock recently. If KotakBank closes above this with strong volume, it may break out for fresh highs.
Above ₹2,228
→ If the stock closes above this level on the daily chart, it could start a new rally towards ₹2,260–₹2,300 zone. This level becomes a breakout confirmation point.
🧠 How to Use These Levels (Simple Plan)
🟢 If You’re a Long-Term Investor:
Start buying small quantities if KotakBank dips to ₹2,160–₹2,175.
Add more at ₹2,140–₹2,154 only if market sentiment remains stable.
Stop-loss: If price goes below ₹2,125 and stays there, pause further buying. It may need time to consolidate.
🔵 If You Already Hold the Stock:
Watch for price to approach ₹2,194–₹2,228.
Book partial profits if you’re short-term focused.
If it breaks above ₹2,228, consider holding more or adding for the breakout rally.
Keep trailing your stop-loss upward as the price moves.
📈 Price Behavior (Technical Summary)
Trend: Currently neutral to slightly bullish.
Volume: Not too aggressive, but steady—shows strong hands are holding.
Momentum: RSI (Relative Strength Index) near 50–55 zone on daily timeframe; neither overbought nor oversold.
Volatility: Controlled; perfect for accumulation, not short-term speculation.
📝 Final Thoughts – Human Summary
KotakBank is not in a breakout mode right now, but it’s forming a base.
If you’re a long-term investor, this is the kind of setup you wait for: clear supports, low volatility, and no hype.
The ₹2,140–₹2,175 area is your opportunity zone.
Just make sure to manage your risk below ₹2,125 and don’t go all-in at once. Gradual accumulation works best in these setups.
If it breaks ₹2,228, get ready for action. That’s your green signal for the next rally
