Institution Option Trading🔍 What Are Options?
Options are financial contracts that give you the right, but not the obligation, to buy or sell an asset at a specific price within a set time. There are two types:
Call Options – Right to buy
Put Options – Right to sell
Institutions use these tools not for speculation but for hedging, portfolio insurance, income strategies, and market positioning.
🧠 How Institutions Trade Options Differently
1. Multi-Leg Strategies
Institutions use advanced strategies like:
Covered Calls
Iron Condors
Vertical Spreads
Calendar Spreads
These strategies allow them to generate income and control risk, unlike directional bets most retail traders make.
2. Risk Management Focus
Institutions never “go all in.” They manage risk using:
Delta-neutral positioning
Hedging with opposite positions
Dynamic rebalancing
Volatility-based exposure control
They measure every trade based on risk-reward, not hope or prediction.
3. Understanding Option Greeks
Institutions actively monitor:
Delta (directional exposure)
Gamma (sensitivity to price change)
Theta (time decay)
Vega (volatility impact)
They use this to manage trades like professionals and adjust positions based on market conditions.
4. Implied Volatility & Volume Triggers
They don’t chase options with hype — they analyze:
Open interest spikes
Volatility crush or expansion
Skew analysis
These help detect big moves before they happen.
5. Smart Money Flow Tracking
Institutional traders leave footprints. You can learn to track:
Block trades
Unusual options activity
Dark pool activity
This reveals where big money is being placed — giving you a serious trading edge.
🎯 What You’ll Learn in Institutional Option Trading
Institutional mindset and objective-driven trading
How to trade options with structure and clarity
How to use Greeks for trade management
Institutional strategies vs. retail mistakes
Real-world case studies from option chain data
👨🏫 Who Is This For?
Traders who want to learn professional-grade options trading
Retail traders looking to stop losses and build consistency
Intermediate traders who want to move beyond basic buying
Investors looking to hedge or enhance returns with options
✅ Final Thoughts
Institutional Option Trading is not about quick profits — it's about risk-managed, high-probability trading with purpose. By learning how institutions trade options, you can elevate your trading game, improve consistency, and avoid emotional mistakes.
Trading

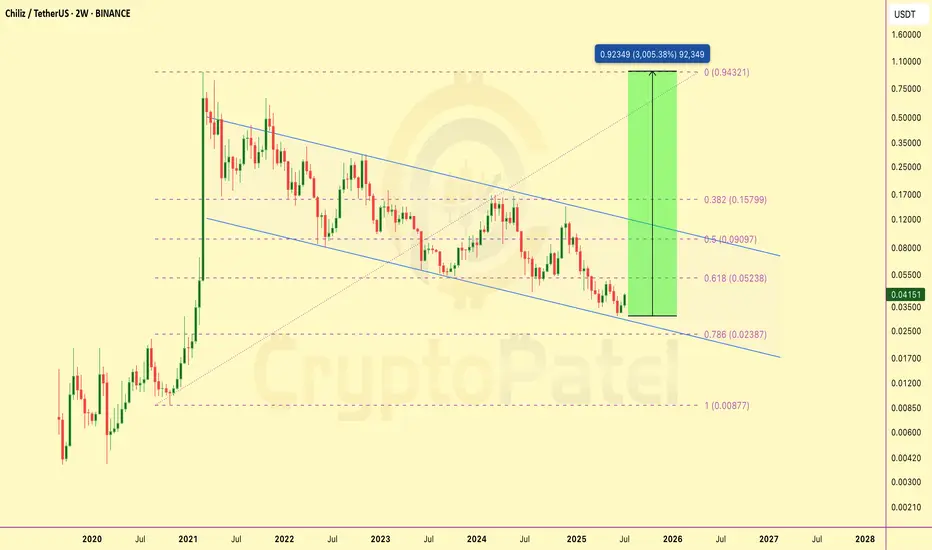
$CHZ did a 30x in 2021. Nobody cared until it was too lateBack in 2021, Chiliz ( GETTEX:CHZ ) delivered a 30x move — climbing from a $130M to $4B market cap in just a month. That move was fueled by strong fundamentals and massive hype around fan tokens.
Fast forward to now — price is sitting at the bottom of a multi-year falling wedge on the 2W timeframe. It just tapped the 0.786 Fibonacci retracement and showed a strong bounce with rising volume — a classic sign of potential reversal.
With solid partnerships, real-world utility, and a historical setup this clean, I’ve started building my position here. If the wedge breaks out, upside targets line up around $0.05 → $0.09 → $0.15 → $0.90 — back toward ATH levels.
Bottom might be in. Watch this closely.
Note: NFa & DYOR
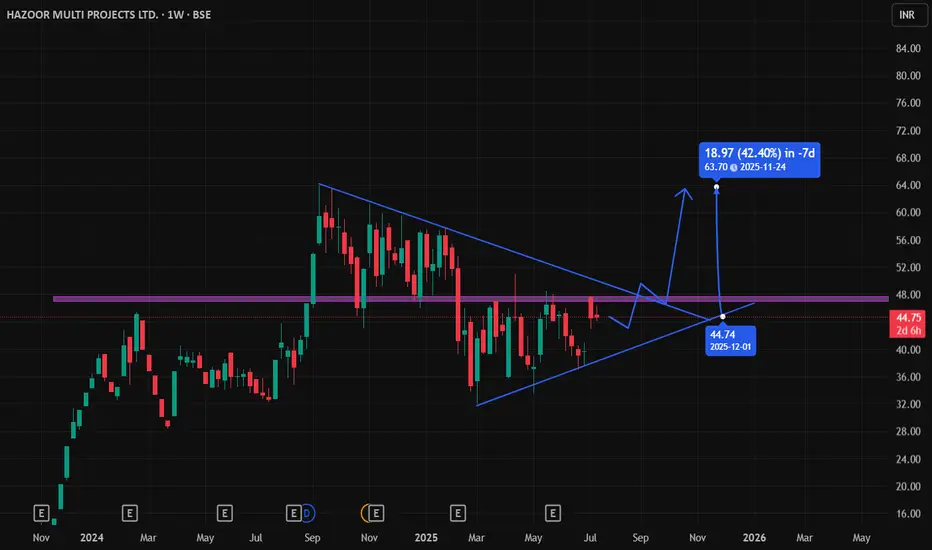
Hazoor Multi Projects Ltd – Long Bias Price Action SetupHazoor Multi Projects has recently shown a strong bullish structure, suggesting accumulation and breakout potential. After a steady phase of consolidation, the stock has formed a clean sequence of higher lows — a clear sign of demand stepping in at every dip.
A strong bullish candle has broken through a key resistance zone, closing well above recent highs with little to no upper wick. This kind of breakout, especially following tight range contraction, often indicates a shift in control from sellers to buyers.
Price is now stabilizing above the breakout level, showing signs of acceptance and strength rather than immediate rejection. The recent price action suggests that previous resistance has flipped into support, offering a solid foundation for a potential move higher.
The stock also appears to be building a fresh base just above the breakout point, hinting at trend continuation. As long as price holds above this new support, the bias remains bullish.
$LTC alert: perfect rebound – $200-$400 next? Don't miss it! NYSE:LTC played out exactly as expected.
It bounced perfectly from our accumulation zone between $60–$70, and is now already up 45% from our entry.
The next big Resistance at $120–$140. If that breaks, we’re eyeing targets of $200 / $300 / $400 / $500.
Yes, $1,000 is still possible, but for now, our focus is on the $500 mark — and I believe this bull run could be the one that finally takes NYSE:LTC there.
I’m confident NYSE:LTC will outperform again, just like in the previous cycles.
And let’s not forget — our very first entry was back at $50.
Are you ready for Litecoin’s next leg up? 👇
Note: NFA & DYOR

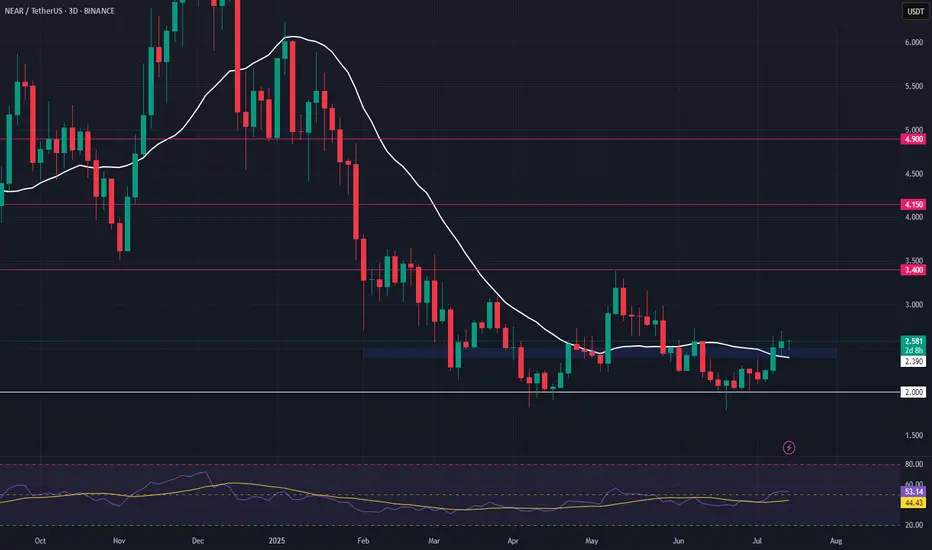
NEAR – High-Timeframe Double Bottom & Bullish DivergenceNEAR is showing strong signs of support, forming a high-timeframe double bottom with bullish divergence after a clean sweep of the $1.80 level. Price has now reclaimed the 20-day SMA, adding confidence to the setup.
📌 Trade Setup:
• Entry Zone: $2.40 – $2.50
• Take Profit Targets:
o 🥇 $3.40
o 🥈 $4.15
o 🥉 $4.90
• Stop Loss: Daily close below $2.00
THETA Long Swing Setup – Bullish Divergence & Range Low ReclaimTHETA has formed a strong bullish divergence off a double bottom, following a deep liquidity sweep to $0.56. With price now reclaiming the 20-day SMA, signs point to a local bottom and potential range low deviation.
📌 Trade Setup:
• Entry Zone: $0.70 – $0.75
• Take Profit Targets:
o 🥇 $0.95 – $1.00
o 🥈 $1.60 – $1.72
o 🥉 $2.13 – $2.25
• Stop Loss: Daily close below $0.65

FLAIR: a probable longPros:
➡️Reduced borrowings and increased fixed assets
➡️Highest ever sales which may increase further and resultantly improve PAT
➡️PE ratio well below the industry PE
➡️Strong breakout from the supply zone and heading into a major resistance, if broken, can yield massive returns
Cons:
➡️Increased retail holding

PSU & Defence Stock Boom🏢 First, What Are PSU & Defence Stocks?
🔹 PSU Stocks
"PSU" stands for Public Sector Undertaking — companies where the Government of India holds a majority stake (more than 51%).
These companies operate in key sectors like:
Defence manufacturing
Railways
Energy (oil, gas, coal)
Power
Finance
Infrastructure
They have a long history of stability, but until recently, they were seen as slow-moving or inefficient.
🔹 Defence Stocks
These include companies that:
Make defence equipment (fighter jets, missiles, radars, warships)
Work with the Indian Armed Forces or export to global defence clients
Provide electronics, software, and parts for defence systems
In India, many defence companies are also PSUs, such as:
Bharat Electronics (BEL)
Hindustan Aeronautics (HAL)
Bharat Dynamics (BDL)
Mazagon Dock Shipbuilders
Cochin Shipyard
📈 Why Are PSU & Defence Stocks Booming in 2025?
Here are the main drivers behind this massive rally:
✅ 1. Make in India + Atmanirbhar Bharat (Self-Reliance)
The government wants India to become self-reliant in defence production, reducing dependency on imports.
Key points:
Ban on importing 450+ defence items that must now be made locally
Big push to increase defence exports
Support to Indian PSUs to ramp up production
Result: More contracts for Indian defence companies = higher revenues and profits.
✅ 2. Massive Order Books
Many PSU defence companies are sitting on huge order books, sometimes 5–7x their annual revenue.
Examples:
BEL: Order book of ₹65,000+ crore
HAL: Got ₹45,000+ crore order for fighter jets + helicopters
Mazagon Dock: Building submarines and destroyers for Navy
Bharat Dynamics: Orders for missiles, torpedoes
The market loves visibility — and order books give confidence in future earnings.
✅ 3. Government Capex Boom
India’s Union Budget 2025 has focused heavily on:
Defence capex: ₹6 lakh crore+ earmarked for the military
Railways & infrastructure spending
Indigenisation of key technologies
This benefits PSU stocks like:
RVNL, IRCON, RITES (railway infra)
BEL, BDL, HAL (defence manufacturing)
BHEL, Cochin Shipyard (industrial & shipbuilding)
✅ 4. PSU Re-Rating + Efficient Management
For years, PSUs were seen as "government-run, slow, and inefficient."
But things have changed:
Better transparency
Higher dividend payouts
Restructuring of loss-making units
More professional management
Now, investors are re-rating these companies — giving them better valuations than before.
✅ 5. Retail & FII Interest
Retail investors are loving PSU stocks because:
Many trade below ₹100–300 levels (psychologically attractive)
High dividend yields (5–10%)
Visible government support
FIIs are entering because:
Valuations are still reasonable
These sectors have strong growth tailwinds
India is among the top 5 global defence spenders
✅ 6. Global Geopolitics
With rising global tensions (Russia-Ukraine, China-Taiwan), countries are increasing defence spending.
India is emerging as a credible exporter of:
Radars
Drones
Warships
Missiles
This has opened up global demand for Indian defence PSUs.
🧾 Real-World Success Stories
Let’s look at some stocks that delivered multibagger returns recently:
Stock Price (Jan 2023) Price (July 2025) Gain %
Mazagon Dock ₹450 ₹2,400+ 400%+
BEL ₹95 ₹320+ 230%+
HAL ₹1,100 ₹4,300+ 290%+
IRFC ₹25 ₹120+ 380%+
RVNL ₹30 ₹300+ 900%+
This is not just hype. These stocks rallied due to:
Strong earnings
Better efficiency
Clear government push
Long-term order visibility
📊 Technical Outlook (July 2025)
PSU Index (NSE PSU Bank + Infra):
At all-time highs
Weekly RSI: Strong, but near overbought (watch for healthy correction)
Trend: Bullish
Defence Stocks:
Many in stage 2 rally (post-consolidation breakout)
Delivery volumes high = institutional buying
F&O interest rising in BEL, HAL, IRFC
🔍 Best PSU & Defence Stocks to Watch (2025–26)
🚀 Defence PSU Leaders
Stock Why It's Hot
BEL Radar, electronics, missile systems, exports
HAL Fighter jets, helicopters, strong order book
BDL Missile maker, strategic tech player
Mazagon Dock Submarine, destroyers, Navy contracts
Cochin Shipyard Exports + defence orders
🛤️ Railway + Infra PSUs
Stock Why It’s Hot
IRFC Rail project financer, consistent income
RVNL Railway EPC projects, delivery volume spike
IRCON Infra + overseas rail projects
RITES Consultancy + export contracts
🔋 Power & Energy PSUs
Stock Sector Focus
BHEL Power infra, defence components
NTPC Renewable + base power growth
ONGC Oil exploration, dividend stock
🧠 Should You Invest Now?
✅ Pros:
Many PSU stocks still offer value despite big rally
Dividends are attractive (3%–8%)
Government is unlikely to reduce support before 2026 elections
Sector is in a long-term structural uptrend
❌ Risks to Consider:
Valuations may be overheated in some names
Any global peace news may reduce defence urgency
PSU stocks may correct if general market sentiment turns negative
Political uncertainty (pre-election) can cause temporary sell-off
📌 What’s the Strategy for Traders?
📅 Short-Term Traders:
Look for breakouts with high delivery volume
Ride trends on daily/weekly chart
Use trailing stop-loss to lock in profits
Don’t chase upper circuits blindly
🕰️ Swing Traders:
Focus on 3–5 week setups
Use support-resistance, trendlines, 50 EMA entries
Look for consolidation + breakout patterns (e.g. flags, cup-handle)
🪙 What’s the Strategy for Long-Term Investors?
Identify quality PSU stocks with high ROE, low debt, and strong order book
Enter on pullbacks or minor corrections
Hold for 2–5 years horizon
Reinvest dividends to build compounding returns
Don’t fall for “cheap but junk” stocks — quality matters
📚 Final Thoughts
The PSU & Defence Stock Boom of 2025 is driven by real, structural changes, not just hype.
India is becoming a global defence player, and PSU companies are finally being run like businesses — with efficiency, innovation, and profitability.
This rally may pause or cool off in between — but the multi-year story is far from over.
💡 "In a country that wants to defend itself, build itself, and grow itself — PSU & defence are the frontlines."

Banking & Financial Sector Near All-Time High in 2025 What Is the BFSI Sector?
BFSI stands for Banking, Financial Services, and Insurance. It includes:
Private and public sector banks (HDFC Bank, ICICI Bank, SBI, etc.)
NBFCs (Non-Banking Financial Companies) like Bajaj Finance, M&M Finance
Insurance companies like LIC, HDFC Life
Financial service firms like HDFC Ltd (pre-merger), IIFL, and brokers
Together, these companies form the backbone of India’s economy, handling everything from loans, credit cards, mutual funds, and insurance to rural financing and digital banking.
Current Market Position (July 2025)
Bank Nifty is trading above 54,000 – just below its all-time high of around 54,500+
Nifty Financial Services index is also hovering near its peak, led by strong performances from key stocks.
This means:
Banking stocks are leading the overall market rally.
Big money — from FIIs, mutual funds, and even retail — is flowing into BFSI.
Investors believe the sector will outperform in the upcoming quarters.
Why Is the Banking Sector So Strong Right Now?
1. Strong Earnings Growth
Most banks reported record profits in Q1 FY26
Examples:
HDFC Bank and ICICI Bank: Strong credit growth and low NPAs
SBI: Continued momentum in retail and agri-loans
Banks are making more money from both lending and investment services.
2. Improved Asset Quality (Low NPAs)
NPA = Non-Performing Asset (a loan that’s not being repaid)
In 2020–21, NPAs were a huge issue due to COVID.
Now in 2025, NPAs are at multi-year lows.
Better risk management + tech-based collections = fewer defaults.
This has improved investor confidence in banks.
3. Credit Demand Is Booming
India’s economy is growing at 7%+ GDP.
People are borrowing more:
For homes, education, business, and consumption
Corporates are also taking loans for:
Expansion, capex, and mergers
More loans = more interest income = better profits for banks and NBFCs.
4. Digital Banking Explosion
UPI, online lending, digital onboarding = huge cost savings
Banks like Kotak, ICICI, and SBI have aggressively expanded digital operations
NBFCs like Bajaj Finance and Paytm (financial arm) are leveraging tech to reach small towns
This is creating massive scale and reach with low overhead costs.
5. FII & DII Buying in Banking
Foreign Institutional Investors (FIIs) have returned in 2025
They prefer BFSI because it offers:
Liquidity
Consistent profits
Strong management
Domestic funds (DIIs and mutual funds) are also overweight on banking because it remains a core component of India’s growth engine.
Key Stocks Driving the Rally
🏛️ Private Banks
Stock Strength Points
HDFC Bank Post-merger synergy, retail + wholesale growth
ICICI Bank Best-in-class digital, strong balance sheet
Axis Bank Loan growth, improving CASA, strong NIM
Kotak Bank Conservative but profitable, strong capital base
IndusInd Bank Retail comeback, strong rural reach
🏦 Public Sector Banks (PSBs)
Stock Strength Points
SBI India’s biggest bank, strong rural and retail
Bank of Baroda Re-rating play, improved asset quality
Canara Bank PSU momentum + rising profitability
💳 NBFCs & Financial Services
Stock Focus Area
Bajaj Finance Consumer lending, digital
M&M Financial Rural auto + tractor finance
IIFL Finance Gold loan, home loan
🛡️ Insurance & AMC Stocks
Stock Focus
HDFC Life Long-term savings + insurance
SBI Life Market-linked insurance growth
LIC Recovery play post-IPO
Technical Picture: Bank Nifty (as of July 2025)
Resistance: 54,500 (All-time high zone)
Support levels: 53,300 and 52,700
Trend: Bullish (price above 20, 50, 200 EMA)
Volume: Rising, especially in HDFC, Axis, and SBI
Technical traders expect:
A breakout above 54,500 could take Bank Nifty to 56,000–57,000
A rejection might lead to healthy pullbacks before the next leg
What Traders Should Do
Intraday/Options Traders:
Focus on Bank Nifty index options on weekly expiry days (especially Thursdays)
Watch for breakout levels and OI build-up
Popular strategies:
Straddle at key resistance
Bull call spreads after breakout
Momentum scalping on ICICI, Axis, SBI
📆 Swing Traders:
Look for range breakouts on daily/weekly charts
Example: Entry on Axis Bank above ₹1,200 with SL at ₹1,160
Hold for 5–10% swing moves
🧾 What Long-Term Investors Should Do
✅ Continue SIPs in BFSI Mutual Funds
Most mutual funds (like SBI Bluechip, Axis Banking ETF) have high exposure to HDFC, ICICI, SBI, etc.
These are long-term wealth builders.
✅ Buy on Dips
If stocks fall 5–10% due to market-wide correction — it's often a buying opportunity, not panic time
Example: HDFC Bank falling from ₹1,800 to ₹1,650 is often bought by institutions
✅ Diversify within BFSI
Mix large-cap banks, PSU turnaround stories, and NBFCs for better returns with less risk
❌ Risks to Be Aware Of
Even though things look great, no rally comes without risks:
Risk Impact
Global Recession Could reduce FII flow
Rate Hikes (Globally) May reduce credit demand
Political Uncertainty 2026 elections might cause volatility
Asset Quality Shock If any hidden NPAs come up
Overvaluation in Mid NBFCs Some stocks may be overheated
💬 Expert Views
Most brokerage houses like ICICI Direct, Kotak Securities, and Motilal Oswal have bullish ratings on top banks.
They expect 10–15% upside in BFSI stocks over the next 6–12 months.
Morgan Stanley and Goldman Sachs are overweight on India’s banking sector in their Asia portfolio.
✍️ Final Thoughts
The Banking and Financial sector in India is booming for all the right reasons:
Strong economy
Clean books
Digital transformation
Massive credit demand
If you’re a trader — this sector offers great volatility and opportunity.
If you’re a long-term investor — this is where India’s structural growth is most visible.

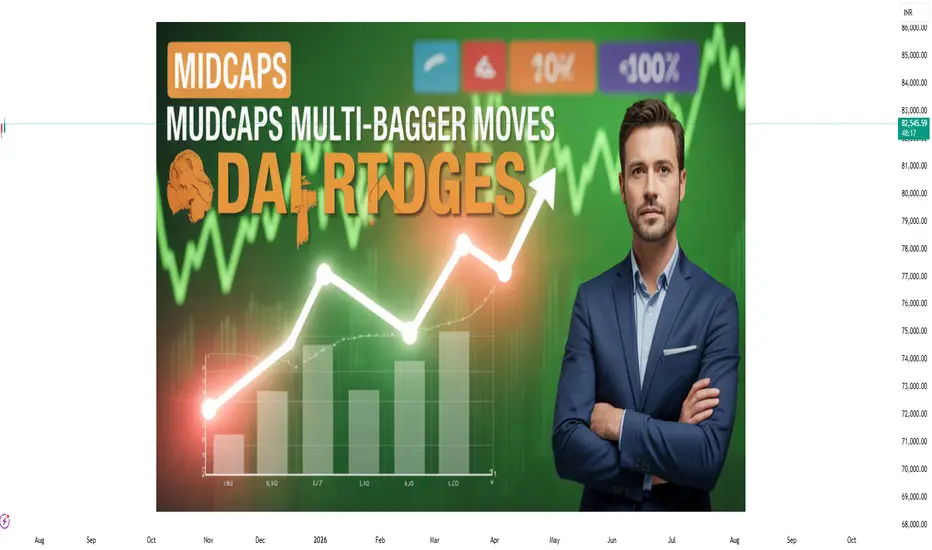
Midcaps & Smallcaps Giving Multi-Bagger Moves🔍 What’s Going On in the Market?
If you’ve been watching the Indian stock market lately, you’ve probably noticed a massive rally in midcap and smallcap stocks. Stocks that were quietly trading in the background are now suddenly up 50%, 100%, or even 200% within months. Investors who took early positions in these counters are sitting on multi-bagger returns — and everyone wants a piece of the action.
You may have heard of recent examples like:
Suzlon Energy – up over 200% in a year
JTL Infra – up 5x in 2 years
Taneja Aerospace, Tata Tele, Lloyds Metals, Zen Tech, and others doubling in months
So, what’s behind this mega rally?
Should you join now or stay cautious?
Let’s break it all down — without jargon, just real talk.
💼 First, What Are Midcaps and Smallcaps?
These terms refer to the market capitalization (total value of a company’s shares).
Category Market Cap (Approx) Example Stocks
Large Cap ₹50,000 Cr+ Reliance, HDFC Bank, Infosys
Mid Cap ₹10,000 Cr to ₹50,000 Cr Cummins India, PI Industries
Small Cap Below ₹10,000 Cr Suzlon, JTL Infra, RCF
📌 Multi-bagger = A stock that gives 2x, 5x, or 10x returns on your investment
🔥 Why Are Midcaps & Smallcaps Flying in 2025?
Let’s look at the real reasons behind this boom.
1. Strong Economic Growth
India is projected to grow over 7%+ GDP in FY26, highest among large economies.
Sectors like defence, infra, power, and manufacturing are booming — and many mid/smallcap companies are direct beneficiaries.
2. Government Push for Capex & Manufacturing
Schemes like PLI (Production Linked Incentive), ‘Make in India’, and massive infrastructure spending have boosted earnings for niche companies.
Railways, roads, power, and defence see record budget allocations.
3. Retail Participation at All-Time High
More retail investors are trading and investing via Zerodha, Groww, Upstox, etc.
They’re moving beyond large caps and discovering low-priced high-potential stocks.
4. FIIs & DIIs Entering Midcaps Again
Big institutions avoided smallcaps for years due to volatility.
Now, even they are entering quality midcaps, fueling fresh momentum.
5. Technical Breakouts & Volume Surge
Chart patterns (like cup & handle, breakouts) are visible on hundreds of smallcap charts.
Delivery volumes (not just intraday) are rising — a bullish sign.
📈 Real Examples: 2023–2025 Multi-Bagger Stories
🌀 Suzlon Energy
Old wind energy player that was almost bankrupt.
Made a comeback with debt restructuring + clean energy narrative.
Went from ₹5 to ₹40+ in 2 years = 700%+ returns
🛠️ JTL Infra
Steel tube manufacturer for infra and construction.
Strong earnings, high promoter holding, and exports rising.
Stock gave 5x return from 2022 to 2025.
💣 Taneja Aerospace
In the aerospace + defence theme, a lesser-known player.
Low float, strong niche, government defence deals.
Stock moved from ₹90 to ₹500+ in less than 18 months.
These are just a few names. There are dozens of smallcap stocks giving 50–200% returns within 6–12 months.
🧠 The Psychology Behind the Rally
Retail Investors: "Small stocks are cheaper, I can buy 1000 shares instead of 5 of Reliance!"
Traders: "Breakouts with volume? Let’s ride it!"
Institutions: "Let’s grab quality midcaps before they become large caps."
This creates a self-fulfilling cycle:
Rising prices → More buzz → More buyers → Higher prices
🧭 But Is It Safe to Enter Now?
This is where you need clarity and discipline. Not all smallcap stocks are worth buying. Some are quality businesses growing fast. Others are just hype, junk, or operator-driven.
Here’s how to approach the current market:
✅ Smart Strategy to Ride the Rally
1. Focus on Fundamentals First
Ask:
Is the company profitable?
Is debt under control?
Are revenues & profits growing YoY?
Is promoter holding strong?
If yes, it's worth tracking.
2. Use Technical Confirmation
Look for:
Breakouts with volume
Sustained uptrends
Support-retest-bounce zones
Avoid chasing gaps blindly!
3. Track Themes That Are in Focus
Current hot mid/smallcap themes in 2025:
Theme Stock Examples
Defence Zen Tech, BEL, Taneja
Railway Infra RVNL, IRFC, Titagarh
Green Energy Suzlon, IREDA, KPI Green
Capital Goods JTL Infra, KEI, KEC
Fertilizers/Chem RCF, NFL, Deepak Nitrite
These themes are backed by government policy + earnings visibility.
4. Avoid Pump & Dump
Stay away from low-volume, “Telegram tip” kind of stocks.
Check if delivery % is high — if not, it’s probably a trap.
💡 Quick Checklist Before Buying a Smallcap
Question Good Sign?
Promoter Holding > 50%? ✅ Yes
Debt-to-Equity < 1? ✅ Yes
Consistent Profit Growth? ✅ Yes
Trading Above 200 EMA? ✅ Yes
Mentioned in Annual Budget/Sector News? ✅ Yes
If 4–5 of these match, it’s worth researching deeper.
🧾 What to Avoid
Stocks with huge moves but no earnings to justify it
“Operator stocks” — low float, sudden spikes, suspicious circuits
Tips from WhatsApp/Telegram without any proof
Stocks hitting back-to-back upper circuits without volume
These often crash when the tide turns.
🛡️ Risk Management Matters More Than Ever
Midcaps and smallcaps are high-return, high-risk areas.
You must:
Never put more than 10–20% of your portfolio in smallcaps
Use a stop-loss for every trade
Book partial profits on every 20–30% move
Don’t marry any stock — even the good ones fall eventually
📊 Long-Term vs. Short-Term Approach
If You’re a Long-Term Investor:
Stick to quality smallcaps with strong business models.
SIP method works well during volatile phases.
Great time to build wealth if you stay patient.
If You’re a Swing Trader:
Use technical setups: cup & handle, breakouts, flag patterns.
Trade 2–4 week timeframes.
Use position sizing — don’t go all in on one stock.
🔮 Outlook for 2025–26
With elections approaching and strong GDP, midcaps/smallcaps may continue to lead.
But correction or volatility is expected — markets don’t rise in a straight line.
Use dips to add, avoid panic exits.
✍️ Final Words
The midcap and smallcap rally in 2025 is not just a bubble — it’s being driven by real growth, real earnings, and massive retail interest. However, not every rising stock is worth chasing. Be selective, research-driven, and disciplined.
“Everyone wants multi-baggers. But only the patient and the smart ones actually catch them.
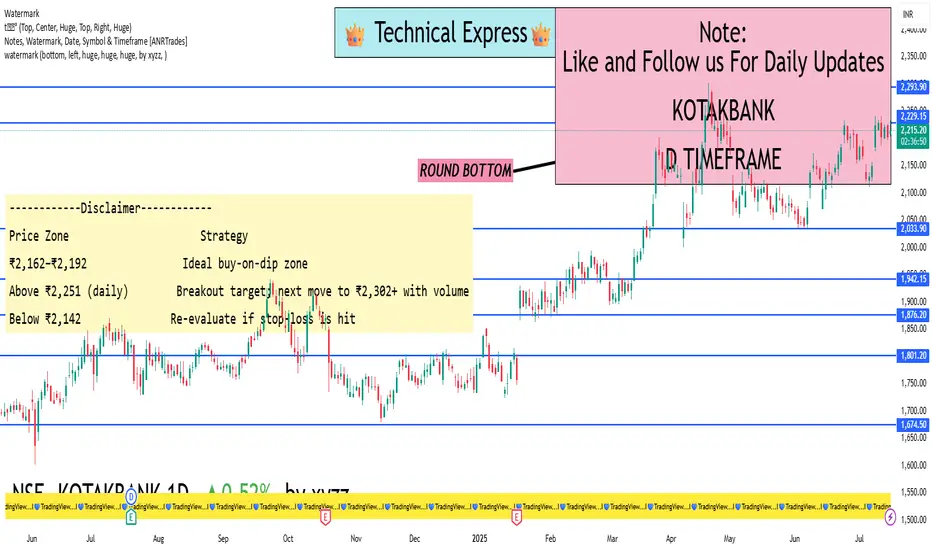
KOTAKBANK 1D Timeframe Current Price & Trend
Current Trading Range: Roughly ₹2,216–₹2,227 (today’s range: ₹2,204–₹2,233)
The stock is in a positive trend, but not yet extended drastically—making now a reasonable entry moment .
Support (Buy-on-Dip) Levels
Here are the levels where the stock is likely to bounce if it pulls back:
₹2,192–₹2,180 – Decent cushion; everyday bounce zone
₹2,162 – Stronger support that previously held price from falling lower
₹2,142–₹2,160 – Broader base zone; still reputable buying area
Resistance (Profit-Zone) Levels
These are key barriers where profit-booking may occur:
₹2,221–₹2,222 – Daily pivot resistance; short-term ceiling
₹2,239–₹2,251 – Next upside target zones; tougher hurdles
₹2,302 (52-wk high) – Major breakout level; a decisive daily close above could spark a fresh rally
What You Can Do
If You’re Holding
Continue to hold—trend is intact.
Consider taking partial profits near ₹2,239–₹2,251 if short-term gains are attractive.
If You Want to Buy
Best buy ranges:
₹2,192–₹2,180 (safe pivot area)
₹2,162 (good buffer zone)
Accumulate in small lots; add on deeper dips.
If You’re Playing Breakouts
Watch for a daily close above ₹2,251—that could open the path to the old high of ₹2,302+ with momentum.
Risk/Stop-Loss
If you buy near ₹2,192, use a stop-loss just below ₹2,180.
If entry is near ₹2,162, a stop under ₹2,142 is prudent.
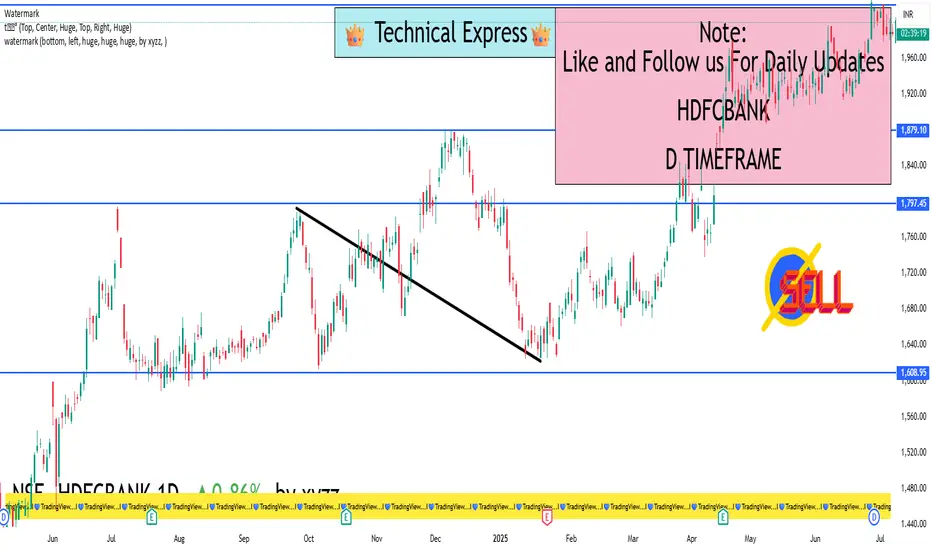
HDFCBANK 1D Timeframe📊 Current Snapshot
Price: Around ₹1,995 (~₹1,990–₹2,000 range)
52-week range: ₹1,588 – ₹2,027 — just below the recent high
✅ Technical Momentum
Overview: Daily technical summary is a "Strong Buy", with moving averages and indicators like RSI (55.3), Stoch, ADX, and CCI all in buy territory
Pivot Level Support: Standard pivots are around ₹1,995
RS Rating (ADR): Strong (83) — above the 80 mark, but extended — suggesting good trend; watch pullbacks
🛡️ Key Price Zones
Support / Buy-on-Dip Areas
₹1,995–₹1,998 – Daily pivot zone
₹1,982–₹1,990 – Standard S1 support
₹1,960–₹1,970 – Deeper Fibonacci/S2 pivot zone
₹1,932–₹1,940 – Strong long-term support (S3–S4 levels)
Resistance / Profit Exit Zones
₹2,007–₹2,015 – Immediate upside pivot resistance (R1–R2)
₹2,024–₹2,025 – R2 zone
₹2,030+ – R3/R4 zone — breakout territory
🧭 Action Plan
1. Currently Holding?
Stay invested — indicators are still bullish.
Think about taking partial profits in the ₹2,015–₹2,025 range, especially if the market overall gets choppy.
2. Planning to Buy?
Best entry: around ₹1,982–₹1,990 (safe zone).
If broader markets dip more, ideal accumulation range is ₹1,960–₹1,970.
Aggressive buying can start near ₹1,995 but keep stop-loss close.
3. Breakout Strategy
A clean, daily close above ₹2,025–₹2,030 on good volume opens up fresh upside toward all-time highs (~₹2,027+).
Can add more after breakout with confidence.
4. Risk Management
Entry around ₹1,982–₹1,990 → set stop-loss below ₹1,960.
If buying near ₹1,960–₹1,970 → stop-loss could be ₹1,930.
SENSEX 1D Timeframe📊 Current Snapshot (As of July 15, 2025)
Recent Close: ~₹82,250
Downside Trend: Sensex has fallen ~1,459 points over the past four trading days, dragging along Nifty—mainly driven by global trade fears, foreign fund outflows, and weakness in IT stocks
Chart Context: The index is approaching its key support area, making now a crucial moment for decision-making
🛡️ Key Support Levels (Buy-on-Dips Zones)
₹82,000 – ₹82,100
A recent intraday low and a likely pivot for the index.
Buying dips here can be a conservative entry for risk-averse investors.
₹81,200 – ₹81,400
Deeper support zone: acts as a cushion in case of broader market drops.
₹80,000 – ₹80,500
Major psychological and technical floor.
Ideal for strong, long-term buying if global headwinds intensify.
🚧 Resistance Levels (Where Pressure May Build)
₹82,450 – ₹82,500
Immediate resistance zone.
A daily close above here could indicate a relief rally.
₹83,000 – ₹83,100
A significant hurdle.
Clearing this, with volume, could trigger a larger bounce.
₹83,400 – ₹83,500
Heavy resistance.
Crossing this opens potential moves toward previous highs (~₹84,000+).
✅ What You, the Investor, Should Do
1. Already Holding?
Stay invested. Trend remains broadly positive unless Sensex closes below ₹81,200.
Consider partial profit-taking near ₹83,000–₹83,100 if you're risk-conscious.
2. Thinking of Buying?
Best zone: ₹82,000–₹82,100 — go slow and buy in tranches.
If deeper pullback: accumulate more near ₹81,200–₹81,400.
3. Playing a Bounce?
If Sensex closes firmly above ₹82,500, that’s a sign of relief.
You could add exposure aiming for ₹83,000+, with a stop-loss below ₹82,000.
4. Protecting Your Position
Stop-loss: consider exiting if Sensex closes below ₹81,200, which would suggest deeper weakness.
🧭 Your Daily ABCs for Sensex
A (Add): Buy near ₹82k and ₹81.2k – ₹81.4k
B (Breakout): Watch for close above ₹82.5k → opens path to ₹83k
C (Cut-loss): Exit below ₹81.2k to avoid deeper downside

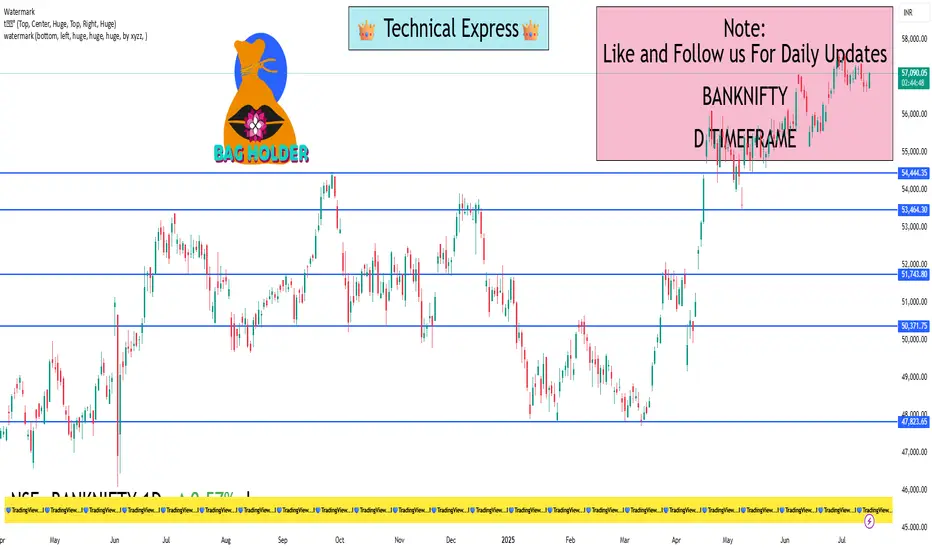
BankNifty 1D Timeframe📊 Current Market Price:
Around ₹56,750 – ₹56,800
Bank Nifty has recently cooled off a bit after touching its all-time high of ~₹57,628. It’s still in a strong uptrend, but showing short-term consolidation—which is healthy for long-term moves.
🛡️ Important Support Zones (Buy on Dips)
These are levels where Bank Nifty is likely to bounce if it falls:
✅ ₹56,200 – ₹56,300
Recent swing low and key 1-day candle support
Ideal first level to enter or add
Can act as a good buying zone if the index dips slightly
✅ ₹55,500 – ₹55,700
Strong demand zone
Acts as a cushion in case of deeper correction
Great zone for long-term accumulation
✅ ₹54,800 – ₹55,000
Previous breakout level
Excellent entry point for long-term investors if panic selling happens
🚧 Resistance Levels (Upside Barriers)
These are levels where profit booking may happen:
🔼 ₹57,000 – ₹57,200
Near current highs; if crossed, momentum may return quickly
🔼 ₹57,600 – ₹57,800 (All-Time High Zone)
Heavy resistance; needs volume to break
🔼 ₹58,500+
Potential future target on strong breakout above ₹57,800
📌 What to Do Now (Investment Plan)
🔹 Already Holding?
Stay invested. Trend is still bullish unless price breaks below ₹55,000.
Consider booking partial profits near ₹57,600 if you're short-term focused.
🔹 Want to Invest Now?
Wait for dip to ₹56,200 – ₹56,300 for safer entry
Start buying in small parts. Don’t go all in at once.
🔹 Aggressive Entry?
You can also consider entering now and adding more on dips
Just place a stop loss near ₹55,000 (daily close basis)
Nifty is consolidating just under ~25,500–25,600
Current Market Picture
Nifty is consolidating just under ~25,500–25,600, having pulled back a bit after last week's dip due to global market jitters and some profit booking
🛡️ Key Support Zones (Ideal Buy-on-Dip Areas)
₹25,000 – ₹25,050
This is the most critical support. A daily close below this could signal deeper weakness.
₹24,900 – ₹24,950
A secondary support zone based on pivot points—if Nifty falls here, it's potentially a good buying window.
₹24,600 – ₹24,700
A deeper backing level used if global or domestic markets take a leg lower.
🚧 Crucial Resistance Levels (Upside Barriers)
₹25,500 – ₹25,600
Near-term ceiling. A breakout and close above ₹25,600 could usher in momentum toward ₹26,000.
₹26,000
Psychological and technical landmark. A decisive move above this signals a strong bullish tilt.
📌 What You Can Do
Already Holding: Stay invested. The trend is constructive unless ₹25,000 is decisively broken.
Looking to Buy:
Watch for mild dips toward ₹25,000–₹25,050—a safe area to add quality index or ETF positions.
Or buy shares now if you believe the upward trend and institutional flows are intact.
Upside Play: A clean daily close above ₹25,600 opens the path to ₹26,000, then all-time highs.

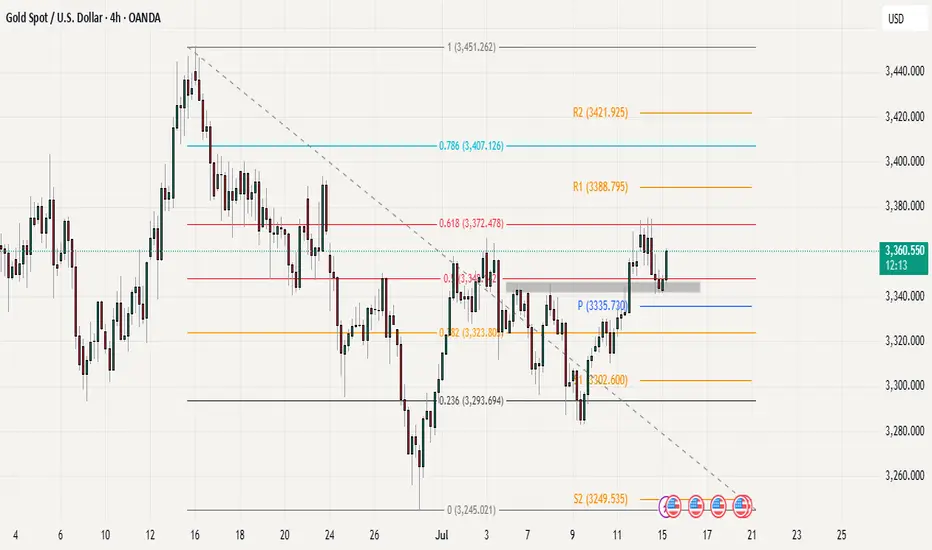
Gold at Critical Support After Fib Rejection CPI Day SetupGold has shown a rejection from the 60% Fibonacci resistance zone as we anticipated, and the price is now testing crucial support levels. The market is currently finding some stability around key areas that we need to monitor closely.
Our primary support zone remains at 3340-3345, which is particularly significant as this was the previous breakout area. This level has proven to be strong in the past and could provide the foundation for any potential bounce. Just below this, we have the 3335 pivot acting as additional support, creating a solid floor for the current price action.
What makes the current setup interesting is that price is attempting to reclaim the 3350 level. If we can see a successful breakout above Monday's high, this could trigger a strong bullish move as it would indicate that buyers are regaining control and pushing through previous resistance levels.
Today's CPI data release will be the main driver for gold's direction.
The trading scenario looks fairly straightforward a break above Monday's high with good volume would signal bullish momentum and could target higher resistance levels. we already seen a strong bounce from the 3340-3345 support zone in opening today,. However, if the 3335 pivot fails to hold, we might see further downside pressure.
Master Institutional TradingInstitutional trading refers to the buying and selling of financial assets—stocks, bonds, derivatives, commodities, currencies—by organizations that invest large sums of money. These trades are typically large in volume and value and are executed through private negotiations or electronic networks designed for block trading.
Key Characteristics:
High volume orders
Priority on stealth execution
Access to premium data
Quantitative modeling
Advanced algorithms

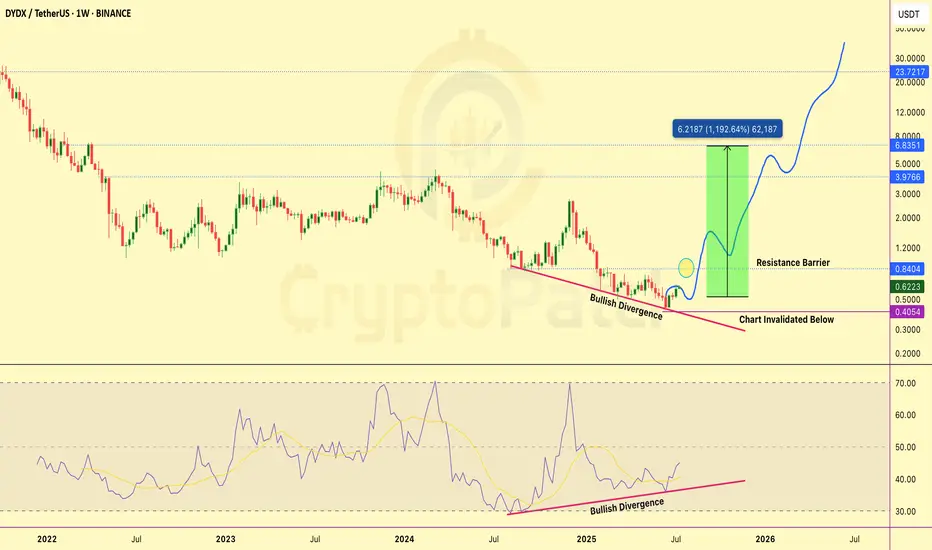
DYDX could be one of the biggest 10x plays this cycle DYDX is finally showing strong reversal signals after months of downtrend.
What’s happening?
We’ve spotted a clear Bullish Divergence on both the price chart and RSI. While the price made lower lows, RSI is printing higher lows — a classic signal that selling pressure is weakening and buyers are stepping in quietly.
Key Levels to Watch:
🔹 Support (Invalidation Zone): $0.405
🔹 If price breaks below this level, the bullish setup is invalid.
🔹 Resistance Barrier: $0.84
Once DYDX closes above this level, a major breakout could unfold.
Upside Potential (if breakout confirmed): $0.84 / $3.97 / $6.83 / Bonus
RSI is also trending upward, confirming hidden strength in the move. Volume is gradually picking up too — another positive sign.
If this divergence plays out fully, we’re looking at a potential 10x+ move from here. Keep a close eye on the $0.84 breakout zone — it could be the ignition point for a major rally.
Always trade with SL and proper risk management.
This is NOT financial advice. Just sharing what I see on the charts.
Option Trading Part-1 What Is Institutional Option Trading?
Institutional Option Trading involves using derivatives (Options) for:
Hedging big equity portfolios
Speculating on volatility or price movement
Arbitrage opportunities
🔹 Key Techniques:
Volatility Arbitrage
Delta-Neutral Hedging
Covered Calls
Protective Puts
Iron Condors & Spreads
How Institutions Use Options Differently
✅ Retail Focus:
Naked calls/puts
Directional trades
Limited capital
✅ Institutional Focus:
Portfolio insurance
Complex multi-leg strategies
Implied Volatility arbitrage
Event-based hedging (like earnings or Fed news)

Option TradingInstitutional Trading – The Backbone of Markets
✅ Who Are Institutional Traders?
They are big market participants such as:
Pension Funds
Insurance Companies
Hedge Funds
Mutual Funds
Foreign Institutional Investors (FIIs)
✅ Why Are They Important?
Provide liquidity in markets
Trade with large volumes
Influence market trends

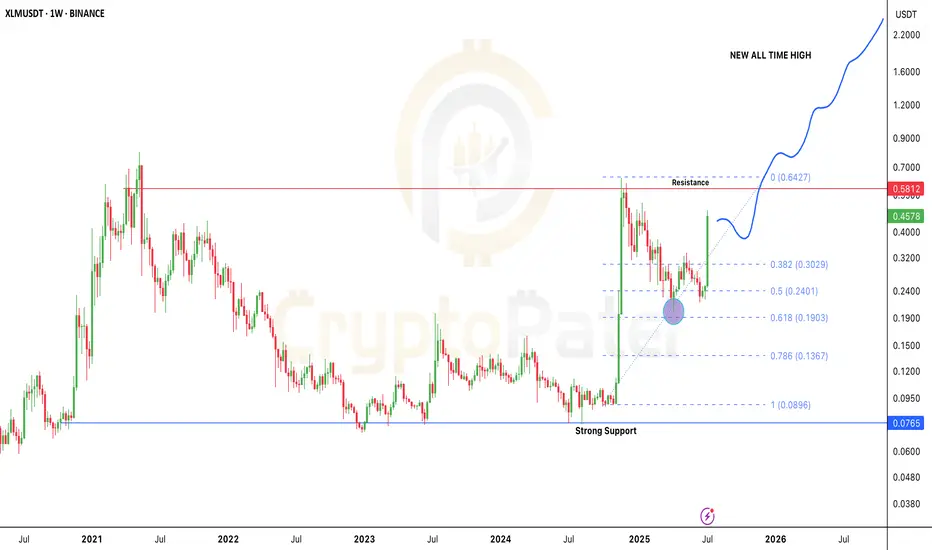
Stellar Breakout: Is $XLM the Next 10x Altcoin of 2025?After months of sideways action and accumulation, Stellar is finally showing real strength.
In the last 4 weeks alone, CRYPTOCAP:XLM has pumped over 120%, bouncing perfectly from the key 0.618 Fibonacci level near $0.19 — a classic reversal zone.
Here’s what’s really going on 👇
🔹 Back in Nov 2024, CRYPTOCAP:XLM went from $0.09 to $0.6374 in just 30 days — that’s a 600% move!
🔹 After that huge rally, price corrected nearly -68%, landing right at the golden Fib zone.
🔹 And guess what? Buyers stepped in hard, flipping the trend back to bullish.
Could we see a pullback?
Sure — maybe a small dip toward $0.30 (0.382 Fib). That’s normal. But the overall structure looks super bullish right now.
Major Resistance: $0.58
If that breaks and flips into support — we’re likely headed toward $2–$5 in the next wave.
This is one of the cleanest macro charts in the altcoin market right now.
👇 Drop your XLM target for this bull run in the comments!
Let’s see who’s aiming for the moon.
Note: DYOR & NFA
Breakout vs Fakeout: Master this logic to become a better TraderBreakouts can be deceiving. In this video, I dive deep into the psychology and structure behind breakouts vs fakeouts, how to spot the traps, and how to trade them with precision.

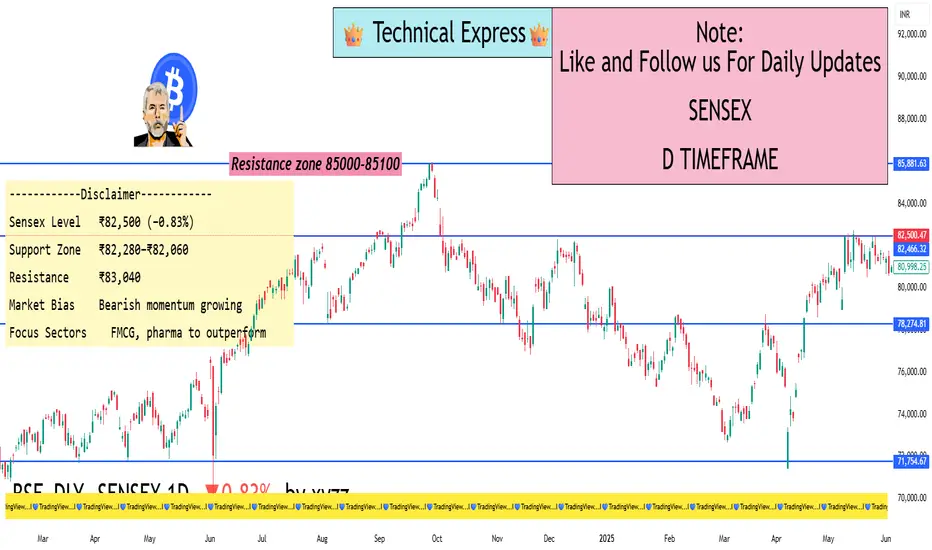
Sensex Dives Below ₹82,600 — IT Stocks Drag Index DownFrom a technical standpoint, Sensex breaking below ₹82,600 is important. This was seen as a short-term support level. Now that it's broken, ₹82,280 and ₹82,060 are the next zones to watch for.
Moving Averages:
Sensex has slipped below its 20-day moving average, which is often used as a trend indicator.
This shows short-term weakness and signals caution for traders.
RSI (Relative Strength Index):
RSI is heading lower but not yet in oversold territory.
This means there could be more downside before a potential bounce.
MACD:
The MACD indicator is also showing bearish crossover – another sign that the market could stay weak in the near term.
What Should Traders & Investors Do Now?
For Traders:
This is a time to stay cautious.
Avoid taking aggressive long positions unless Sensex reclaims ₹83,000+ with strong volume.
Focus on stock-specific opportunities in sectors like FMCG, pharma, or even PSU banks.
For Long-Term Investors:
Don’t panic. Corrections like these are common.
Instead of trying to time the market, look for quality stocks at attractive valuations.
IT stocks are fundamentally strong, so long-term investors can accumulate slowly on dips, especially if they fall further.
Global Factors at Play
What happens in the global economy directly affects Indian markets. Here are some international cues that are influencing Sensex:
US Interest Rates:
The US Federal Reserve may raise interest rates again to fight inflation.
Higher rates make borrowing expensive, slow down spending, and can trigger a global slowdown.
China's Economic Data:
Slower growth in China has worried global investors.
A slowdown in Asia’s biggest economy has ripple effects on global demand.
Geopolitical Tensions:
Trade issues, especially between the US and China, are creating uncertainties.
Wars or unrest in regions like Ukraine or the Middle East also cause global instability.
What to Watch in Coming Days
Key Events:
More Q1 results from major companies
Global inflation data releases
FII (Foreign Institutional Investors) activity – whether they continue selling or start buying
Crude oil price movement – as it affects inflation and currency
RBI commentary on interest rates
📢 Final Thoughts
The fall in Sensex below ₹82,600 is a signal for caution, not panic. The IT sector’s weakness has triggered the fall, but the overall market is still stable when compared to global peers.
For serious investors, this is a good time to review portfolios, build a watchlist, and focus on quality stocks and sectors that show relative strength. Defensive sectors like FMCG and pharma are showing signs of leadership.
Market cycles are natural – after every fall, there's a recovery. The key is to stay updated, stay disciplined, and not let emotions drive your decisions.