$BTC Potential Longing OpportunityWe’ve successfully opened our previous long position at $105,398.80.
What’s next?
I’m currently eyeing the $106,335.70 – $106,716.90 range as a potential zone for the next long entry. Price may retest this area before continuing its move to the upside.
This is not financial advice. Always trade at your own risk.
Trading

Gold Breaks Below 3300 – Smart Buy Opportunity ... Gold Breaks Below 3300 – Smart Buy Opportunity or Warning of a Larger Downtrend?
🧭 Weekly Kickoff: Is the Sell-off Really That Dangerous?
Gold opened this week with a sharp drop, falling to 3306 USD and even breaching the psychological 3300 level to dip into the 329x region. While this could be alarming at first glance, it's more likely a liquidity sweep than the beginning of a sustained downtrend.
The market seems to be preparing for accumulation before the next big move.
🌐 Macro Highlights Impacting Gold
US inflation continues to cool → creates room for the Fed to ease policy if needed
FOMC minutes due this week → traders eye clues for timing of potential rate cuts
Middle East tension eases → safe-haven demand slightly reduced
Trump’s new tax legislation approved → may increase US debt pressure
US–China trade war sees temporary pause → easing short-term geopolitical risk
Overall, this phase resembles a classic consolidation, where breakout potential is growing rapidly.
📉 Technical Outlook – CP Pattern in Focus
A Continuation Pattern (CP) is forming – typically a sign of trend continuation after correction. This suggests current downside movement could be a technical pullback rather than a true reversal.
Price rejected resistance at 3336, broke below 3323 support, and quickly tested the 3303 region – a highly sensitive short-term support.
If the 3293 level is breached, the next liquidity pool lies around 3278 USD, which could trigger aggressive buy interest.
📌 Key Trading Plan – 04 July
🔵 BUY ZONE
3294 – 3292
Stop Loss: 3288
Take Profit Targets: 3298 → 3302 → 3306 → 3310 → 3315 → 3320 → 3330
🔴 SELL SCALP
3324 – 3326
Stop Loss: 3330
Take Profit: 3320 → 3316 → 3312 → 3308 → 3304 → 3300
🔴 SELL ZONE
3350 – 3352
Stop Loss: 3356
Take Profit: 3346 → 3340 → 3335 → 3330 → 3320
💡 Market Insight Today
This is a crucial “decision zone” for gold – the tug-of-war between bulls and bears is heating up. Will gold bounce off the 3290s and resume its upward journey, or are we heading for a deeper correction?
🧠 Keep an eye on the CP formation and price behaviour near key levels.
⚠️ Breakout traders should be patient – the real move may just be loading.

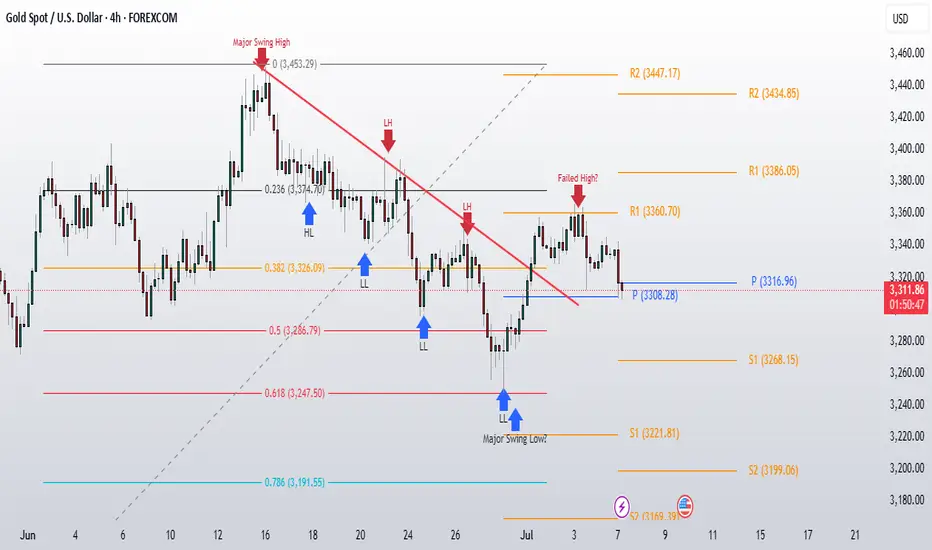
Gold Weekly Analysis : Monday 07/07/2025Gold made a solid attempt to break higher last week, but that 3360 resistance level (previous week's R1) proved to be a tough line to break. The bulls pushed hard but couldn't secure a clean breakout, and now we're seeing some of that momentum fade.
Price opened with a decline today, showing some weakness after last week's failed breakout attempt. This is typical behavior after hitting resistance, some profit-taking and repositioning is expected.
This week's pivot is at 3316, which is actually ascending from last week's 3308 pivot. This is still a positive sign and suggests the underlying structure remains constructive despite the recent pullback.
In the bigger timeframe, gold is still consolidating within a range. We're not seeing a complete breakdown of the bullish structure yet, but rather a pause after the rejection at key resistance.
Critical Levels to Watch:
Upside Breakout Level: Last week's high around 3360 remains the key level bulls need to reclaim for any meaningful continuation higher.
Defense Zone: The 3300-3308 area is crucial support. This zone encompasses both the psychological 3300 level and the previous week's pivot. Bulls need to defend this area to maintain their recent gains.
If price slides below 3300, we could see a decline back toward that recent swing low area. This would signal that the bulls have lost control of the near-term momentum.
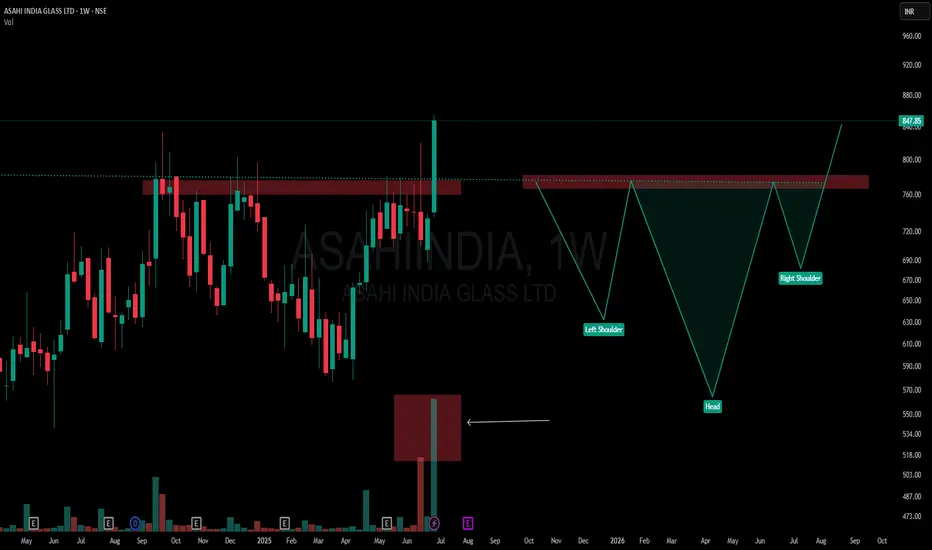
When Textbook Meets Extremes: Perfect Inverted Head and Shoulder📌 ASAHI INDIA GLASS | Weekly Timeframe
🧩 Pattern Breakdown (from a textbook lens):
-Left Shoulder: Formed after the Sept–Nov 2024 rejection
-Head: Created around Feb–May 2025 with a deeper dip
-Right Shoulder: Built through June 2025
-Neckline: ₹750–₹760 zone, tested multiple times
-Breakout Candle: High conviction — wide-bodied, strong close, with 17.61M volume
📘 According to classical technical analysis, Inverted Head & Shoulders patterns often signal a trend reversal. What's notable here is the context — the structure has developed after a sustained move upward, not from a bear phase.
🎯 The candle breaks above a long-standing supply zone with size, volume, and conviction — yet its location at the top makes it structurally interesting and unusual when viewed through traditional pattern psychology.
🚫 This is not a tip, call, or directional bias — just a visual log of structure and volume behavior.
💬 Chart interpretations welcome in comments.
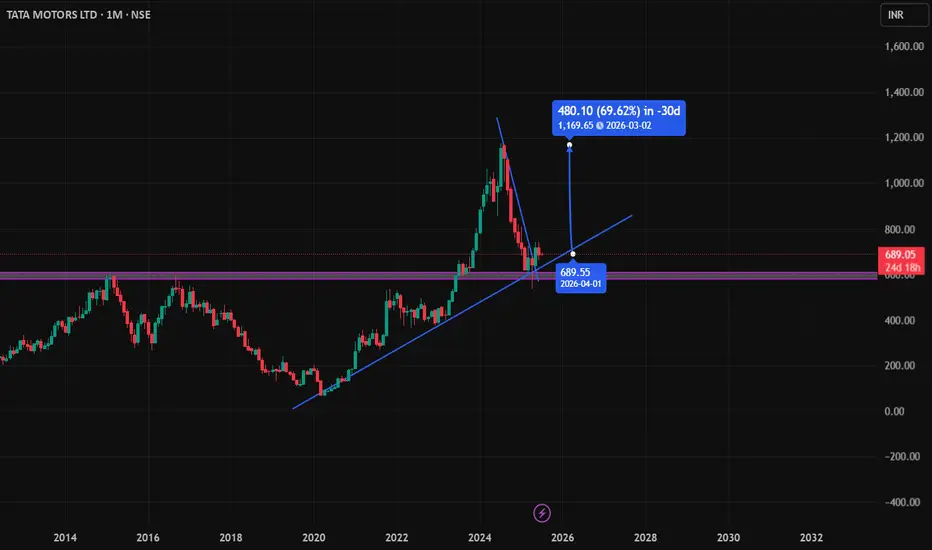
Tata Motors Long SetupTata Motors has confirmed a breakout from its recent downtrend, indicating a potential reversal. The breakout is supported by the formation of a strong bullish candle right at a key support zone, signaling renewed buying interest. This setup suggests favorable risk-reward for a long position, especially with increasing volume and momentum backing the move. Traders can consider entering above the breakout candle with a stop loss below the support.
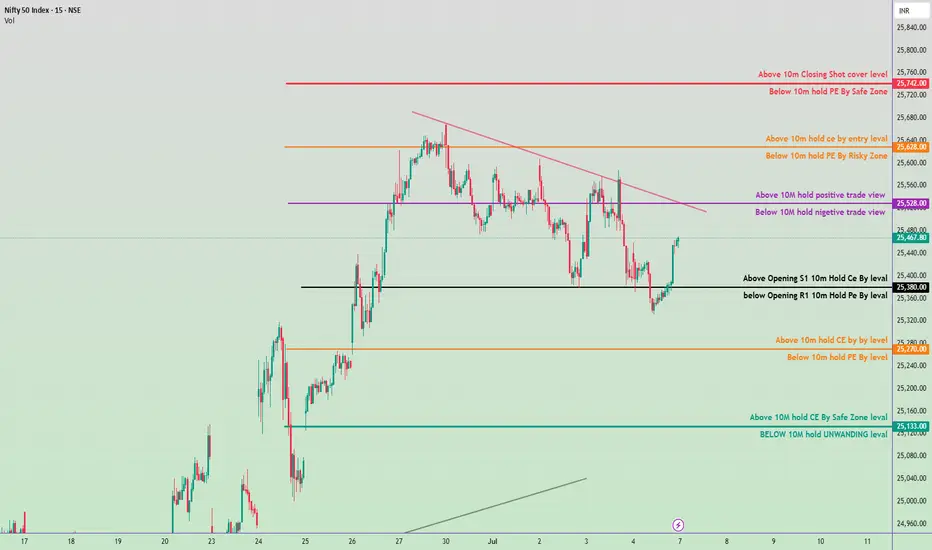
Nifty 50 Intraday Trade Plan - 7 July 2025✅ Bullish Zones (Call Option - CE Buy Levels):
Above 25,133 ➤ Hold CE by Safe Zone level
Above 25,270 ➤ Hold CE by key level
Above 25,380 ➤ Opening S1 Breakout – Hold CE
Above 25,528 ➤ Positive Trade View (10M volume base)
Above 25,628 ➤ Entry level for CE holding
Above 25,742 ➤ Closing Shot – Cover Short Positions
🔻 Bearish Zones (Put Option - PE Buy Levels):
Below 25,133 ➤ Unwinding Level – Hold PE
Below 25,270 ➤ Key level – Hold PE
Below 25,380 ➤ Opening R1 Breakdown – Hold PE
Below 25,528 ➤ Negative Trade View
Below 25,628 ➤ Risky Zone for holding PE
Below 25,742 ➤ Safe Zone for holding PE
🔁 Trendline & Structure Notes:
Downtrend resistance visible around 25,528–25,628 zone.
If price breaks above trendline and sustains, expect bullish momentum.
Support near 25,133 and strong base seen around 25,000 zone.
Kriti Industries Long📢 Kriti Industries – Bullish Alert
Kriti Industries has delivered a decisive breakout from a well-defined consolidation range, backed by rising volume and strong price structure—indicating the start of a fresh uptrend.
🔍 Price Action & Volume Signals:
✅ Tight consolidation resolved with a strong bullish candle—clear sign of accumulation.
✅ Volume expansion on breakout day shows participation by smart money.
✅ Forming a higher high–higher low structure, indicating trend reversal.
✅ No supply pressure at breakout zone—suggests strength and buyer dominance.
✅ Clean breakout above previous swing high confirms shift in momentum.

Gold Update: Bulls Test Weekly R1 at 3360 The 3360 Weekly R1 level is proving to be a solid barrier. This was anticipated, as weekly resistance levels often require multiple attempts or significant volume to break through cleanly.
gold needs substantial volume to power through this resistance level, but we're heading into a low-volume trading environment.
With the US markets closing early today for Independence Day, we're looking at reduced trading activity. This creates a few scenarios:
Lower volume could mean less momentum to break resistance
Thin trading conditions might lead to choppy price action
Any breakout attempts may lack the conviction needed for follow-through.
3308 Major Support: This remains our key downside level to watch. If the bulls can't make progress at 3360 and we see some profit-taking, this support zone becomes crucial for maintaining the recent bullish momentum.
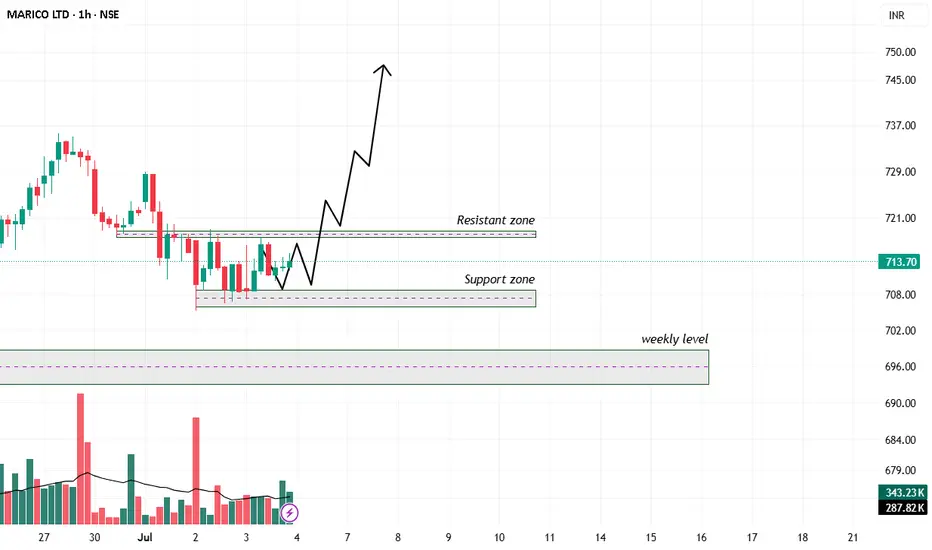
Technical Analysis: MERICO LTDTrend and Structure:
The chart shows a strong uptrend leading up to a recent pullback.
After the pullback, price is consolidating between a support zone (~708 INR) and a resistance zone (~720 INR).
There is a clear weekly support level marked around 690-695 INR below the support zone.
Volume is moderate but showing no large spikes, indicating potential consolidation.
Support and Resistance:
Immediate resistance zone is around 718-721 INR, acting as short-term overhead supply.
The support zone is roughly between 707-710 INR, serving as a base for potential bounce.
The weekly level below (roughly 690-695 INR) may act as a strong support if price breaks current support.
Price Projections:
The drawn projection suggests a short-term dip toward the support zone, followed by a strong bounce above the resistance.
This implies a possible bullish continuation after a minor correction or consolidation.
Volume:
Volume during consolidation is relatively steady.
Watch for volume pickup on a breakout above resistance for confirmation.
Trading plan:
Entry:
Consider entering a long position near or just above the support zone (~708-710 INR) when there is confirmation of buying interest (e.g., bullish reversal candlestick or volume spike).
Alternatively, a breakout entry can be taken above the resistance zone (~720-722 INR) with volume confirmation.
Stop Loss:
Place a stop loss below the support zone or slightly below the weekly level, around 700-705 INR to protect against downside risk.
Targets:
Initial target near the resistance breakout level (~720-725 INR).
Secondary target around 745-750 INR based on the upward arrow projection, representing the next resistance area.
Risk-Reward:
Risk: Approximately 8-10 INR per share.
Reward: Potential gain of 35-40 INR per share.
Favorable risk-reward ratio around 3:1 or better.
Additional Notes:
If the price falls below the support zone and weekly level with strong volume, consider exiting or avoiding long positions.
Look for confirmation signals before entry to reduce false breakouts or breakdowns.
Summary:
Table
Parameter Details
Entry Price ~708-710 INR (on support)
Stop Loss ~700-705 INR
Target 1 ~720-725 INR
Target 2 ~745-750 INR
Trend Pullback in uptrend
Risk-Reward Ratio ~3:1 or better
Institutional Master class
Option Trading Explained
Options are financial derivatives that provide the right, but not the obligation, to buy or sell an underlying asset at a predetermined price within a specific period.
Types of Options:
Call Option: Right to buy the underlying asset.
Put Option: Right to sell the underlying asset.
Components of an Option Contract:
Strike Price: The agreed price to buy/sell.
Premium: Price paid to acquire the option.
Expiration Date: Date when the option contract ends.
Option Trading Strategies:
Buying Calls/Puts: Simple directional bets.
Covered Call: Holding stock while selling a call option to generate income.
Protective Put: Buying a put option to hedge a long stock position.
Spreads: Combining options to limit risk and cost.

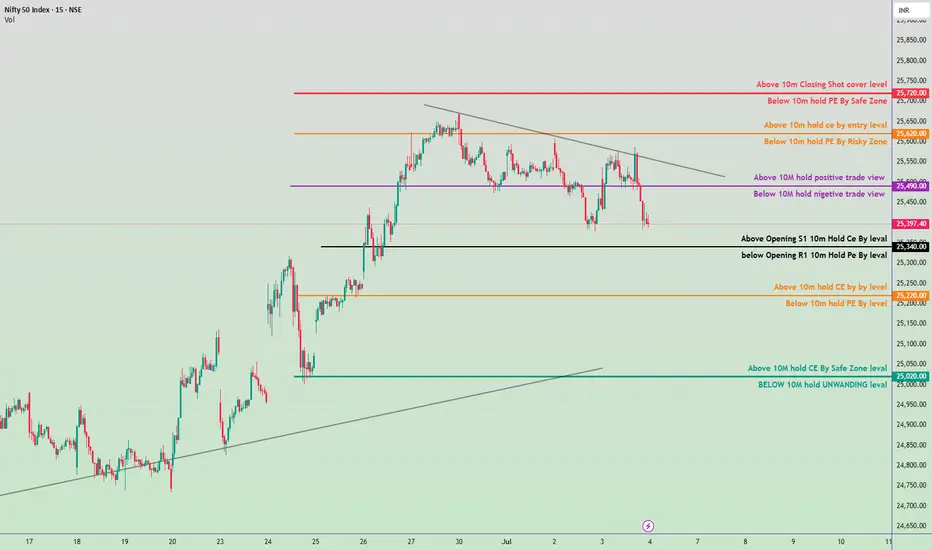
Nifty 50 Intraday Trade Plan for July 4, 2025🔼 Bullish (Call Option / CE Buy Strategy)
✅ Zone 1: Above 25,490
If Nifty holds above 25,490 for 10 minutes, sentiment turns positive.
This is the first sign of bullishness. You can initiate CE positions with caution.
✅ Zone 2: Above 25,620
Holding above 25,620 for 10 minutes = entry confirmation for CE buy.
This is a riskier zone but indicates bullish breakout strength.
✅ Zone 3: Above 25,700
If Nifty sustains or closes above 25,700, short covering may start.
This is a safe zone for CE buyers with strong momentum.
🔽 Bearish (Put Option / PE Buy Strategy)
🚫 Zone 1: Below 25,490
Holding below 25,490 for 10 minutes turns view negative.
Suitable to initiate PE trades cautiously.
🚫 Zone 2: Below 25,340
This is the Opening R1 level. Holding below it confirms bearishness.
Good level to enter PE with confirmation.
🚫 Zone 3: Below 25,220
Holding below this level confirms continuation of bearish move.
Another chance to buy PE if missed above.
🚫 Zone 4: Below 25,000
If Nifty breaks 25,000 and sustains below for 10 minutes:
It enters a strong unwinding zone.
Strong selling may follow.
🔁 Neutral / Flip Zones (Critical for Trend Decision)
➖ 25,340 Zone:
If Nifty stays above 25,340 for 10m, you can try CE.
If it breaks down, look for PE below 25,340.
XAUUSD 03/07: GOLD IN THE DRIVER'S SEATXAUUSD 03/07: GOLD IN THE DRIVER'S SEAT – WILL IT BREAKOUT OR PULLBACK BEFORE KEY EVENTS?
Gold is on a solid upward trajectory, as expected from earlier predictions this week. After a negative ADP Non-Farm Payroll report yesterday, the USD weakened, providing the fuel for gold to soar. During the US session, gold surged from the 333x level to 336x.
🔑 Key Catalysts to Watch:
1. Political Factors:
Trump's announcement that the Republicans in the House have united to push through the "Super Bill" is a significant factor that could propel gold even further in the near future. The political climate is setting the stage for gold's potential rally.
2. Macro Overview:
Federal Reserve and Rate Cuts: The market is eyeing the Fed closely, with high expectations for two interest rate cuts this year. This could put continued pressure on the USD and further support gold. With a 90% chance of a rate cut by the end of Q3, the path is clear for gold to target new highs.
US Economic Data: Disappointing ADP data, reporting a loss of -33k jobs, continues to point to a weakening labor market, strengthening the case for gold as a safe-haven asset.
🌍 Market Conditions and Trade Setup:
The market remains on edge with these political and economic factors at play. The market will also be watching the Non-Farm Payrolls (NFP) data closely. With the ADP report showing poor results, the market could experience some turbulence ahead of the NFP release, and with a long weekend ahead due to the bank holiday, traders should approach this market with caution.
📉 Technical Outlook – The Road Ahead for Gold:
Gold has been trending upward and maintaining a bullish outlook. However, a minor pullback is expected.
Resistance: 3358 – 3365 – 3374 – 3380 – 3390
Support: 3343 – 3335 – 3325 – 3316 – 3304
📊 Trading Plan – Key Levels to Watch:
Buy Scalp:
Entry: 3335 – 3333
SL: 3329
TP: 3340 → 3345 → 3350 → 3360 → 3370
Buy Zone:
Entry: 3316 – 3314
SL: 3310
TP: 3320 → 3324 → 3328 → 3332 → 3336 → 3340 → 3350 → 3360
Sell Scalp:
Entry: 3374 – 3376
SL: 3380
TP: 3370 → 3366 → 3360 → 3355 → 3350
Sell Zone:
Entry: 3388 – 3390
SL: 3394
TP: 3384 → 3380 → 3376 → 3370 → 3366 → 3360
⚠️ Key Focus for Traders:
Upcoming Data: The NFP release will be crucial, as disappointing job numbers could drive gold even higher.
Market Volatility: With the long weekend ahead and market reactions to key news, be prepared for possible volatility.
Trade with Caution: Stick to your TP/SL strategy, manage risk, and only enter trades when clear setups appear.
📈 Conclusion:
Gold is showing strong potential for further gains, but traders should be prepared for some pullbacks as the market reacts to upcoming economic and political news. The trend remains bullish, but it’s crucial to remain cautious and follow the technical levels closely to optimize entry points. Stay alert for key developments in the USD, NFP, and Fed rate-cut expectations, and let the market guide you.

Trade Recommendation – BUY WTI Crude Oil (USOIL) – Entry #2✅ Trade Recommendation – BUY WTI Crude Oil (USOIL) – Entry #2
📅 Date: July 3–4, 2025
🕒 Timeframe: 1H
🎯 Trade Setup:
Entry Zone: 66.30 – 66.40 USD/barrel (short-term support and EMA20 zone)
Stop Loss (SL): 65.60 USD (below MA200 and previous bullish candle base)
Take Profit (TP):
• Target: 68.40 – 68.50 USD
📊 Technical Analysis:
Healthy pullback after a strong bullish breakout — price is currently consolidating around EMA20, potentially forming a new upward leg.
Volume surged during the July 2–3 breakout, indicating strong institutional buying interest.
Price structure: Clear uptrend with higher highs and higher lows.
Bollinger Bands: Price touched the upper band and is now retracing to the mid-band — a common continuation pattern.
EMA20 is acting as dynamic support.
🧭 Strategy Notes:
Wait for price to retrace into the 66.30 – 66.40 zone with a confirmation signal (e.g. bullish pin bar or engulfing candle).
Consider scaling in and holding the position toward the resistance area of 68.40 – 68.50.
Cut loss if price breaks below 65.60 and invalidates the current bullish structure.
fl me & ytb, winrate 90%! Thank

$BTC Potential Opportunity$105,398.80 is a promising zone for the next potential long entry on $BTC.
If this level fails to hold, the next key area I'd be watching for a possible long opportunity is around $303,000.
This is not financial advice. Always trade at your own risk.

Strong Bullish Momentum or a Short-Term Setback?XAUUSD Analysis – 02/07: Strong Bullish Momentum or a Short-Term Setback?
Gold has made a strong recovery after a brief period of consolidation last month, and it continues to show signs of strong bullish momentum. The price has been fluctuating, yet the overall trend remains positive. Let’s dive into the technical setup for today’s trading session.
📊 Market Overview:
Recent Price Action: After confirming a bullish reversal on the H1 timeframe earlier this week, Gold has surged significantly. Yesterday, it reached 3358, completing wave 3 of an Elliott structure on the M30 chart, followed by a slight correction during the US and Asian sessions.
Short-Term Correction: Wave 4 is currently underway, and there are two potential outcomes for this correction:
It could find support at 3328-3330, leading to a continuation of the bullish trend.
Alternatively, it may dip further to the 330x range before resuming the uptrend.
🧭 Key Levels to Watch:
Support: 3328 – 3313 – 3304 – 3294
Resistance: 3344 – 3360 – 3368 – 3388
🧠 Trading Strategy for Today:
Buy Scenario:
Watch for a potential bounce around the 3328-3330 range. If this area holds, we can look for buying opportunities with a target towards 3358 and 3360.
If the price breaks through the 3340 level, consider entering long positions and setting targets around 3350-3360.
Sell Scenario:
Sell Near Resistance: A quick scalping opportunity could arise near the 3388-3390 resistance zone. Tight SL and reasonable TP at 3384-3380 are the targets to aim for.
For a longer-term Sell position, wait for a clearer breakdown below 3370 to target deeper levels like 3360.
🎯 Trading Plan for Today:
BUY ZONE:
Entry: 3306 – 3304
SL: 3300
TP: 3310 → 3315 → 3320 → 3325 → 3330 → 3340
SELL ZONE:
Entry: 3388 – 3390
SL: 3394
TP: 3384 → 3380 → 3376 → 3370 → 3365 → 3360 → 3350
⚡️ Key Considerations:
The US macroeconomic data release and potential volatility from ADP NonFarm Payrolls today could provide significant movement, so stay alert and monitor the data closely.
In Summary:
Bullish bias remains intact with strong buy opportunities around key support levels like 3328-3330.
For short-term traders, focus on quick scalping within the resistance zones, but don’t forget to follow the trend for the longer-term buy strategy.
💡 Stay cautious with your Stop Loss (SL) and Take Profit (TP) to manage risk effectively. Happy trading! 🌟

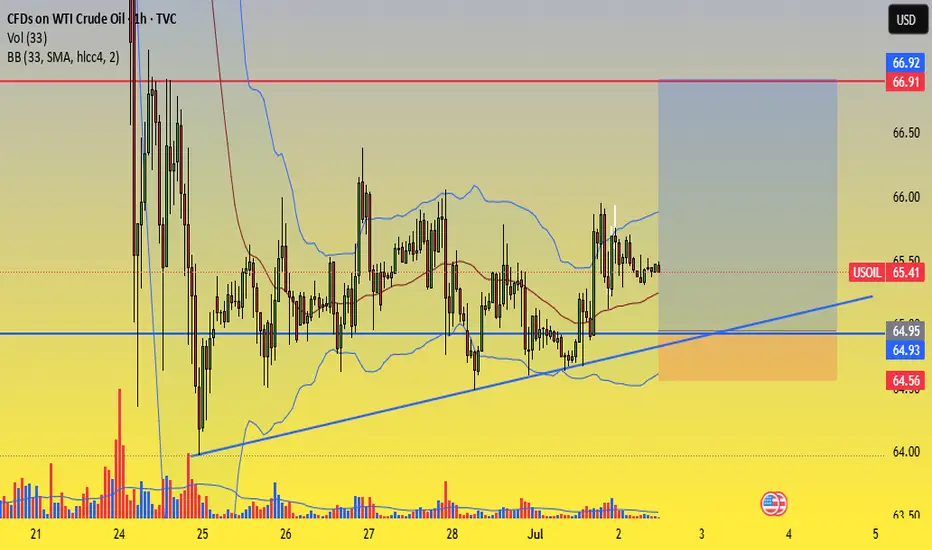
Trade Setup – BUY WTI Crude Oil (USOIL)✅ Trade Setup – BUY WTI Crude Oil (USOIL)
📅 Date: July 2–3, 2025
🕒 Timeframe: 1H
🎯 Trade Parameters:
Buy Zone (Entry): 65.00 – 64.90 USD/barrel
Stop Loss (SL): 64.55 USD (below rising trendline and lower Bollinger Band)
Take Profit (TP):
• TP1: 66.50 USD
• TP2: 67.00 USD
📊 Technical Analysis Highlights:
Rising trendline from June 24 continues to hold, forming a solid support area around 64.9–65.0.
Bollinger Bands are narrowing, indicating potential volatility expansion. Price is consolidating near the mid-band (MA20), often a precursor to bullish breakout.
Volume shows signs of accumulation around the trendline, suggesting buying interest at key support.
Multiple rejections from 64.90 without breakdown reinforces this level as near-term support.
🧭 Strategy Notes:
Enter on price pullback to the 65.00–64.90 zone with confirmation (e.g. bullish pin bar, engulfing pattern, volume spike).
Suggested position management:
• Take 50% profit at 66.50
• Hold the remaining 50% toward 67.00 if momentum is strong.
If price breaks below 64.55 with strong volume, exit the trade to preserve capital.
Good luck Everybody! Fl me here and ytb ! Thanks
XAUUSD 01/07: GOLD'S RELIEF RALLY FROM A MONTHLY LOWXAUUSD 01/07: GOLD'S RELIEF RALLY FROM A MONTHLY LOW – USD WEAKENS, BUT CLEAR MOMENTUM IS STILL MISSING
🌍 Market Overview – USD Weakness & Gold's Rebound Potential
After a significant drop to a one-month low, Gold is beginning to recover slightly, partly due to a weaker USD, improving market sentiment. However, the rally remains cautious and still lacks a strong momentum to push gold decisively higher.
💵 USD Weakness: Can Gold Continue to Rebound?
Recent US economic data has shown a slight decline in consumer spending, which has led to speculations that the Federal Reserve may take a more dovish stance on interest rates in the near future. This has weakened the USD, providing room for Gold to rebound slightly.
That said, there hasn't been a significant catalyst to push Gold into a strong breakout yet.
📉 The Fed is Still the Key Player
The market is closely watching the Fed's next moves. However, there’s a divide on whether interest rates will be cut or maintained. The recent US data isn’t weak enough to warrant a policy change from the Fed, but it’s also not strong enough for the Fed to keep its hawkish stance intact.
This leaves Gold in a limbo, with no clear direction in the near term. Gold is caught between weak expectations of further rate cuts and the ongoing strength of the USD.
🧠 Analysis for Traders:
Gold is responding lightly to macroeconomic factors but hasn’t established a strong trend. This is a period prone to market noise—Gold may jump up and down on news, but the momentum required to establish a consistent trend is lacking.
Traders should monitor USD movements and US labor data closely this week, especially the NFP report, as this could provide more clarity for Gold’s future direction.
✍️ Conclusion:
Gold is recovering from its lows, but it remains uncertain.
The Buy side hopes for rate cuts by the Fed.
The Sell side is betting on USD strength.
As for us traders, let’s stay patient, observe closely, and be ready for the next move. The big wave may still be coming, but smaller price actions right now could give us clues for the upcoming trend.
🔶 Key Levels & Strategy:
Current Support Zone: Gold is holding above the critical psychological support levels of 3300-3304. If the upward momentum continues, a move towards 335x-337x is highly possible in the near term.
Liquidity Gap: Currently, there’s a liquidity gap at the higher levels. The goal is for Gold to rise further to fill this gap before any deeper retracement occurs.
📈 Trading Plan:
BUY ZONE: 3303 – 3301
‼️ SL: 3297
✔️ TP: 3306 → 3310 → 3315 → 3320 → 3325 → 3330 → ???
SELL ZONE: 3358 – 3360
‼️ SL: 3364
✔️ TP: 3354 → 3350 → 3345 → 3340 → 3320
⚡ Final Thoughts:
As the market awaits further data, keep an eye on these key support and resistance levels for your trading setups.
The overall trend is still upward, but short-term volatility is expected. Make sure to follow your risk management strategies.

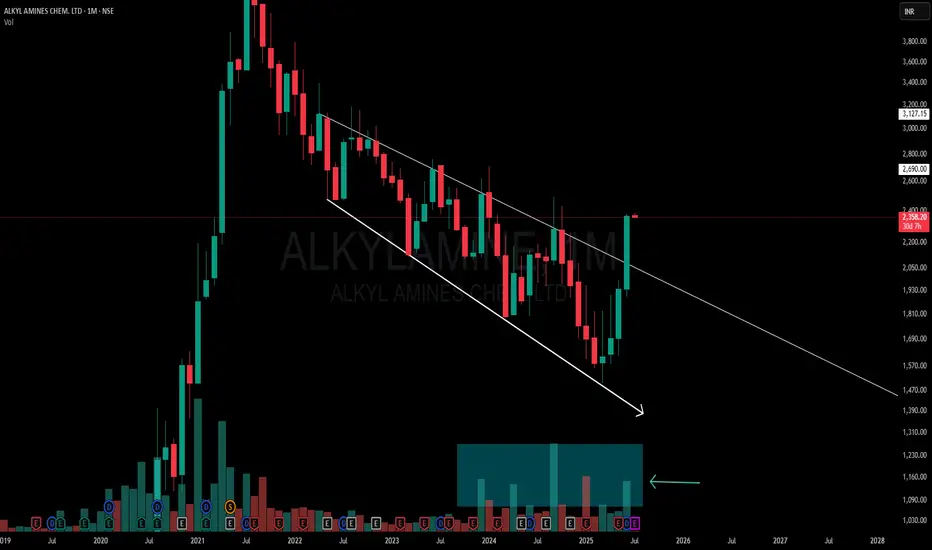
Powerful Monthly Channel | Clean Price Structure Across📉 Description:
-This is a classic example of a broadening falling channel on the Monthly Time Frame (MTF), where the counter-trendline (CT) has just been taken out by a strong bullish candle. Volume confirms the strength
📌What makes this setup particularly interesting:
-MTF structure: Despite a series of lower lows on the monthly, it has respected the broad structure of the falling channel throughout.
-WTF/DTF structure: Weekly and Daily timeframes are making higher lows (HLs),
-Price behavior: Clean reaction to the trendline and no choppiness around breakout — this reflects a well-absorbed selling zone
⚠️ This is not a forecast, not a call or tip — just me charting what I see. Drop any doubts in the comments.
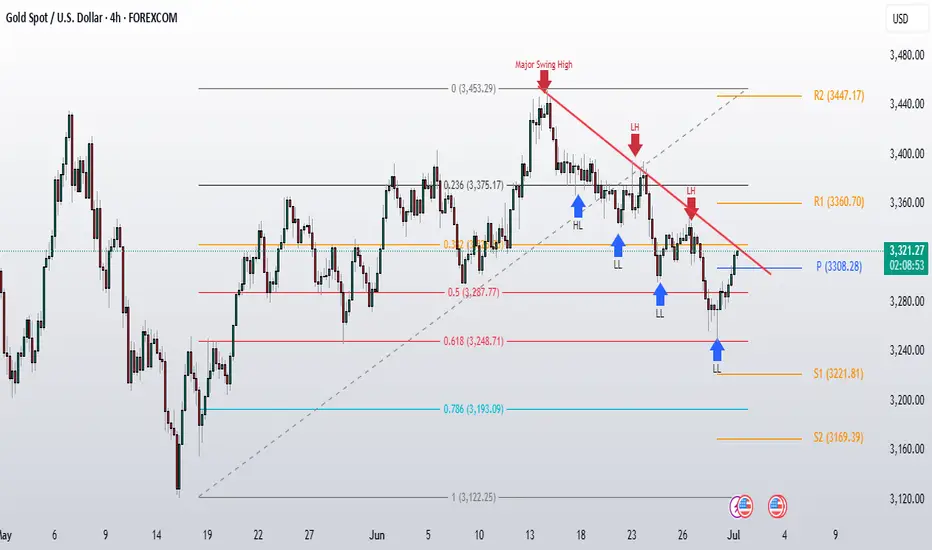
Gold Analysis: Perfect Bounce from 3248 SupportJust as we discussed in yesterday's analysis, gold has delivered an excellent bounce from that Fibonacci golden support zone (3248-3287). The bulls stepped in right where we expected them to, and the reaction has been quite impressive.
Monthly & Quarterly Close Above 3300: Gold managed to close both the month and quarter above that critical 3300 psychological level. These higher timeframe closes carry significant weight and suggest the bulls aren't ready to give up just yet.
Weekly Pivot Reclaimed:Today we're seeing gold trade above the 3308 weekly pivot level . This is exactly what we needed to see for any meaningful recovery attempt.
.All these factors are lining up in the bulls' favor, but there's still one critical piece missing breaking resistance trendline that's been creating the lower high (LH) and lower low (LL) structure.
What We Need to See:
For gold to confirm this isn't just another counter-trend bounce, the bulls need to:
1. Break above that descending trendline resistance
2. Hold the breakout on higher timeframes
3. Create a higher high to break the current bearish structure
We're at a pivotal moment. The bounce from the golden zone was textbook, the monthly/quarterly closes were bullish, and we're back above the weekly pivot. Now it's all about whether the bulls have enough momentum to break through that structural resistance.
If they can claim territory above that trendline and hold it, we could see a strong continuation higher. But if they get rejected here, it might just be another failed attempt in the ongoing correction which can lead to consolidation in big range.
this week will be crucial in determining gold's near-term direction.
BCH Could 10x in the Next Bull Run — But Not YetBCH Could 10x in the Next Bull Run — But Not Yet
Bitcoin Cash is still trading inside a big falling channel.
Every time price hits the lower zone at Bull Flag, it bounces back up — this is the strong Support / Entry Zone.
Right now, BCH is near the upper Trendline Resistance (~$550-$580).
But IMO, we could see one more retracement before the next big bull run. I’m expecting price to revisit the $250–$210 zone before the next leg up.
However, if BCH breaks and holds above $640, that would confirm a bull flag breakout — turning the structure fully bullish with potential long-term targets between $1,800 – $4,000+ by 2026–2027.
Stay alert. The setup is big — but timing is key.
Note: NFA & DYOR

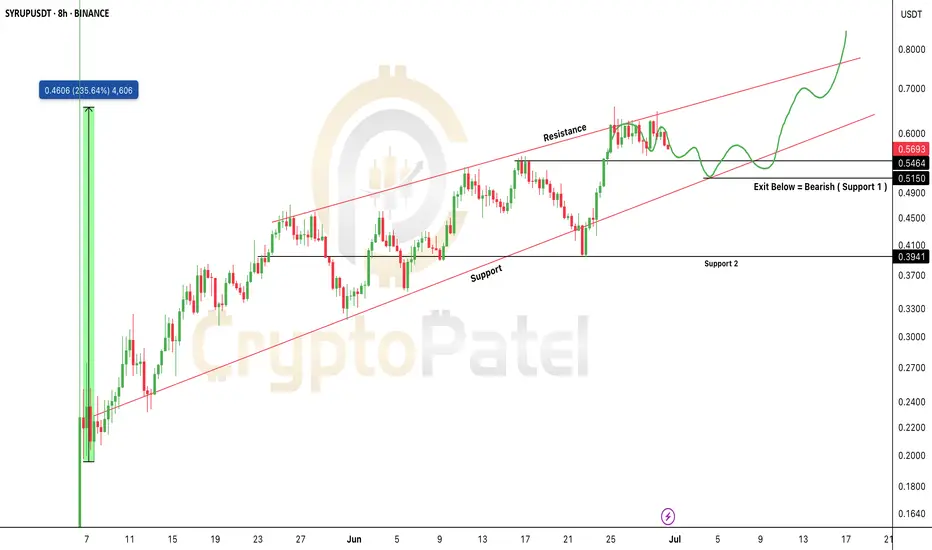
$SYRUP Price Prediction Analysis as per Ascending ChannelSYRUP/USDT – Technical Chart Update (8H Timeframe)
SYRUP is trading inside a clean ascending channel, showing a bullish structure with higher highs and higher lows.
Key Levels to Watch:
Support: $0.51
Resistance Targets: $0.70 → $0.80+
Exit Level: Bearish if price breaks below $0.51
Current Setup:
Price is respecting the lower trendline of the channel. A bounce here could lead to another leg up toward resistance.
Strategy:
Bullish bias as long as SYRUP holds above $0.51
Ideal zone to look for buy opportunities on dips
Exit or hedge if price closes below $0.51
Important Note:
If CRYPTOCAP:SYRUP holds the $0.51 support, it could soon enter the $1 club 🚀
But if it drops below $0.50, we may see a 30–50% retracement.
So always watch the chart closely before entering any trades.
Note: NFA & DYOR
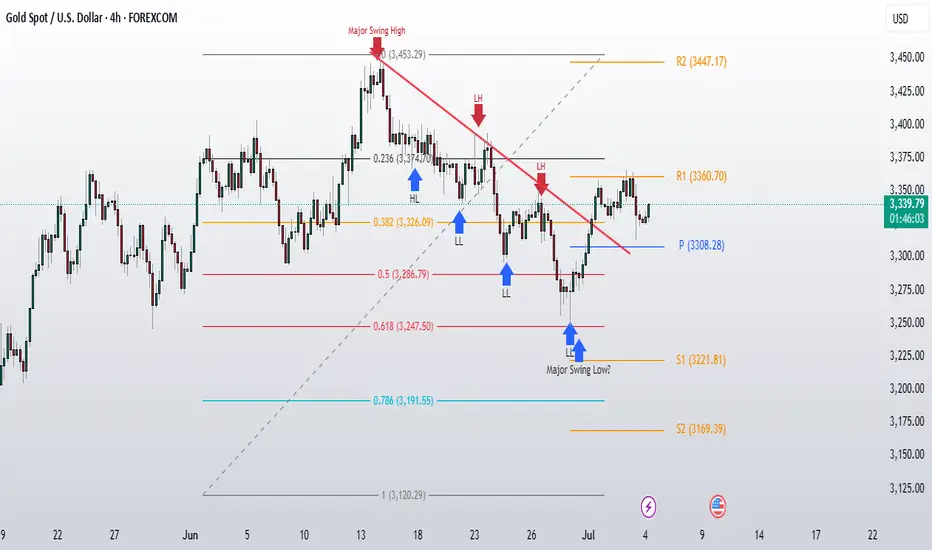
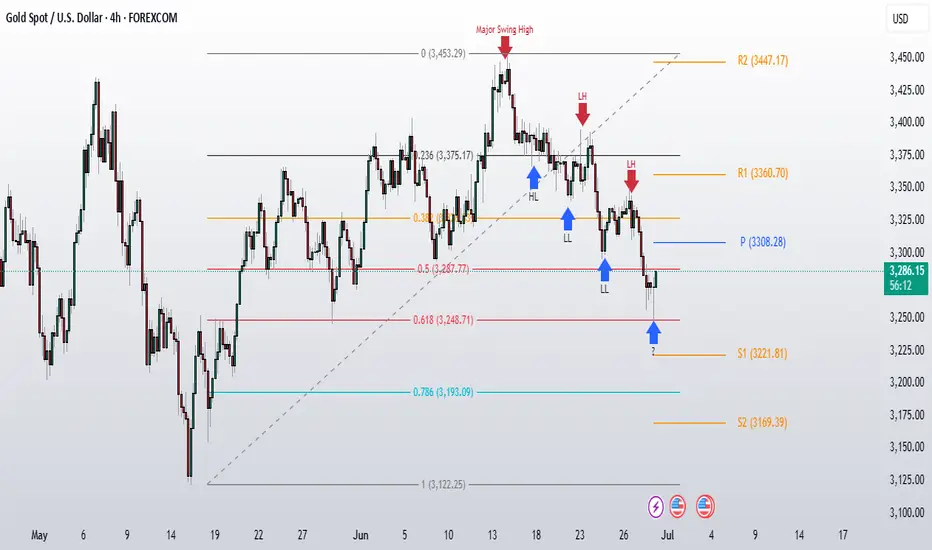
Gold Weekly Analysis: Breaking Down After 3300 Support FailureCurrent Market Structure:
Gold breakdown below critical 3300 support level last Friday, and more importantly, we closed the week below this key psychological level. This breakdown has shifted the technical structure, and we're now seeing a clear pattern of lower highs (LH) and lower lows (LL) developing as gold enters a downside correction phase.
The weekly pivot has dropped to 3308, showing a descending formation compared to last week's pivot at 3386. This descending pivot structure confirms the bearish momentum that's been building.
Level to Watch:
3308 Weekly Pivot - This is our key reversal level for this week. For any meaningful bullish recovery, we need to see:
1. A convincing breakout above 3308 on higher timeframes
2. Price sustaining above this level
3. Breaking the current LH/LL bearish structure
Without these conditions being met, any rallies should be treated as counter-trend bounces rather than genuine reversals.
Support Zones:
Immediate Support: 3248-3287 (Fibonacci Golden Zone)
This is our primary support area to watch. It's a confluence zone that could provide a decent bounce opportunity if we get there.
Deeper Support Levels:
- 3221Weekly S1 support
- 3200 Major psychological level
If the golden zone fails to hold and we see a breakdown there, these lower levels become our next areas of interest.
The bears are in control of the weekly structure right now. Any recovery attempts need to prove themselves by reclaiming 3308 and holding it on higher timeframes. Until then, we're in correction mode with Fibonacci support levels as our key support area.
30/06: WILL WE SEE A RECOVERY ON THE LAST DAY OF THE MONTH? GOLD PLAN – 30/06: WILL WE SEE A RECOVERY ON THE LAST DAY OF THE MONTH? ☄️
✅ Macro Context – Focus on USD Debt and Political Pressure
As June comes to a close, the US faces a major $6 trillion debt maturity from COVID-era borrowings, creating potential stress on USD liquidity and overall market sentiment.
Gold saw a sharp dip to the 32xx range during the Asian session but has bounced back and is currently hovering near last week's closing levels.
While the medium-term outlook remains bearish, short-term signals are showing signs of a potential recovery.
✅ Political Catalyst:
Trump’s Pressure on Fed: Trump is pushing the Federal Reserve to cut interest rates to 1%-2%, saying he won’t appoint anyone unwilling to ease monetary policy.
This has sparked expectations for potential rate cuts, which could provide support for gold prices in the near term.
✅ Technical Outlook – Multi-timeframe Structure
Gold continues its downward correction on higher timeframes. However, short-term candles are indicating recovery momentum, with buying activity near the 327x zone.
Today's Strategy: Focus on short-term BUY setups that align with the recovery wave.
✔️ Key Resistance & Support Levels
🔺 Resistance: 3283 – 3291 – 3301 – 3322
🔻 Support: 3277 – 3271 – 3259 – 3247
🔖 Trade Scenarios
✅ Buy Scalping
🔺 Entry: 3272 – 3274
🔹 SL: 3268
✔️ TP: 3282 → 3288 → 3298
✅ Buy Zone
🔺 Entry: 3249 – 3251
🔹 SL: 3244
✔️ TP: 3265 → 3282 → 3295 → 3310
💠 Sell Scalping
🔺 Entry: 3298 – 3300
🔹 SL: 3304
✔️ TP: 3292 → 3282 → 3270
💠 Sell Zone
🔺 Entry: 3327 – 3329
🔹 SL: 3333
✔️ TP: 3322 → 3310 → 3298 → 3282
⚡️ Final Note
As we near the end of the month, expect possible volatility due to USD flows and institutional rebalancing, which could create further opportunities in the gold market.
