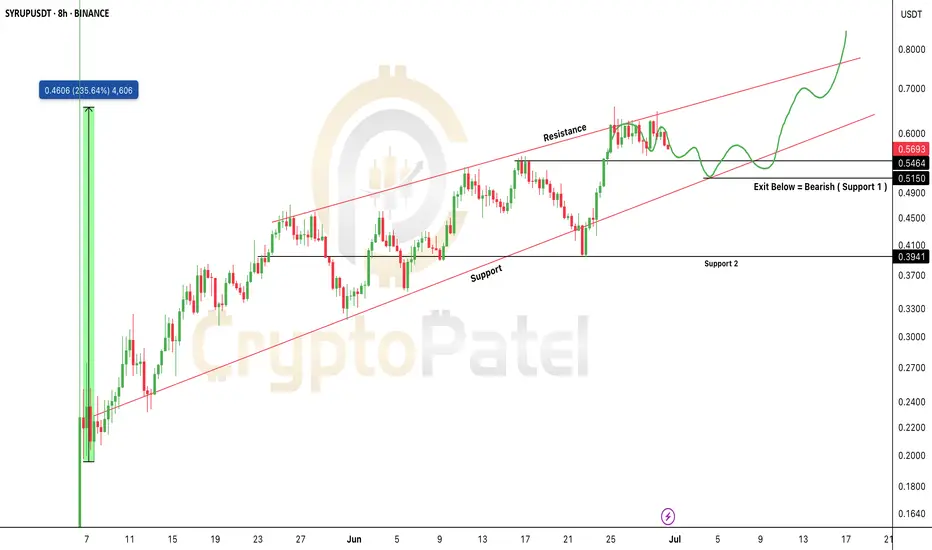
$SYRUP Price Prediction Analysis as per Ascending ChannelSYRUP/USDT – Technical Chart Update (8H Timeframe)
SYRUP is trading inside a clean ascending channel, showing a bullish structure with higher highs and higher lows.
Key Levels to Watch:
Support: $0.51
Resistance Targets: $0.70 → $0.80+
Exit Level: Bearish if price breaks below $0.51
Current Setup:
Price is respecting the lower trendline of the channel. A bounce here could lead to another leg up toward resistance.
Strategy:
Bullish bias as long as SYRUP holds above $0.51
Ideal zone to look for buy opportunities on dips
Exit or hedge if price closes below $0.51
Important Note:
If CRYPTOCAP:SYRUP holds the $0.51 support, it could soon enter the $1 club 🚀
But if it drops below $0.50, we may see a 30–50% retracement.
So always watch the chart closely before entering any trades.
Note: NFA & DYOR
Trading
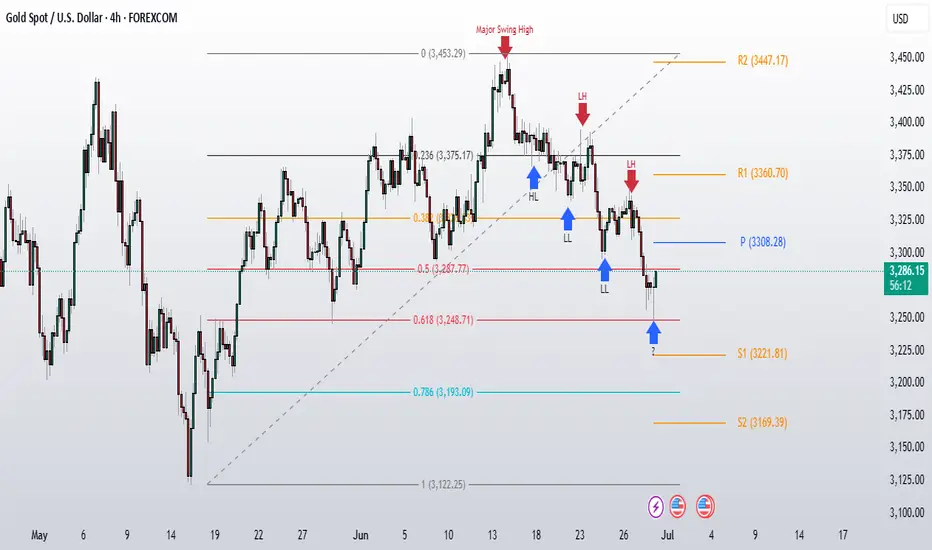
Gold Weekly Analysis: Breaking Down After 3300 Support FailureCurrent Market Structure:
Gold breakdown below critical 3300 support level last Friday, and more importantly, we closed the week below this key psychological level. This breakdown has shifted the technical structure, and we're now seeing a clear pattern of lower highs (LH) and lower lows (LL) developing as gold enters a downside correction phase.
The weekly pivot has dropped to 3308, showing a descending formation compared to last week's pivot at 3386. This descending pivot structure confirms the bearish momentum that's been building.
Level to Watch:
3308 Weekly Pivot - This is our key reversal level for this week. For any meaningful bullish recovery, we need to see:
1. A convincing breakout above 3308 on higher timeframes
2. Price sustaining above this level
3. Breaking the current LH/LL bearish structure
Without these conditions being met, any rallies should be treated as counter-trend bounces rather than genuine reversals.
Support Zones:
Immediate Support: 3248-3287 (Fibonacci Golden Zone)
This is our primary support area to watch. It's a confluence zone that could provide a decent bounce opportunity if we get there.
Deeper Support Levels:
- 3221Weekly S1 support
- 3200 Major psychological level
If the golden zone fails to hold and we see a breakdown there, these lower levels become our next areas of interest.
The bears are in control of the weekly structure right now. Any recovery attempts need to prove themselves by reclaiming 3308 and holding it on higher timeframes. Until then, we're in correction mode with Fibonacci support levels as our key support area.
30/06: WILL WE SEE A RECOVERY ON THE LAST DAY OF THE MONTH? GOLD PLAN – 30/06: WILL WE SEE A RECOVERY ON THE LAST DAY OF THE MONTH? ☄️
✅ Macro Context – Focus on USD Debt and Political Pressure
As June comes to a close, the US faces a major $6 trillion debt maturity from COVID-era borrowings, creating potential stress on USD liquidity and overall market sentiment.
Gold saw a sharp dip to the 32xx range during the Asian session but has bounced back and is currently hovering near last week's closing levels.
While the medium-term outlook remains bearish, short-term signals are showing signs of a potential recovery.
✅ Political Catalyst:
Trump’s Pressure on Fed: Trump is pushing the Federal Reserve to cut interest rates to 1%-2%, saying he won’t appoint anyone unwilling to ease monetary policy.
This has sparked expectations for potential rate cuts, which could provide support for gold prices in the near term.
✅ Technical Outlook – Multi-timeframe Structure
Gold continues its downward correction on higher timeframes. However, short-term candles are indicating recovery momentum, with buying activity near the 327x zone.
Today's Strategy: Focus on short-term BUY setups that align with the recovery wave.
✔️ Key Resistance & Support Levels
🔺 Resistance: 3283 – 3291 – 3301 – 3322
🔻 Support: 3277 – 3271 – 3259 – 3247
🔖 Trade Scenarios
✅ Buy Scalping
🔺 Entry: 3272 – 3274
🔹 SL: 3268
✔️ TP: 3282 → 3288 → 3298
✅ Buy Zone
🔺 Entry: 3249 – 3251
🔹 SL: 3244
✔️ TP: 3265 → 3282 → 3295 → 3310
💠 Sell Scalping
🔺 Entry: 3298 – 3300
🔹 SL: 3304
✔️ TP: 3292 → 3282 → 3270
💠 Sell Zone
🔺 Entry: 3327 – 3329
🔹 SL: 3333
✔️ TP: 3322 → 3310 → 3298 → 3282
⚡️ Final Note
As we near the end of the month, expect possible volatility due to USD flows and institutional rebalancing, which could create further opportunities in the gold market.

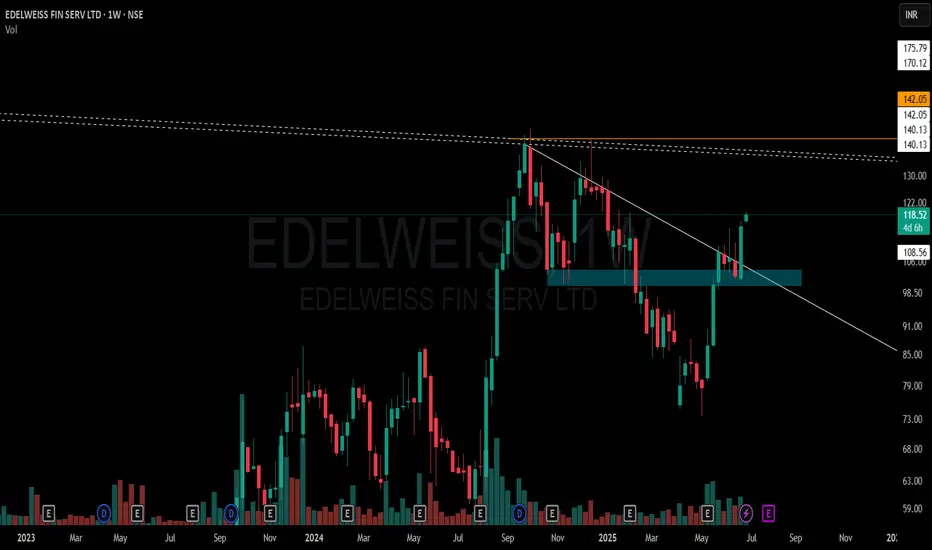
EDELWEISS FIN SERV LTD – Weekly Structure A few key observations on this weekly chart without any forecast bias:
🔹 White Solid Trendline – Marks the active CT (counter-trend) level which has now been decisively taken out.
🔹 Blue Zone – A previously tested supply and demand area has been regained and price is now sustaining above it.
🔹 White Dotted Lines – Multiple short-term weekly hindrances lie just above, acting as micro-resistances.
🔹 Orange Line – Reflects multi-timeframe level confluence and a known volume cluster region to watch ahead.
🔹 Volume has seen a healthy pickup during this breakout, suggesting participation.
📌 Not a recommendation. Just sharing chart structure and price behavior.
HINDCOPPER | Supply-Demand Flip & Structure This chart shows a clean structural shift on the weekly timeframe for Hindustan Copper Ltd (NSE: HINDCOPPER):
🔷 Blue Zone: A key Supply-to-Demand Flip area. Price reacted strongly from this zone after multiple touches, showing its relevance.
📉 CT Line (Compression Trendline): Price was getting compressed under this trendline. It's now visibly breached.
➡️ Arrow Zone: Highlights a smaller supply-demand zone, formed after consolidation and breakout. Marked for structural clarity.
Volume also shows higher activity during this move, indicating strength behind the recent price action.

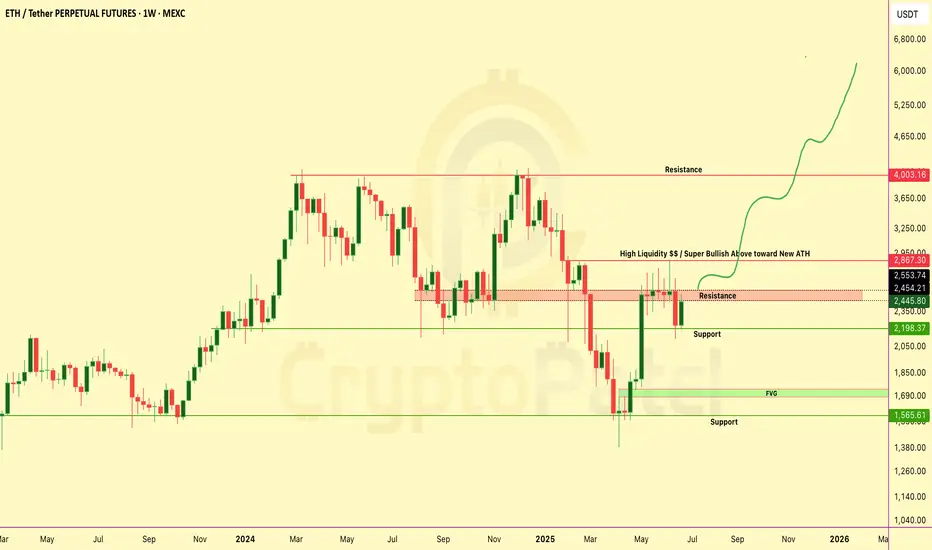
ETHEREUM Weekly Chart Breakdown – Massive Move Loading?ETHEREUM Weekly Chart Breakdown – Massive Move Loading?
ETH just pumped +9.9% this week... but it’s what comes next that really matters 👇
Key Resistance Wall → $2,867
🔹 This zone is packed with liquidity traps and past rejections.
🔹 Break this level = Unlocks ATH push toward $4K–$6K-$10k
Why This Chart Matters:
✅ Bullish structure reclaim
✅ Targeting “High Liquidity” zone above
✅ Possible parabolic rally if breakout confirms
Dips = Opportunities
If ETH dips from here... don’t panic.
→ Every dip = fresh accumulation zone
→ Below $2,000 = golden buy zone for long-term bulls
Liquidity Zone Break it = ATH rally incoming
Reject it = Buy the dip and ride the next wave
Comment & tag a friend who needs this alpha!
NFA & Dyor
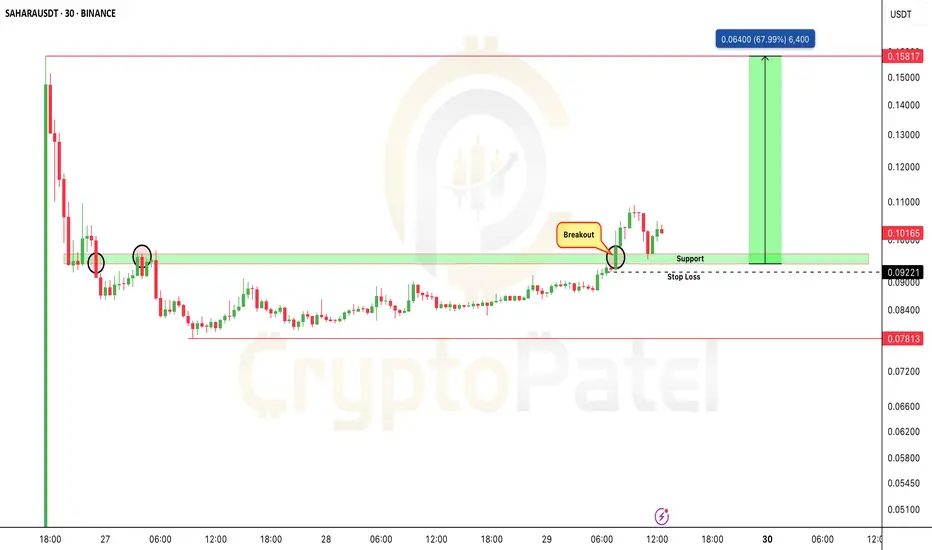
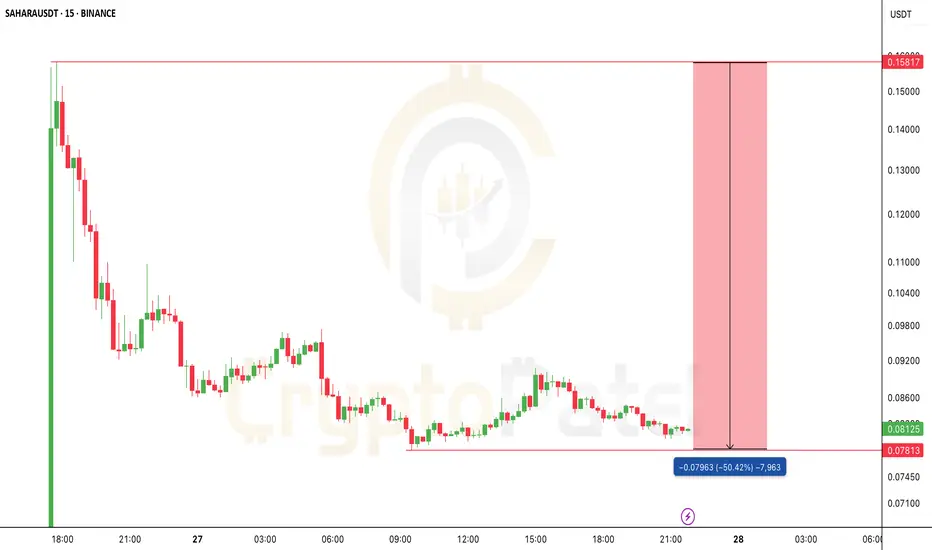
$SAHARA is at a critical level BSE:SAHARA is at a critical level
If the $0.09 support holds, a 60% upside is on the table.
But if it fails to hold $0.095… We could be looking at new lows.
This support zone decides the next big move.
Keep it on your radar
Retweet if you're watching
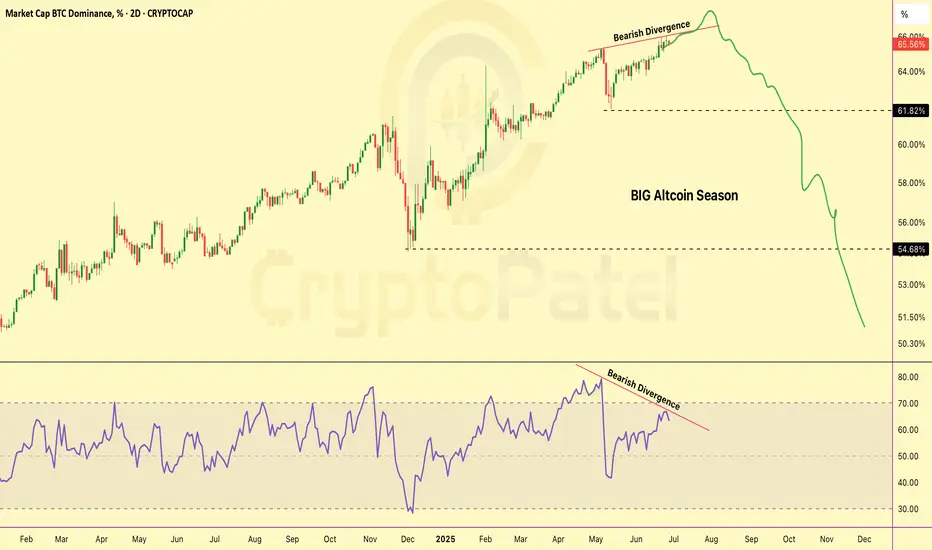
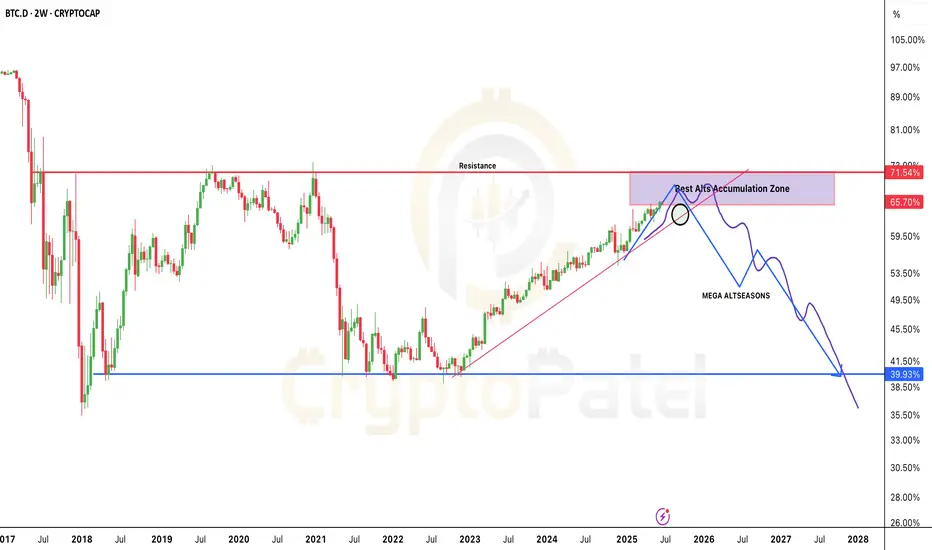
Big Altseason Is Loading... Ready for Big Altseason... but Why?BTC Dominance Showing Bearish Divergence!
Get ready... a massive Altcoin Season could be coming soon!
📉 Chart and RSI both showing weakness
📉 If dominance drops from here, money will likely flow into altcoins
📉 Next target: 50% dominance — same level where ALTs pumped 5x–10x last time!
This could be the biggest altseason of the cycle.
Don’t miss the opportunity!
Comment your top 3 altcoin picks 👇
Stay tuned for updates — we’ll post the best setups!
NFA & DYOR
How I Read Price Action Like a Pro (Most Miss This Step)The REAL Way to Read Price Action — No Indicators, Just Logic
I make educational content videos for swing trading .

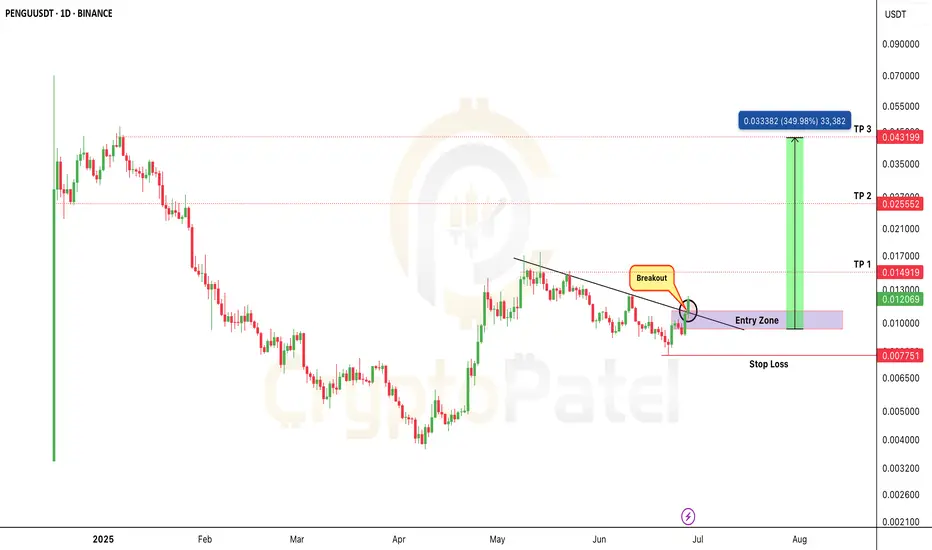
PENGU Breakout Live — Could This Be the Next 5x Runner?PENGU Breakout Live — Could This Be the Next 5x Runner?
PENGU/USDT just broke a major trendline after weeks of consolidation…
If this breakout holds — we’re staring at a potential 3x–5x move in the coming days.
But here’s the twist…
❌ Don't FOMO!
The smart entry is likely $0.010–$0.0090 — a clean retest zone where risk–reward is best.
Chart invalid if price breaks below: $0.0077
Targets if breakout holds: $0.0150 / $0.025 / $0.043 / $0.10
This is a breakout + retest setup with explosive potential — but only if you play it right.
Always use risk management.
This is NOT financial advice — DYOR before you enter any trade.
Gold at Crucial 325x Support – What's Next for the Yellow Metal?XAUUSD D1 Forecast: Gold at Crucial 325x Support – What's Next for the Yellow Metal?
Namaste, fellow traders!
Today, let's zoom out and look at the bigger picture for Gold (XAUUSD) on the Daily (D1) timeframe. Our analysis indicates that Gold has hit a very strong, hard support level around the 325x region. This is a pivotal point that could dictate Gold's medium to long-term direction!
🌍 Macroeconomic Context: The Forces at Play for Gold
While we've seen some USD weakness due to speculations surrounding the Fed (like the rumors about replacing Powell) and expectations of rate cuts, these factors haven't completely prevented Gold's recent decline on the daily chart. Also, the sustained ceasefire between Israel and Iran is reducing Gold's safe-haven appeal.
However, the current price action at the robust 325x support level is a significant technical signal. The influence of upcoming US macroeconomic data (especially the PCE Index on Friday) and speeches from FOMC members will be crucial in confirming or negating Gold's next moves. If positive news for Gold aligns with this support holding, it could act as a strong catalyst.
📊 XAUUSD Technical Analysis (D1): Predicting Gold's Next Move
Based on the fact that Gold has encountered strong support at 325x, we can anticipate the following scenarios:
Bounce from 325x (Potential Upside Phase):
If the 325x area (which reinforces the 3264.400 support from image_e9d325.png) holds firm, we expect a strong reaction and an upward move for Gold.
The initial target for this bounce would be the 332x region, which aligns with resistance levels 3313.737 - 3330.483 from our previous analysis. On a broader timeframe (as shown in image_83845c.png), this corresponds to the resistance zone around 3326.022. This 332x area could represent a continuation pattern, meaning it might be a corrective rise before the resumption of the larger trend.
Resumption of Downtrend (After Reaching 332x):
Once Gold reaches and tests the 332x zone (3313.737 - 3330.483 / 3326.022) and shows bearish confirmation signals (e.g., a strong bearish engulfing candle, a pin bar, or a clear top formation), we anticipate a resumption of the downward movement.
The next major target for this fall would be the 317x area, which correlates well with the strong support at 3173.052 on the larger timeframe (as depicted in image_83845c.png).
🎯 XAUUSD D1 Trading Plan: Your Long-Term Strategy Ahead!
Considering the current D1 analysis, here's our actionable plan:
1. BUY PHASE (Bounce from Support):
Entry: Observe price reaction in the 325x - 326x zone (especially 3264.400). Only buy if there are clear bullish confirmations (e.g., a confirmed bullish pattern on the daily or 4-hour candle, a strong bounce from the zone with volume).
SL: Just below the 325x support zone (e.g., 3245-3240, depending on confirmation).
TP: 3280 - 3290 - 3300 - 3313.737 - 3326.022 (key 332x zone). This will be our primary target for the bounce.
2. SELL PHASE (Downtrend Resumption):
Entry: After the price reaches the 332x zone (3313.737 - 3330.483 / 3326.022) and shows bearish confirmation signals (e.g., strong bearish engulfing, pin bar, or top formation).
SL: Slightly above the 332x zone (e.g., 3335-3340).
TP: 3300 - 3290 - 3280 - 3270 - 3260 - 3250 - 3200 - 3173.052 (final 317x target).

New traders, read this before chasing the next listing pumpNew traders, read this before chasing the next listing pump:
BSE:SAHARA dropped 50% right after launch — but early investors still sit on 10x+ gains from seed.
Why? They got in at
Seed: $0.005
IDO: $0.06
Binance top buyers? Wrecked.
✅ Always study tokenomics
✅ Know seed + public round prices
✅ Let the hype settle before entries
Smart money waits. FOMO gets dumped on.
What’s your rule before buying a new listing?
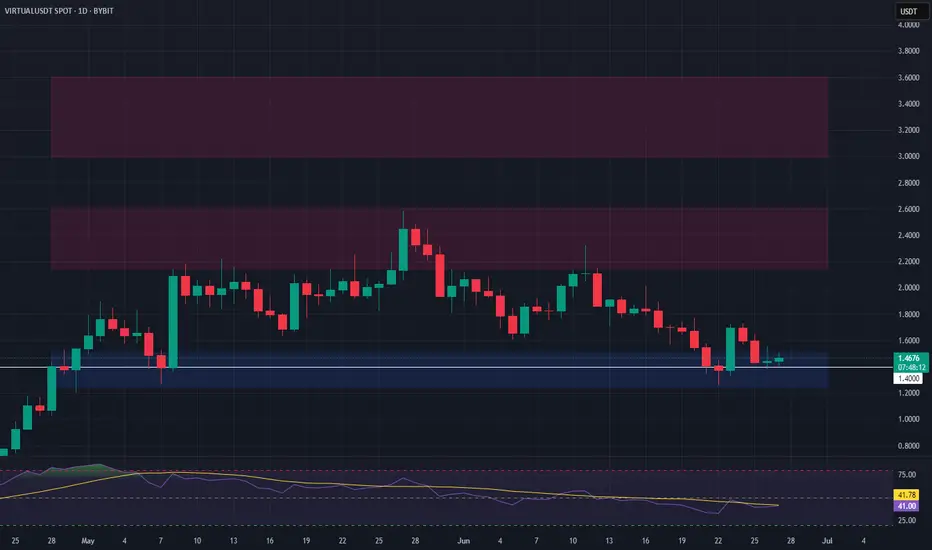
VIRTUAL Long Setup – Watching Key Support with BTC CorrelationVIRTUAL is approaching a major support zone, with a potential long spot entry dependent on Bitcoin stability. We’ll be looking to enter around the $1.50 level, provided it holds as support.
📌 Trade Setup:
• Entry Zone: Conditional on $1.50 holding as support
• Take Profit Targets:
o 🥇 $2.15 – $2.60
o 🥈 $3.00 – $3.60
• Stop Loss: Tight stop, daily close below $1.40
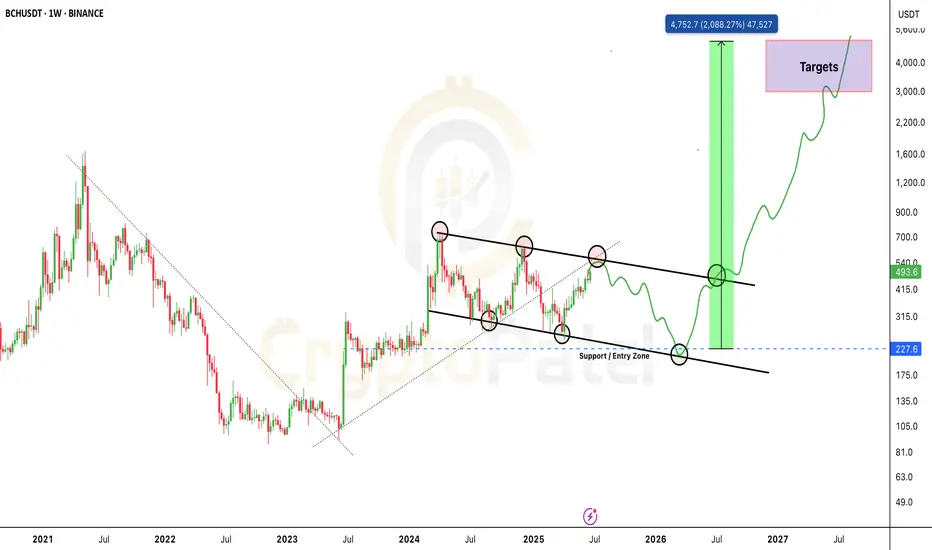
BCH/USDT — The Final Dip Before a 10x Move?Weekly Chart Analysis | Long-Term Setup
BCH is forming a powerful macro structure that could lead to a massive breakout.
🔹 Descending Channel Structure
The price has been respecting a clean descending channel since 2023.
Each rejection from the upper trendline has led to a higher low — showing clear accumulation.
🔹 Key Entry Zone: $220–$230
This zone has acted as major support multiple times.
If BCH revisits this level and holds again, it could trigger a major trend reversal.
🔹 Breakout Targets: $3,000–$5,000
If the breakout occurs as projected, BCH could rally into this zone in the coming bull cycle.
This would be a potential 10x+ opportunity from the bottom range.
Final Thoughts:
📌 This is not a short-term play.
📌 It’s a macro setup for serious investors and position traders.
📌 The structure mirrors historical accumulation zones seen before massive moves.
💬 What’s your take on BCH long-term?
Comment below and share your chart if you’re tracking it too 👇
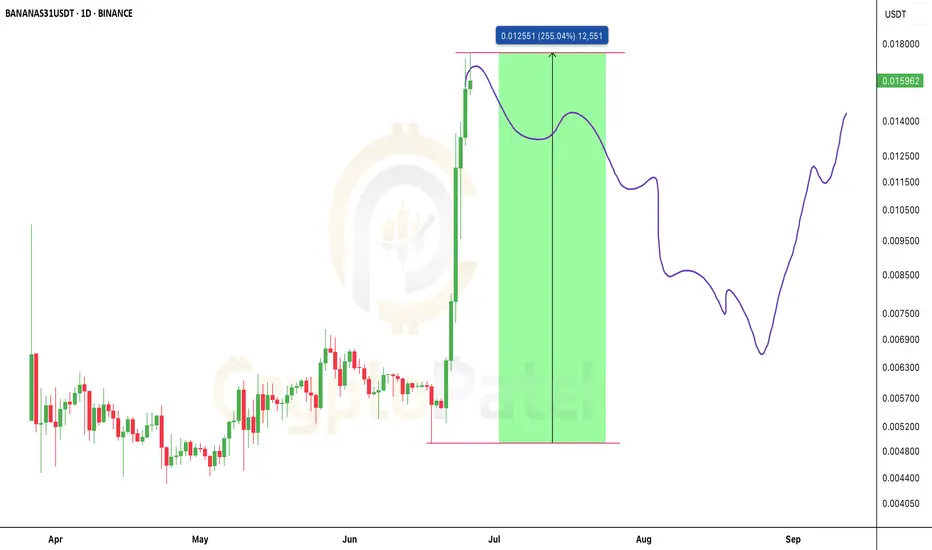
$BANANAS31 Dumped 58% — Hope You Took Profits, Not Pain.$BANANAS31 Dumped 58% — Hope You Took Profits, Not Pain.
It just dumped 58% within hours. Brutal.
Yesterday: $0.016–$0.018
Now: $0.0071 and still sliding…
Hope you enjoyed huge profit with $BANANAS31 short trade —
and not by buying the top.
This is why I always say:
Never chase green candles.
Don’t be exit liquidity.
Learn the game or pay the price. What’s your biggest FOMO trade?👇

XAUUSD: Gold's Golden Glow Fades Below $3350 XAUUSD: Gold's Golden Glow Fades Below $3350 – Navigating Key Levels Amidst USD Weakness!
Let's dive into the fascinating world of Gold (XAUUSD) today. The yellow metal is showing subtle positive movement, primarily influenced by a weaker US Dollar, but a convincing bullish breakout above the $3350 mark remains elusive.
🌍 Macroeconomic Snapshot: USD's Woes & Gold's Mild Support
Gold has seen a slight positive bias for the second consecutive day, yet it's struggling to find significant follow-through, staying below the $3350 level in early European trading.
USD Under Pressure: Reports indicating that US President Donald Trump is considering replacing Fed Governor Jerome Powell have sparked concerns regarding the future independence of the US central bank.
Cautious Outlook: This mixed bag of news calls for caution before confirming a definitive bottom for Gold or positioning for a substantial recovery from levels below $3300 (or Tuesday's two-week low). Traders are currently focused on upcoming US macroeconomic data and speeches from FOMC members, which could influence XAU/USD ahead of Friday's crucial US Personal Consumption Expenditures (PCE) Price Index release.
📊 XAUUSD Technical Analysis & Intraday Trading Plan:
Current Trend: Gold has recently experienced a sharp decline and is now in a consolidation phase, trading around the $329X mark. Price is currently below shorter-term moving averages, indicating lingering bearish pressure or an accumulation phase.
Key Levels Identified:
Strong Support Zones (Potential BUY Areas): Levels around 3294.414, 3276.122, and particularly 3264.400 are crucial demand areas.
Key Resistance Zones (Potential SELL Areas): Levels at 3313.737, 3321.466, 3330.483, and 3341.947 are identified as significant supply zones.
🎯 XAUUSD Trading Plan (Based on your specified levels):
BUY ZONE (Strong Support - Long-Term Bias):
Entry: 3266 - 3264
SL: 3270
TP: 3280 - 3284 - 3290 - 3295 - 3300 - 3305 - 3310 - 3320
BUY SCALP (Quick Buy at Intermediate Support):
Entry: 3284 - 3282
SL: 3278
TP: 3288 - 3292 - 3296 - 3300 - 3305 - 3310 - 3320 - 3330
SELL ZONE (Key Resistance):
Entry: 3331 - 3333
SL: 3337
TP: 3326 - 3320 - 3316 - 3310 - 3305 - 3300
SELL SCALP (Quick Sell at Near Resistance):
Entry: 3313 - 3315
SL: 3320
TP: 3310 - 3305 - 3300 - 3295 - 3290 - 3280
⚠️ Key Factors to Monitor Closely:
US Macro Data: The upcoming US Personal Consumption Expenditures (PCE) Price Index on Friday is critical.
FOMC Member Speeches: Any comments on monetary policy or inflation outlook will directly impact USD and Gold.
Geopolitical Stability: Developments regarding the Israel-Iran ceasefire can influence safe-haven demand.

Did you FOMO into $BANANAS31USDT after the 250% pump?Did you FOMO into BINANCE:BANANAS31USDT after the 250% pump? You might want to hit pause… 🛑
$BANANAS31 pumped 250% in just 10 days, including a vertical spike. But the chart now looks top-heavy — consolidation is weakening, and momentum is fading.
I'm expecting a 30–50% retracement if support breaks. Fresh entries here? Extremely risky. High-risk traders may eye shorts — but it's a dangerous game.
Are you riding it or fading it from here? Comment your strategy 👇
NFA & DYOR
Gold's Price Action Amidst Fed's Inflationary Warnings XAUUSD: Gold's Price Action Amidst Fed's Inflationary Warnings – Key Levels to Watch!
Hello TradingView Community!
Gold (XAUUSD) continues to be a focal point amidst the Federal Reserve's (Fed) cautious stance on inflation and interest rates. Recent statements from Fed Chair Jerome Powell highlight concerns that large-scale tariffs could trigger persistent inflation, moving beyond conventional economic models. Despite recent inflation cooling, Powell emphasized the need for more data from June and July before considering any rate cuts, warning of the risk that "price shocks turn into persistent inflation".
This creates a nuanced market sentiment, torn between hopes for rate cuts and the emerging inflation risk from tariffs. In this environment, Gold remains a crucial psychological anchor, especially if the Fed delays its reaction to new inflationary pressures.
📊 XAUUSD Technical Outlook (H4/M30 Chart Analysis):
Based on our recent chart analysis (e.g., image_008403.png): Gold is currently in a corrective or consolidating phase after a notable pullback. Price action indicates that key support and resistance levels are being tested.
Resistance Levels (Potential Sell Zones): We see significant resistance around 3352.383 - 3353.860 and higher up at 3371.205, with a major resistance area near the top at 3391.750 - 3395.000.
Support Levels (Potential Buy Zones): Key support is identified around 3317.738 - 3311.214, with a stronger demand zone at 3302.939 - 3302.857. A critical lower support lies at 3286.257.
🎯 XAUUSD Intraday Trading Plan:
Here are the key zones and targets for today, based on current market dynamics:
BUY SCALP:
Entry: 3316 - 3314
SL: 3310
TP: 3320 - 3324 - 3328 - 3332 - 3336 - 3340
BUY ZONE:
Entry: 3304 - 3302
SL: 3298
TP: 3308 - 3312 - 3316 - 3320 - 3330 - 3340 - 3350
SELL SCALP:
Entry: 3353 - 3355
SL: 3360
TP: 3350 - 3345 - 3340 - 3335 - 3330
SELL ZONE:
Entry: 3390 - 3392
SL: 3396
TP: 3386 - 3382 - 3378 - 3374 - 3370 - 3360
⚠️ Key Factors to Monitor:
Fed Speeches: Any further comments from Fed officials on inflation or policy outlook.
US Economic Data: Upcoming inflation (CPI, PCE) and employment reports (NFP) will heavily influence Fed policy expectations.
Geopolitical Developments: Ongoing global tensions can always boost Gold's safe-haven appeal.

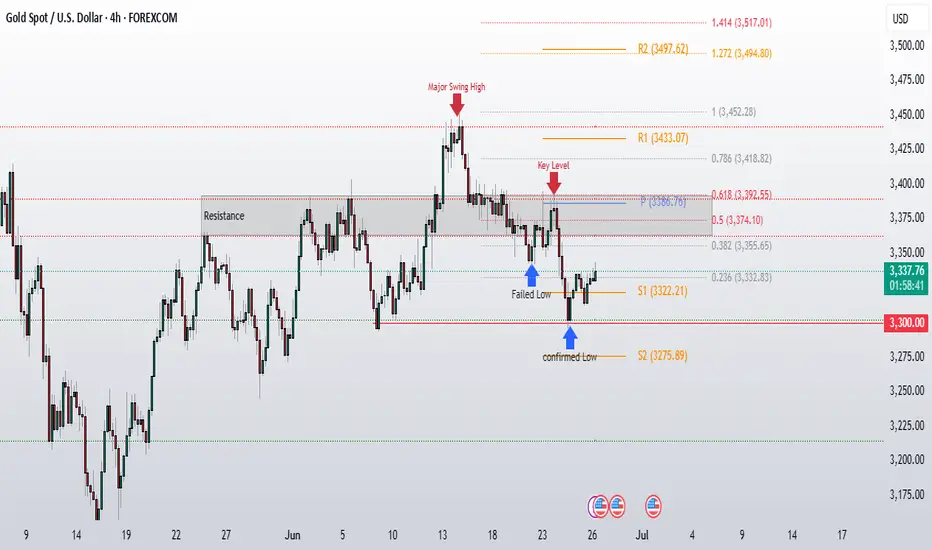
Gold Technical Update: Is Tuesday's Low the Bottom ?It looks like we printed our low on Tuesday (June 24th), and now gold is showing some signs of reversal with the current bounce. The key question is whether this momentum can sustain itself through some critical resistance zones.
Key Resistance Levels to Watch:
3350-55 - This is our first major test. this level is the confluence with the 0.38 Fibonacci retracement level. If we see a clean break here with volume, it sets up the next target.
3380-85 - This is the big one for today and this week. this level also aligns with the weekly pivot. If the bulls can claim this territory and hold it into the close, we're likely looking at a continuation higher toward upper levels around 3400+.
Support Levels:
The PDL is now acting as our immediate support level. Below that, we've still got that psychological 3300 level as major support ,the same area that provided the floor earlier this week.
Ready for Big Altcoin season and Why?BREAKING: CRYPTOCAP:BTC Dominance is about to DUMP hard!
And that means one thing…
👉 A MASSIVE #Altseason is coming.
We’ve all been bleeding, waiting, questioning.
But this dip right now? It’s your golden ticket.
📉 Dominance is topping between 65%–72%
📈 Next stop? 40% — and altcoins will fly.
This is your chance to accumulate 10x–20x gems before the real move begins.
You may not see these prices again.
This is the final test of patience.
Survive now, thrive later.
Are you ready or still sleeping on alts?
Retweet if you're stacking.
NFA & DYOR
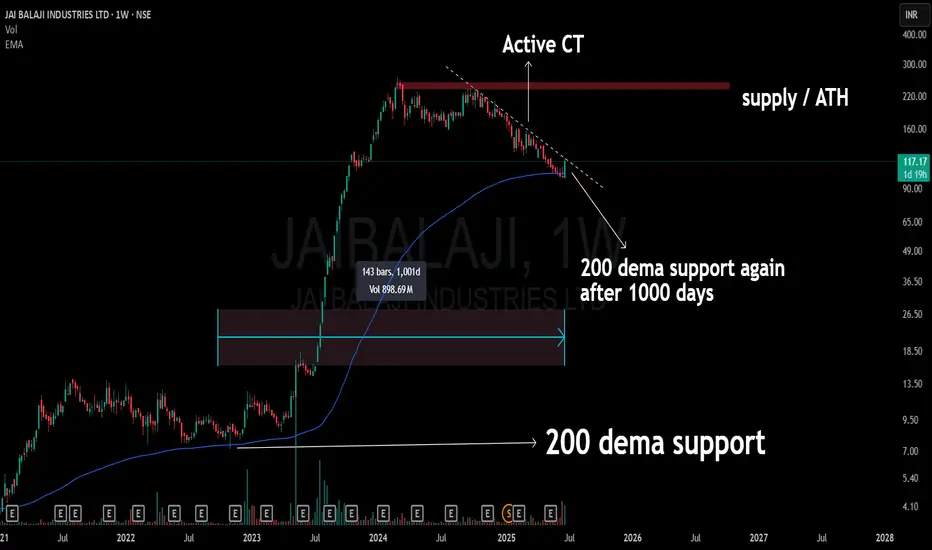
200 Dema Touched After 1000 Days !! 🔵 Stock: JAI BALAJI (Weekly)
🔥 Support Revisit: Back to the 200 DEMA after 1000 days
A level that once acted as the launchpad.
Current structure shows an active compression trend (CT) right into this long-term dynamic support.
The chart also aligns below a major supply zone / ATH band, keeping the broader context in check.
📉 No prediction. No call. Just structure, levels, and time-tested zones doing the talking.
Learn Institutional Trading Pros and Cons
Pros: Early signals, useful for reversals.
Cons: Requires confirmation, may produce false signals.
Technical Trading
What is Technical Trading?
Technical trading focuses on using historical price data, volume, and technical indicators to predict future price movements. Traders use charts and patterns instead of company fundamentals.
Key Tools in Technical Trading
Price Charts: Candlestick, line, bar charts.
Indicators: Moving averages, RSI, MACD, Bollinger Bands.
Chart Patterns: Head and Shoulders, Triangles, Double Tops, Flags.
Support and Resistance Levels: Key price points where stocks reverse.

Ready for a Fresh Rally Ahead of July FOMC Buzz?XAUUSD: Powell's "Soft Tone" Ignites Gold – Ready for a Fresh Rally Ahead of July FOMC Buzz?
🌍 Macro Landscape: Gold Reacts to Fed's Cues – Easing Rate Pressures?
The gold market (XAUUSD) is witnessing a resurgence of positive momentum, driven by recent "dovish-leaning" signals from Federal Reserve Chair Jerome Powell during his congressional testimony. Powell's acknowledgment of lower-than-expected inflation from tariffs, coupled with hints of a potential earlier interest rate cut (possibly as early as July), is creating a fresh wave of market anticipation.
While Powell cautiously noted "no need to rush," market participants are interpreting his remarks as an indication that current monetary policy might be "somewhat restrictive." Should inflation continue its sustainable deceleration, the Fed would be poised to ease policy sooner. This directly impacts gold: as rate cut expectations rise, the opportunity cost of holding gold (a non-yielding asset) diminishes, making it significantly more appealing to investors.
🏦 Central Bank Policy: Fed's Evolving Stance & Market Re-calibration
Federal Reserve (Fed): Chair Powell's nuanced message suggests a more adaptable Fed, ready to align its policy with actual inflation data. His emphasis on the Fed's independence from political influence further solidifies confidence in data-driven decisions.
Market Re-calibration: While the broader market still leans towards a September rate cut, the probability of a July cut is subtly increasing, according to the CME FedWatch Tool (with 70.1% anticipating a cut to 4.00 - 4.25% by September). This re-pricing of policy risk is a crucial supportive factor, helping gold maintain stability around the $3,300–$3,320/oz mark, indicating smart money accumulation.
This evolving Fed perspective, even a slight shift, is powerful enough to influence capital flows and investor sentiment globally, setting the stage for significant gold movements.
🌐 Capital Flows: Gold & USD – The Shifting Safe-Haven Dynamics
Global capital flows are highly sensitive to interest rate expectations and perceived risks. Historically, both gold and the U.S. dollar serve as primary safe havens during periods of uncertainty.
If Powell's "dovish tilt" gains further traction and leads to earlier rate cuts, we could anticipate a notable rotation in capital:
Outflows from USD: Lower U.S. yields would diminish the attractiveness of the USD as a yielding asset.
Inflows into Gold: The reduced opportunity cost of holding gold, combined with its intrinsic store-of-value appeal, could trigger substantial capital flows into the precious metal, especially amidst persistent global geopolitical tensions.
The market's re-evaluation of Fed policy risk is already contributing to gold's resilience, suggesting that strategic positioning for an upside move might be underway.
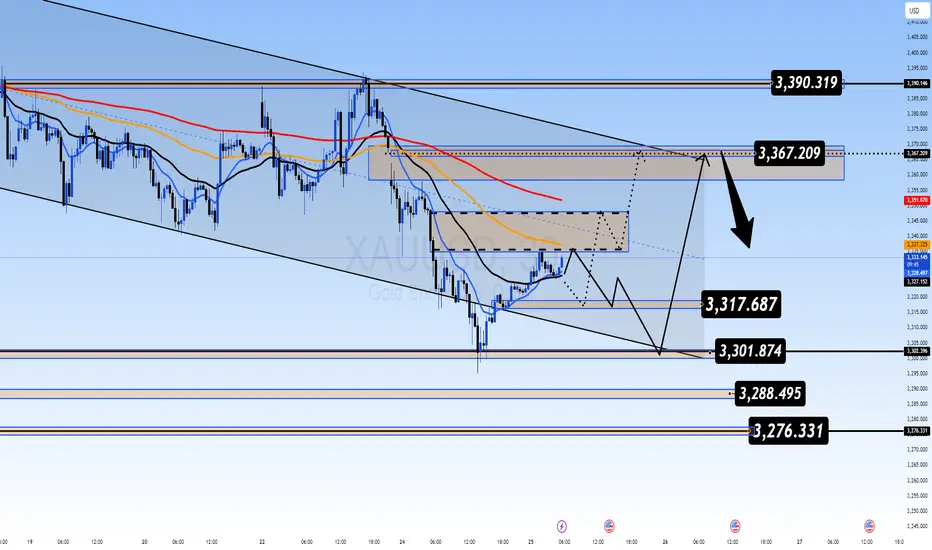
📊 Technical Structure (H4/M30 Chart Analysis): Gold Breaking Bearish Bias, Targeting Higher Levels
Based on the provided XAUUSD chart (H4/M30 timeframe):
Channel Breakout: Gold has visibly broken out of a prior descending channel, signaling a clear weakening of selling pressure and a potential trend reversal. The price is currently consolidating and appears to be forming a new accumulation pattern or a smaller ascending channel.
Key Price Levels:
Potential Sell Zone (Resistance): Around 3,352.383 - 3,371.205. This zone aligns with significant Fibonacci retracement levels (0.5 and 0.618 from the last major swing down) and represents a strong historical resistance cluster. If the price attempts to breach this zone and fails, selling pressure could emerge.
Higher Resistance: 3,391.750 - 3,395.000. This is a formidable resistance area. A decisive break above this level would confirm a more robust long-term bullish trend.
Current Buy Zone (Support): Around 3,302.939 - 3,311.214. This is a critical demand zone, where strong buying interest is likely to surface, coinciding with recent swing lows.
Next Key Support: 3,286.257. Should the 3,302.939 - 3,311.214 zone be breached, this level would be the next significant support to watch.
Moving Averages (EMA 13-34-89-200):
The price is currently trading above the shorter-term EMAs (13 & 34), indicating positive short-term momentum.
The longer-term EMAs (89 & 200) are likely transitioning from resistance to dynamic support, or showing signs of convergence, suggesting a potential shift in market structure. A 'Golden Cross' formation among these EMAs would be a powerful bullish signal.
Projected Price Action: The chart depicts a scenario where the price might retrace slightly towards the 3,317.738 support or even deeper to 3,302.939 before embarking on a strong upward rally, targeting resistance zones like 3,352.383 and further to 3,371.205.
🎯 Trade Strategy Recommendations (Based on Provided Zones):
BUY ZONE: 3286 - 3284
SL: 3280
TP: 3290 - 3294 - 3298 - 3302 - 3306 - 3310 - 3315 - 3320
BUY SCALP: 3302 - 3300
SL: 3295
TP: 3306 - 3310 - 3314 - 3318 - 3322 - 3326 - 3330
SELL ZONE: 3353 - 3355
SL: 3360
TP: 3350 - 3346 - 3340 - 3335 - 3330 - 3320
SELL ZONE: 3372 - 3374
SL: 3378
TP: 3370 - 3366 - 3362 - 3358 - 3354 - 3350
⚠️ Key Events to Watch:
Further Speeches by Fed Officials: Any new comments on inflation, economic data, or the rate path will heavily influence market dynamics.
Global Geopolitical Developments: Ongoing tensions or new uncertainties can always bolster gold's safe-haven appeal.