#Ethereum Breakout Attempt #Ethereum Breakout Attempt 📢
After weeks of consolidation inside this range → CRYPTOCAP:ETH is now testing a breakout above major resistance $2750
👉 If this breakout holds → we could see a BIG upward rally toward $3500–$4000 in the coming weeks. 🚀
Keep an eye on this level — the next move could be massive.
Trading

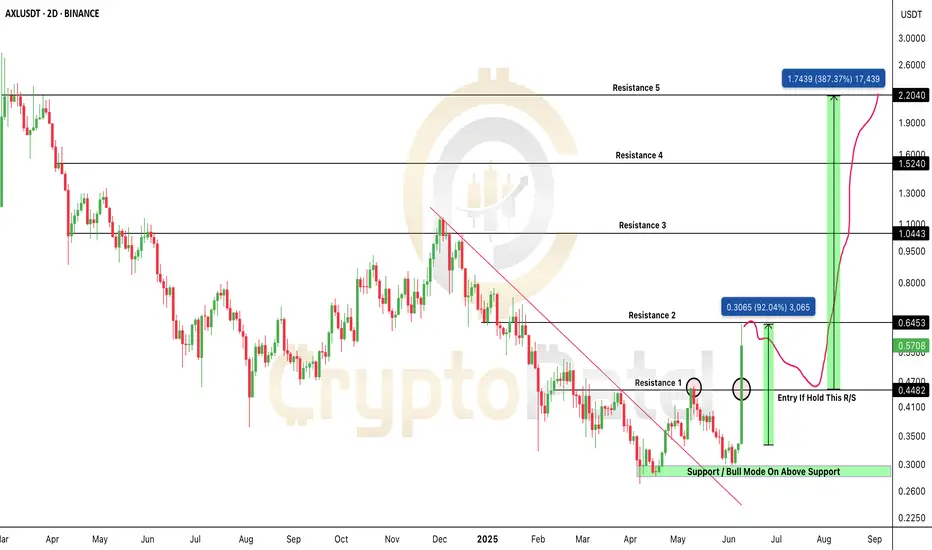
$AXL/USDT — Massive 90% Breakout, But Is It Time To Buy?$AXL/USDT — Massive 90% Breakout, But Is It Time To Buy?
NYSE:AXL has exploded +90% in just 2 days, breaking out of a long-term downtrend with huge volume.
The chart looks fire — but traders, beware:
High volatility = high risk at these levels.
Here’s the technical read:
✅ Downtrend broken
✅ $0.4482 resistance flipped → acting as strong support
✅ Structure is bullish — but a healthy correction is expected
My current view:
→ I do NOT suggest entering at this level.
→ If already holding → now is a good time to book partial profits.
👉 I expect a ~30% pullback from here.
👉 A 2-day close above $0.4482 will confirm strength and create a good accumulation zone.
👉 If not → deeper pullback toward $0.44–$0.34 zone likely.
Best Accumulation Zone:
$0.44–$0.34 — patience required — don’t chase tops.
Targets after correction: $1 → $2 → $3 → $5
Stop Loss: below $0.31
Bottom line:
The trend shift is real — but after a parabolic +90% move, entering now is chasing risk.
NFA & DYOR
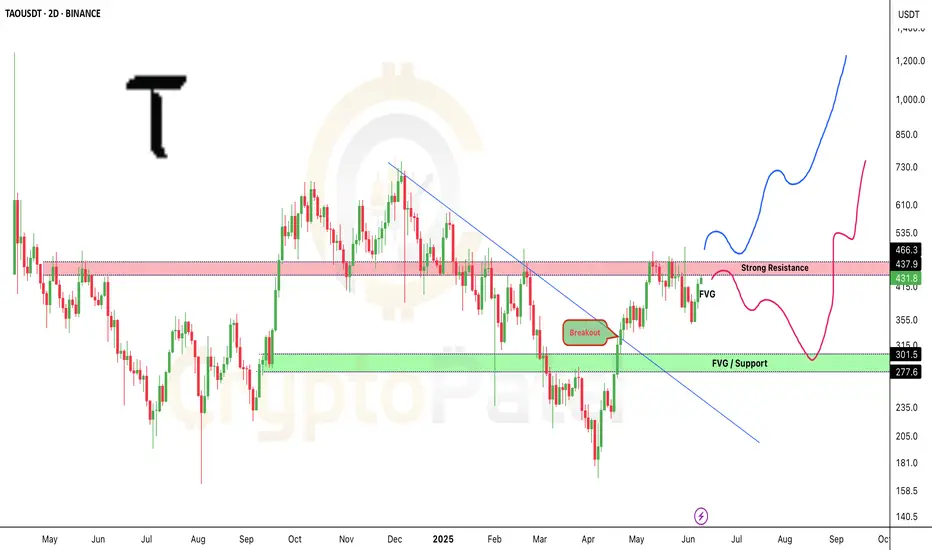
$TAO at a Critical Make-or-Break Zone!LSE:TAO at a Critical Make-or-Break Zone!
LSE:TAO just delivered a clean trendline breakout, with price now approaching a major decision area:
🔹 Currently testing the FVG zone
🔹 Strong Resistance overhead is the next key level to watch
Scenarios:
✅ A breakout & hold above resistance → Targets open toward $730–$1,200+
❌ A rejection → Potential retest of the $301–$277 support zone (FVG)
I’m personally watching this setup VERY closely — high volatility expected ahead. Are you prepared for the next move?
Note: NFA & DYOR
GOLD IN SIDEWAY PHASE, WAITING FOR A BREAKOUT THROUGH KEY LEVELSXAU/USD TRADING PLAN 10/06/2025 – GOLD IN SIDEWAY PHASE, WAITING FOR A BREAKOUT THROUGH KEY LEVELS!
🌍 MACRO CONTEXT – FUNDAMENTAL ANALYSIS
Geopolitical tensions and monetary policy: The market is currently in a wait-and-see phase, with major decisions pending from important meetings, especially statements from the Federal Reserve (Fed) and global conflict situations. These factors could have a significant impact on market sentiment and volatility in gold.
Weak economic data from major economies such as the U.S. and the Eurozone indicates challenging economic conditions, leading investors to view gold as a safe-haven asset.
Interest rates: Although the Fed continues its rate hike policy, financial market uncertainties could continue to support gold as a preferred asset class.
📉 TECHNICAL ANALYSIS
On the M30–H1 timeframe, XAU/USD is currently moving within a rising channel. After the correction in Wave 4, gold has bounced back in the 335x region and is now preparing to confirm the next trend. Signals from EMA indicate accumulation, potentially setting up for a strong rally ahead.
Key resistance levels: 3,338 – 3,345 (unexplored FVG region). If gold breaks above 3,345, a continued rise to 3,353 is highly likely.
Key support levels: 3,282 – 3,275. If gold retests these levels without breaking them, the chances of a rebound are strong.
🎯 TRADE SETUPS FOR TODAY
🔵 BUY ZONE:
Entry: 3,302 - 3,304
SL: 3,296
TP: 3,306 → 3,310 → 3,314 → 3,318 → 3,325
🔴 SELL ZONE:
Entry: 3352 - 3354
SL: 3,358
TP: 3,348 → 3,344 → 3,340 → 3,330 → 3,320
⚠️ NOTE:
Risk management: Expect significant volatility as the market awaits important news this week.
Wait for confirmation: Technical signals are for guidance; clear confirmation from the charts is needed before entering trades.
📌 CONCLUSION:
Gold is currently in a sideway phase and may be preparing for a breakout if these key support and resistance levels are breached.
Traders should monitor both macroeconomic factors and strategic price zones to make informed trading decisions.

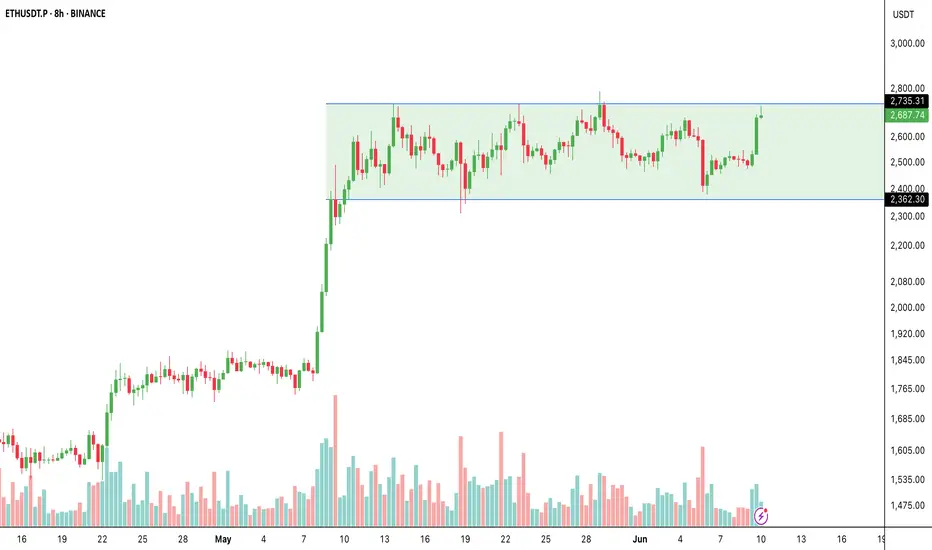
Ethereum Breakout Imminent?🚨 Ethereum Breakout Imminent?
CRYPTOCAP:ETH has been trading in a wide range:
👉 Support: ~$2,362
👉 Resistance: ~$2,735
Now ETH is once again testing this critical resistance zone with higher lows and rising volume — a classic breakout setup in play.
What to watch:
✅ Break & close above $2,735 → $2,800 → $2,900 → $3K
❌ Rejection → back to $2,400–$2,500 range.
Summary:
Ethereum is building momentum → next move could be explosive.
Will it break out or rotate? Stay sharp!
NFA & DYOR
Gold ,Momentum on MuteGold continues to trade within a well-defined range, showing no clear breakout or breakdown. Price remains trapped between the narrow range . Despite brief upward attempts, bearish pressure near the red trendline has kept the market capped this suggesting indecision as neither bulls nor bears have seized control. Unless we see a decisive break above 3330-40 area (previous support now resistance) red descending trendline or below the support region, price is likely to remain sideways and choppy in the short term.
This remains a non-trading zone for directional traders. Better opportunities may emerge after a volatility expansion outside this range.

Bitcoin is just 2% away from a new all-time high —will it break?Bitcoin is just 2% away from a new all-time high — will it break or fake? 🚀
BTC is currently trading near $109K–$110K, only 2% below the $112K ATH level.
Strong supports: $94,000 / $80,000
Bullish Case:
If BTC breaks $110K–$112K with strong volume + a bullish weekly close → we could see a rally toward: $135K → $150K
Bearish Case:
If BTC rejects at $110K–$112K, a deep retracement below $100K is possible. Watch for strong support at $100K and $80K levels.
My Personal Take:
I'm bullish overall — but since we’re this close to ATH, I’m opening a short trade with 3% stop loss targeting near $100K.
👉 Not financial advice — do your own research. The crypto market is highly volatile.
Watch this level closely — next big BTC move may be starting NOW. 👀

Why Is Hamster Kombat ($HMSTR) Dumping Hard?Why Is Hamster Kombat ($HMSTR) Dumping Hard? Here’s What’s Happening 👇
Hamster Kombat ($HMSTR) was one of the most anticipated airdrop tokens this year — but after going live, the token is now seeing a steep decline.
Here are the main reasons behind this big dump:
▶️ Massive Airdrop Sell Pressure
→ Over 131M users received free tokens
→ Many are selling immediately to lock in profits
→ Top wallets (insiders) are also unloading heavily
▶️ Weak Tokenomics
→ Circulating supply ~64B, max 100B
→ More tokens set to unlock = more selling expected
▶️ Community Frustration
→ Many users reported unfair airdrop mechanics
→ Only 88.75% unlocked at launch
→ Trust in the project took a big hit
▶️ Technical Issues
→ Telegram wallet & TON blockchain faced glitches during trading
→ Early trading experience was poor → More sell pressure
▶️ Tap-to-Earn Model Fatigue
→ The tap-to-earn hype is fading
→ Most players are cashing out, not holding or building
▶️ Bearish Chart Structure
→ Broke key support (~$0.00235)
→ No bullish signals yet — latest low ~$0.001214
Bottom line:
Right now, $HMSTR is following the typical pump & dump cycle we’ve seen with other tap-to-earn tokens. Until trust is rebuilt and real utility emerges, expect cautious trading ahead.
👉 Are you holding $HMSTR or watching from the sidelines?
#HamsterKombat #HMSTR #CryptoNews #CMC #Altcoins

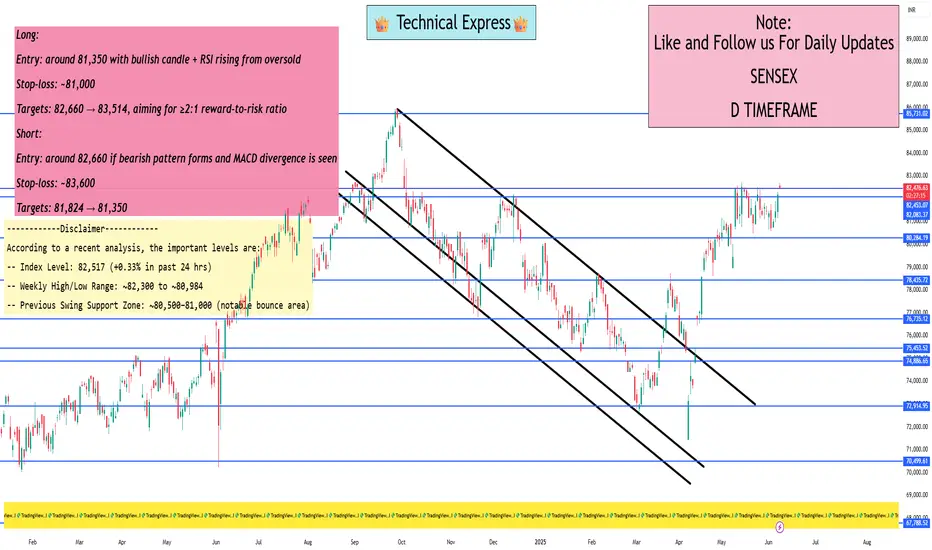
Sensex levels for swing tradingAccording to a recent analysis, the important levels are:
Index Level: 82,517 (+0.33% in past 24 hrs)
Weekly High/Low Range: ~82,300 to ~80,984
Previous Swing Support Zone: ~80,500–81,000 (notable bounce area)
Long:
Entry: around 81,350 with bullish candle + RSI rising from oversold
Stop‑loss: ~81,000
Targets: 82,660 → 83,514, aiming for ≥2:1 reward-to-risk ratio
Short:
Entry: around 82,660 if bearish pattern forms and MACD divergence is seen
Stop‑loss: ~83,600
Targets: 81,824 → 81,350
Waiting for the Breakout: Consolidation or Trend Continuation?XAUUSD – Waiting for the Breakout: Consolidation or Trend Continuation?
Gold (XAUUSD) is trading within a narrowing range, building momentum after rebounding from the 3.276 support area. Despite short-term uncertainties, the overall macroeconomic landscape continues to favor bullish scenarios — though key resistance levels must be cleared to confirm continuation.
🌍 MACRO & MARKET SENTIMENT
USD Weakness: The DXY continues to trade under pressure, increasing the appeal of non-yielding assets like gold.
US–China Trade Talks: Ongoing high-level negotiations in London could either ease geopolitical tensions or fuel safe-haven demand, depending on outcomes.
Global Risk Appetite: With US debt ceiling concerns still looming and the Fed showing hesitancy to cut rates soon, gold remains in focus as a hedge.
📈 TECHNICAL OUTLOOK (30M–H1)
The price has formed a descending wedge structure and is hovering near key EMAs (13–34–89–200).
A breakout above 3,334 could trigger a short-term bullish wave, while failure at this zone would likely lead to deeper correction toward 3,276 or lower.
📍 STRATEGIC KEY LEVELS
Resistance: 3,334 – 3,336 – 3,362 – 3,390
Support: 3,300 – 3,276 – 3,250
🧭 TRADING SCENARIOS
🔵 BUY ZONE: 3,276 – 3,274
SL: 3,270
TP: 3,280 → 3,284 → 3,288 → 3,292 → 3,296 → 3,300
🔻 SELL SCALP: 3,334 – 3,336
SL: 3,340
TP: 3,330 → 3,326 → 3,322 → 3,318 → 3,314 → 3,310
🔻 SELL ZONE: 3,362 – 3,364
SL: 3,368
TP: 3,358 → 3,354 → 3,350 → 3,346 → 3,340 → 3,335 → 3,330 → 3,320
✅ SUMMARY
Gold remains in a critical range, and traders should focus on well-defined zones to capitalize on volatility. Use confirmation-based entries and respect risk parameters — especially as macro headlines and technical patterns align for a potential breakout.

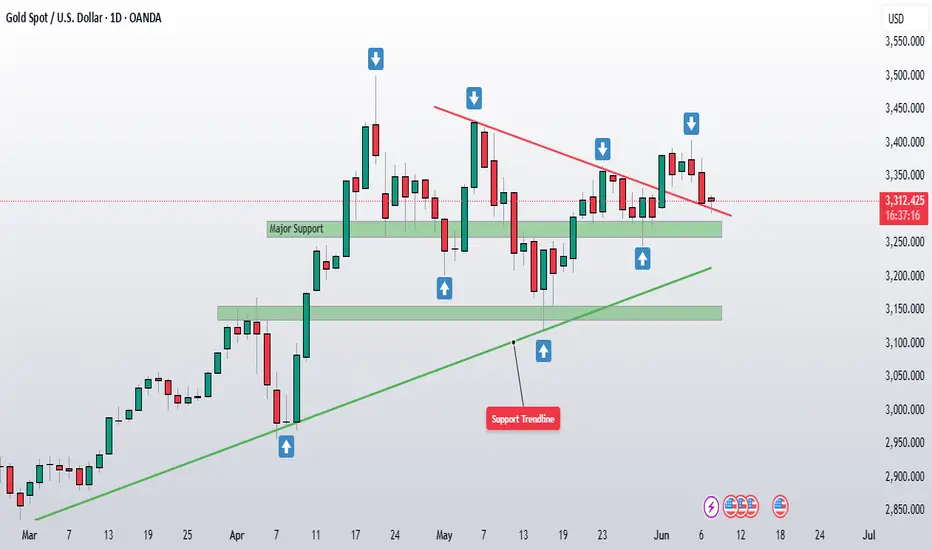
Sideways Gold, Stronger Dollar: A Pause Before the BreakGold attempted a bullish breakout recently but failed to sustain momentum and is now back within a consolidation zone between 3,250–3,350. The repeated failure to break above descending trendline resistance suggests weakening buyer strength. It is currently forming lower highs, indicating distribution or sideways movement rather than a clear rally.
On the other hand, DXY has bounced from a key demand zone near 99.00, showing signs of short-term strength. It is now targeting the 102.60–104. resistance zone, which aligns with a Fibonacci retracement. If DXY continues higher, it could put pressure on gold prices in the near term.
Given this context, it is wise to remain on the sidelines for the next 2–3 weeks and wait for one of two scenarios:
1. DXY rejection from the 102.60–104 area – This would support a bullish case for gold.
2. Gold breakout above 3,400 with strong volume or need another bounce from lower support area as marked on chart which can provide confirmation of bullish continuation.
Until then, gold is likely to stay in a range or face minor downside due to DXY strength.
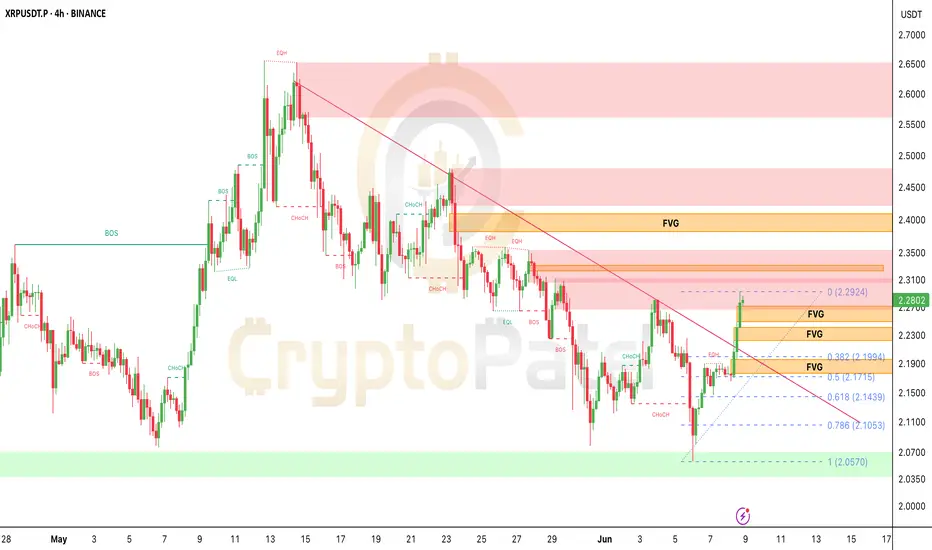
XRP/USDT 4H — Major Breakout Alert! 🔥 XRPUSDT 4H — Major Breakout Alert! 🔥
Here’s what I’m seeing right now on the XRP 4H chart:
✅ Bullish CHoCH + BOS → trendline broken → market flipped bullish.
✅ Testing $2.29 FVG → buyers pushing strong.
✅ Volume confirms true breakout.
🎯 Next upside targets → $2.36 → $2.42 (supply zone).
Best buy zone on pullback → $2.17-$2.14 (confluence of FVG + 0.618 Fib + demand).
Bias: Bullish → Only flips neutral if $2.14 breaks down.
Pro Tip: Wait for pullback if not in yet → better R:R at $2.17-$2.14 zone.
What’s your target for CRYPTOCAP:XRP this week? Comment below! 🚀
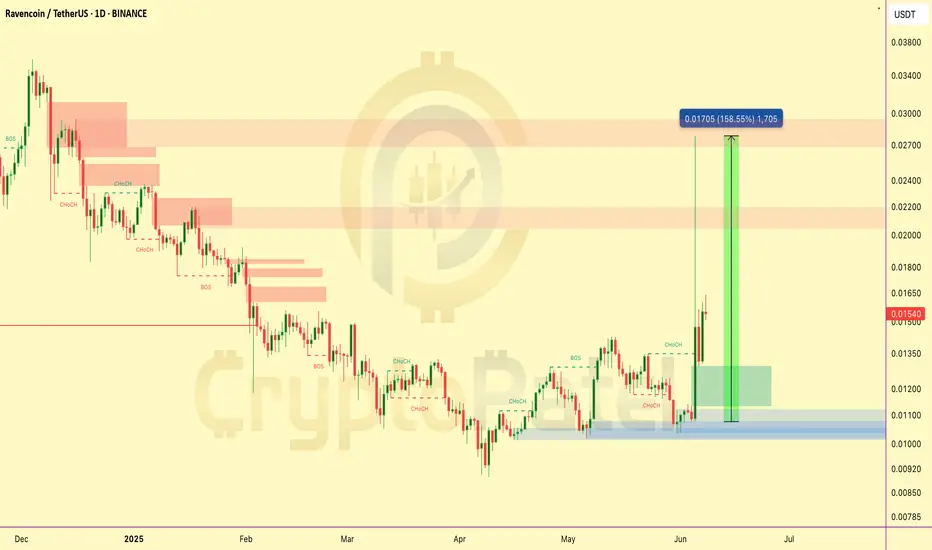
RVN/USDT Just Flipped Bullish —But Caution:High Volatility AheadRavencoin ( NGM:RVN ) pumped 158% within the last 4 days, but after the rally, it dumped -42% — showing a classic highly volatile pump & dump behavior.
👉 This type of move signals caution — it’s best to avoid blindly entering such setups.
✅ The upside rally tapped all key Bearish Order Blocks — leading to the sharp rejection.
✅ Despite the drop, RVN is still trading +45% above the recent 4-day bottom — volatility remains very high.
Current downside FVG (Fair Value Gap) → $0.01132–$0.01296
→ If price taps this zone, it could offer a better risk/reward entry — but only for experienced traders watching closely.
Summary: The chart currently does NOT look ideal for fresh entries — stay patient and let the structure develop.
👉 Save this post to stay updated — I’ll share if a new safer entry emerges!
NFA & DYOR
NFP STORM BREWING: WILL GOLD BREAK HIGHER OR DIVE LOWER?XAUUSD – NFP STORM BREWING: WILL GOLD BREAK HIGHER OR DIVE LOWER?
Gold enters a highly sensitive phase ahead of tonight’s Non-Farm Payrolls (NFP) release – one of the most influential data points for global financial markets. With US-China trade tensions rekindling and sovereign debt concerns mounting in the US, the yellow metal could experience a major breakout or a sharp reversal during the New York session.
🌍 MACRO & FUNDAMENTAL OUTLOOK
US-China trade talks have resurfaced, with concerns around tariffs and strategic metals dominating headlines. China's recent stance signals it may take stronger defensive actions.
The US national debt is projected to hit $55 trillion by 2034, prompting global central banks to ramp up gold purchases as a strategic hedge.
Fed Chair Powell reiterated a “no rush to cut” stance, yet political pressure is mounting – especially with Donald Trump urging immediate rate cuts following the weakest ADP job growth in two years.
Unemployment Claims released today came in slightly better than expected (236K vs. 240K), adding fuel to speculations around a softer NFP print – potentially bullish for gold.
🔍 TECHNICAL ANALYSIS (H1 – EMA 13/34/89/200)
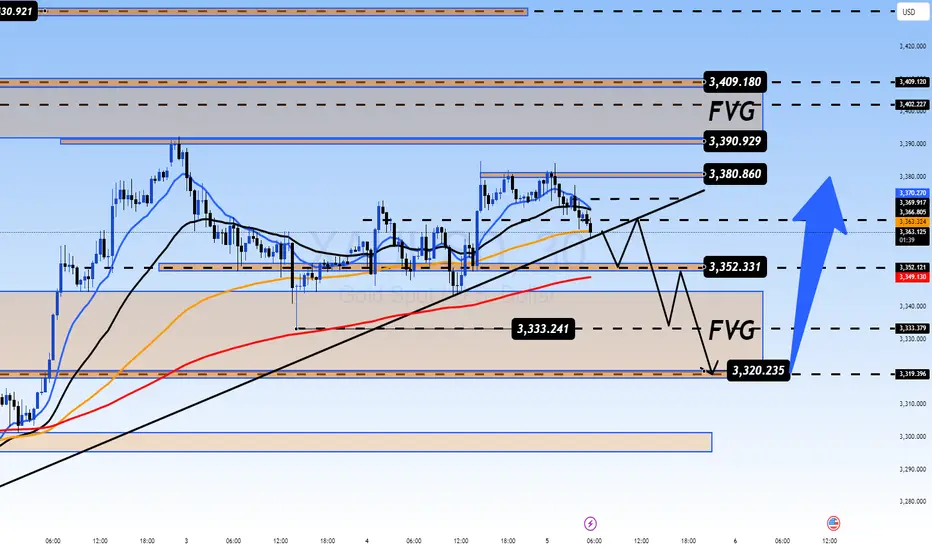
The chart shows a clean impulsive wave structure. After hitting the resistance zone at 3408–3410, gold entered a consolidation range.
Price is currently hovering around EMA 89–200, suggesting trend divergence and uncertainty ahead of NFP.
A breakdown below the 3344–3332 support zone could push price down to the FVG (Fair Value Gap) at 3320, which may act as a strong liquidity pool for buyers.
⚠️ KEY LEVELS TO WATCH
Resistance: 3380 – 3392 – 3408 – 3436
Support: 3365 – 3350 – 3344 – 3332 – 3320
🧭 TRADE SETUPS
🔻 SELL ZONE: 3408 – 3410
Stop Loss: 3415
Take Profit: 3404 → 3400 → 3395 → 3390 → 3380 → 3370 → 3360 → 3350
🔵 BUY ZONE: 3318 – 3316
Stop Loss: 3310
Take Profit: 3322 → 3326 → 3330 → 3335 → 3340 → 3350 → 3360 → ???
✅ CONCLUSION
Gold is poised for a volatile breakout with NFP acting as the key catalyst. A soft jobs report may trigger a breakout above 3410, while stronger-than-expected numbers could fuel a bearish reversal. In this sensitive phase, traders should stick to defined zones and wait for confirmed liquidity reactions rather than chasing price impulsively.

Founder’s Wallet HACKED → $4M Gone → $MASK Crashes! Full Story IFounder’s Wallet HACKED → $4M Gone → NASDAQ:MASK Crashes! Full Story Inside
Dropped -51% in few hours! 😱
*Here’s the FULL story you need to know:*
🟥 Founder’s Wallet HACKED → $4M stolen!
🟥 Big WHALE dumped $2.1M worth of MASK on Binance!
🟥 Binance DELISTING rumors caused PANIC SELLING!
Result? Massive crash — from $3.73 → $1.735 in just HOURS!
🔥 Is this the BOTTOM? Or will it DUMP more?
🔥 Are smart traders BUYING this DIP?
👉 I’ll be tracking NASDAQ:MASK LIVE — join my channel & stay ahead of the next BIG MOVE!

MASK 3.7x PUMP — Is a BIG DIP Coming?MASK 3.7x PUMP — Is a BIG DIP Coming?
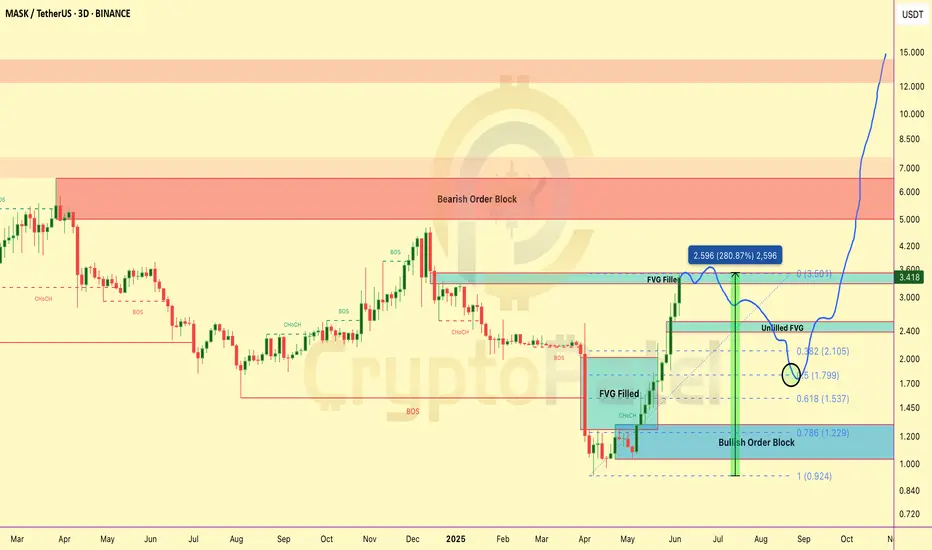
MASK just delivered a MASSIVE rally from the Bullish Order Block at $1.2–$1.3 — and filled the FVG around $3.5.
Here’s what’s next 👇
🟢 Short-Term Outlook:
👉 After pumping from $0.927 → $3.50 → that’s a 3.7x move WITHOUT any major retracement.
👉 High chances of a healthy pullback next.
👉 Strong Accumulation Zone: If price drops towards 0.5 Fib retracement at $1.80 → This will be a key area for Smart Money to re-enter.
🟢 Mid-Term Potential:
👉 Once accumulation is done → breakout above $3.5 highly likely.
👉 First big target → Bearish Order Block at $5–$7.
🟢 Long-Term Vision:
👉 If BTC supports and MASK maintains bullish structure → can aim for $15/$30/$50 🚀
👉 Huge upside still left on higher timeframes.
Key Levels to Watch:
✅ $3.5 → Resistance
✅ $2.1–$1.5 → Retracement buy zone (Unfilled FVG + Fib confluence)
✅ $1.80 → 0.5 Fib — Strong Accumulation Zone
✅ $5–$7 → Major target zone
✅ $15/$30/$50 → Long-term moonshot
My Play → Waiting patiently for retracement → looking to accumulate in $2.1–$1.5 zone, ideally around $1.80 → position for next rally!
👉 What’s YOUR strategy on MASK? Buying the dip or waiting higher? Comment below 👇👇👇
NFA & DYOR
Bitcoin Bulls vs Bears — Battle Zones Mapped Out#Bitcoin Bulls vs Bears — Battle Zones Mapped Out
🔰 $105K–$106.7K = Bearish Order Block:
Below this zone = CRYPTOCAP:BTC stays bearish unless HTF closes above $106.7K
🔰 Next Moves:
▪️ Likely retest $105K–$106K before next leg ↓
▪️ Target: $97K–$95K zone
🔰 Key Levels:
✅ Holding 0.618 Fib (support)
✅ Unfilled FVG: $97K–$98.3K
✅ Bullish OBs: $95.7K–$97K | $93.5K–$94.7K
If $97,000 holds strong → Expect BIG bounce!

BTC Breakdown or Bounce? Key Levels You Need to Watch!BTC Breakdown or Bounce? Key Levels You Need to Watch!
#Bitcoin 4H Chart Analysis – SMC Overview:
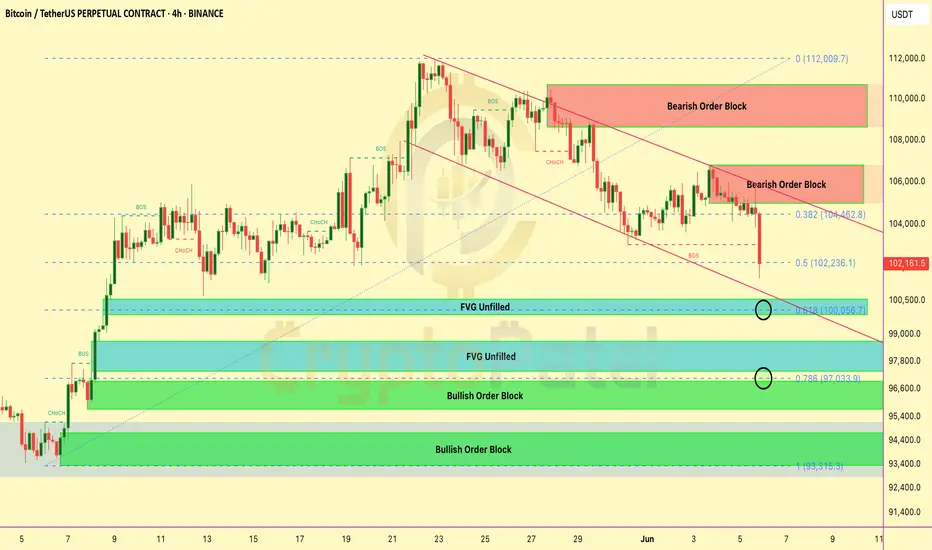
BTC is currently in a short-term downtrend, respecting a descending channel and showing clear bearish structure.
🔴 Bearish Signs:
Price rejected from 2 major Bearish Order Blocks:
▶️ $106K–$104K
▶️ $111K–$109K
Breaks of Structure (BOS) and Change of Character (CHoCH) confirm trend shift to bearish Couldn’t hold the 0.382 Fibonacci level at $104.4K — now testing the 0.5 Fib at $102.2K
🟢 Key Support Zones (Potential Reversal Areas):
1️⃣ $100K Zone
✔️ 0.618 Fib level
✔️ Unfilled Fair Value Gap (FVG)
🔍 Possible bullish reaction from here
2️⃣ $97K Zone
✔️ 0.786 Fib
✔️ Bullish Order Block (OB)
✔️ Another FVG
💥 Strong confluence — good probability of reversal
3️⃣ $93K Zone
✔️ Deep Bullish OB
🛡️ Last strong support if $97K fails
🔼 If bulls reclaim control: We need a clear CHoCH above $104.5K to confirm bullish shift
⚠️ Tip: Mark these zones. Use alerts. Let the price come to you — don’t force trades.
📢 Share if useful & stay updated
4 Stocks. 4 Stories. Here's How I See Them Without Predictions..Purely chart-based view. No bias. No advice. Just how I interpret these right now
I make educational content videos on Swing trading .

Gold Awaits NFP Data: Will It Explode or Break Down from Range?XAUUSD – Gold Awaits NFP Data: Will It Explode or Break Down from Range?
Gold remains in a consolidation phase, coiling tightly ahead of the highly anticipated Non-Farm Payrolls (NFP) report. With traders on edge, the market is poised for a breakout – but in which direction?
🌍 MACRO & FUNDAMENTAL INSIGHT
Donald Trump reignited pressure on the Federal Reserve, calling for an immediate rate cut, especially after the recent ADP Employment Report showed the weakest job growth in over two years.
Fed Chair Jerome Powell, however, maintains a cautious stance, emphasizing that “no rush” to cut rates unless inflation convincingly trends lower.
Meanwhile, U.S. national debt is projected to hit $55 trillion by 2034, with unchecked fiscal expansion. This is fueling a global central bank gold-buying spree, with many purchases not even officially reported.
💡 This confluence of macroeconomic stress, monetary uncertainty, and geopolitical tension is pushing gold into the spotlight as a safe haven.
🔍 MARKET POSITIONING & SHORT-TERM DRIVERS
Unemployment Claims released today: 236K vs previous 240K – slightly positive, but not strong enough to offset weak labor momentum.
Treasury yields remain high (10Y at 4.55%), suggesting that while inflation fears persist, risk appetite is fragile.
The NFP release will likely serve as the catalyst for gold's next directional move, especially as liquidity builds up in a narrowing technical structure.
📈 TECHNICAL ANALYSIS (H1 – EMA 13/34/89/200)
Price is consolidating within a sideways range between 3333–3380, forming a classic liquidity trap just below key resistance.
The 3352–3333 zone is a critical structural support. A break below this level opens the door for a dip toward the FVG liquidity zone around 3320–3318.
On the upside, 3388–3400 remains a rejection zone. A clean breakout could target 3409 and even Fibonacci extension resistance at 3435–3445.
🔑 KEY TECHNICAL LEVELS
Resistance: 3388 – 3392 – 3400 – 3409
Support: 3355 – 3333 – 3320 – 3318
🧭 TRADING STRATEGY
🔵 BUY ZONE: 3320 – 3318
SL: 3314
TP: 3324 → 3328 → 3332 → 3336 → 3340 → 3350 → 3360 → ???
🔻 SELL ZONE: 3408 – 3410
SL: 3414
TP: 3404 → 3400 → 3396 → 3390 → 3386 → 3380 → 3370
✅ FINAL THOUGHTS
Gold is currently at the eye of the storm, with both fundamental and technical indicators aligned for volatility. The coming NFP release could tilt the balance sharply.
Stay disciplined: trade key zones only, wait for confirmation, and prioritize risk management. In markets like these, precision beats prediction.
Silver also looking good from HereThis is the only time frame where I am watching silver as on now (On Monthly )
Chart is self explanatory, All we need a break above 35 , closing above this level can start a much awaited bull run on silver from here.
and if we see good momentum from silver , gold also goig to follow the same in short term to mid term basis.

Gold : Looking good so far ...No Change to chart
Support Levels that we have to watch:
Immediate Support : 3345-50(PDL and 50)
Secondary Support : 3330-35
Major Support : 3280-90
Immediate resistance : Current Week High(3390-92)
secondary Resistance : 3440-45
Major Resistance : ATH (3500)

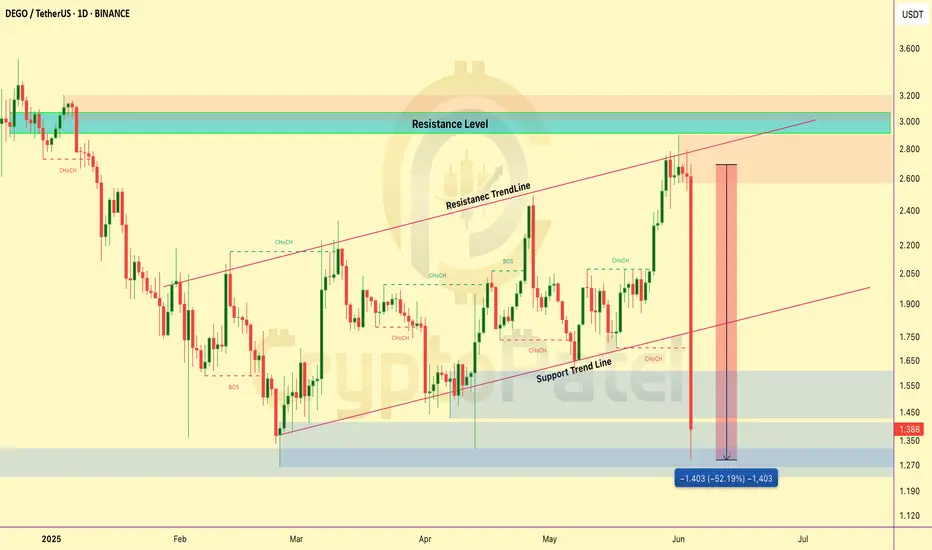
DEGO Price Dumped Hard – What Happened?🚨 DEGO Price Dumped Hard – What Happened?
Dego Finance ($DEGO) dropped over 40% today and here’s why:
🔻 Big Token Dump:
A huge amount of DEGO tokens (worth over $250K) was sent to exchanges — this caused heavy selling pressure.
💥 Record Liquidations:
Over $650K in long positions got liquidated — highest ever for DEGO!
⚠️ USD1 Stablecoin FUD:
DEGO recently said they bought the new USD1 stablecoin. Some users think this might be a risky or scammy move, adding more fear.
📉 Technical Rejection:
Price hit $2.70, then faced strong resistance and dropped fast. Bearish market conditions made it worse.
Stay alert! This is a high-risk zone — wait for stable support if you’re planning to enter.