BITCOIN CME Gap Alert: CME GAP around $91000BITCOIN CME Gap Alert:
As per CME chart, Bitcoin still has an unfilled gap between $91,970 – $92,730.
In my opinion, BTC must revisit around $91,970 to fully close this gap.
Price usually returns to CME gaps because they act as liquidity zones and market inefficiencies, the market tends to fill them before continuing the main trend.
NFa & DYOR
Trading

Private vs Public Banks in the Indian Market1. Ownership and Management Structure
The fundamental difference between public and private banks lies in ownership.
Public Sector Banks (PSBs) are majority-owned by the Government of India, which holds more than 50% of their equity. The government plays a key role in appointing top executives and formulating policy directions. Examples include State Bank of India (SBI), Punjab National Bank (PNB), Bank of Baroda (BoB), and Canara Bank.
Private Sector Banks (PVBs), on the other hand, are owned and managed by private entities or individuals, with the government having little or no control. The management is typically professional, and boards are accountable to private shareholders. Major private banks include HDFC Bank, ICICI Bank, Axis Bank, Kotak Mahindra Bank, and IndusInd Bank.
This difference in ownership affects how both types of banks operate, their decision-making processes, and their responsiveness to market conditions.
2. Historical Background
Public sector banks form the backbone of India’s traditional banking system. They gained prominence after bank nationalization in 1969 and 1980, which brought 20 major banks under government control. The aim was to ensure that banking services reached rural and underbanked areas, supporting agriculture, small industries, and social development.
Private banks, however, emerged in two waves:
The first phase included old private banks such as Karur Vysya Bank, South Indian Bank, and Federal Bank, which were regional and limited in scale.
The second phase, or the “new generation” private banks, began after the economic liberalization of 1991, when the Reserve Bank of India (RBI) allowed new private players to enter. Banks like HDFC Bank, ICICI Bank, and Axis Bank brought innovation, technology, and competition to the market.
3. Operational Efficiency and Technology
Private sector banks are widely recognized for their efficiency and technological advancement. They were pioneers in introducing digital banking, internet and mobile apps, ATMs, 24/7 customer service, and AI-based financial solutions. Their focus on automation and quick service appeals especially to urban customers.
Public banks, though initially slower to adopt technology, have made significant progress in recent years. Initiatives like YONO by SBI, Bank of Baroda’s digital transformation, and PSB Alliance have modernized public banking. However, public banks still face challenges due to their vast legacy systems and bureaucratic procedures.
4. Customer Service and Experience
Private banks are often perceived as offering superior customer service, with faster processing times, personalized products, and proactive relationship management. Their staff is trained to focus on efficiency and customer satisfaction.
Public banks, however, have traditionally been known for longer processing times and formal procedures. Yet, they provide an essential service to a larger section of society, especially in rural and semi-urban areas where private banks may not have strong penetration. PSBs are more committed to social welfare schemes such as Jan Dhan Yojana, Mudra loans, and agricultural credit programs.
5. Market Reach and Financial Inclusion
In terms of reach, public sector banks hold a dominant position. They have thousands of branches across rural India, ensuring that even remote populations have access to banking facilities. For instance, SBI alone accounts for more than 20% of India’s total banking network.
Private banks, conversely, focus primarily on urban and metropolitan regions where customers demand faster, technology-driven services. However, they are now expanding into Tier 2 and Tier 3 cities to capture a growing middle-class market.
6. Profitability and Performance
Private banks usually exhibit higher profitability, better asset quality, and more stable returns. Their operational flexibility, low non-performing asset (NPA) ratios, and efficiency in cost management contribute to superior financial performance. For instance, banks like HDFC and ICICI consistently report high return on assets (ROA) and return on equity (ROE).
Public banks, due to their social obligations and exposure to priority sectors, often face higher NPAs and lower profitability. Lending to agriculture, infrastructure, and small enterprises—though socially vital—sometimes leads to defaults. However, government support through recapitalization and mergers (like SBI with its associate banks) helps maintain their financial stability.
7. Lending Patterns and Risk Management
Public banks prioritize social and developmental objectives, lending to priority sectors such as agriculture, small industries, and low-income groups. They are also instrumental in implementing government schemes like PMEGP, Stand-Up India, and PM Kisan.
Private banks focus more on profitable segments such as retail loans, home loans, credit cards, and wealth management. They employ advanced risk assessment tools, AI-driven credit scoring, and market-based pricing, which help reduce bad loans and maintain better credit discipline.
8. Employment and Work Culture
Public sector banks provide job security, stable career paths, and government-linked benefits. They attract candidates through national-level exams conducted by IBPS or SBI. However, the work culture can be bureaucratic, hierarchical, and slower in decision-making.
Private banks offer performance-based incentives, faster promotions, and modern work environments, but job security is lower. They emphasize productivity, targets, and results, often leading to higher stress levels but better pay for top performers.
9. Regulatory Environment
Both public and private banks are regulated by the Reserve Bank of India (RBI) and governed by the Banking Regulation Act, 1949. However, PSBs are also accountable to the Ministry of Finance and the Parliament of India, which increases oversight but sometimes limits autonomy. Private banks enjoy greater independence in policy decisions but must adhere strictly to RBI norms.
10. Public Trust and Perception
Public banks enjoy a high level of trust among citizens, especially older generations and rural populations, because of government backing. Depositors believe their money is safe, even if the bank faces trouble, as the government is expected to intervene.
Private banks are viewed as modern, efficient, and customer-friendly, but public confidence fluctuates based on market performance. However, strong brands like HDFC Bank and ICICI Bank have built reputations rivaling public banks in reliability.
11. Future Trends and Outlook
The future of India’s banking sector lies in coexistence and collaboration between public and private players.
Public banks are likely to focus on financial inclusion, rural expansion, and implementation of government initiatives.
Private banks will continue to drive technological innovation, digital lending, and customer-centric growth.
Additionally, the rise of fintech companies, digital payments platforms (like Paytm and PhonePe), and neo-banks is pushing both sectors toward modernization and customer-focused strategies.
Government-led reforms such as bank mergers, recapitalization packages, and privatization plans indicate an evolving structure aimed at improving competitiveness and efficiency. As India’s economy grows, both public and private banks will play complementary roles in supporting national development and financial stability.
Conclusion
In summary, public sector banks represent the traditional, inclusive, and socially driven side of Indian banking, while private sector banks symbolize innovation, efficiency, and profit-oriented growth. Each has its strengths: public banks bring trust, accessibility, and social responsibility, while private banks bring technology, speed, and superior service quality.
The Indian market thrives on this balance — where government-backed institutions ensure inclusive development and private banks drive modernization and competition. Together, they form a robust dual system that continues to evolve, reflecting the dynamic needs of a rapidly developing economy.

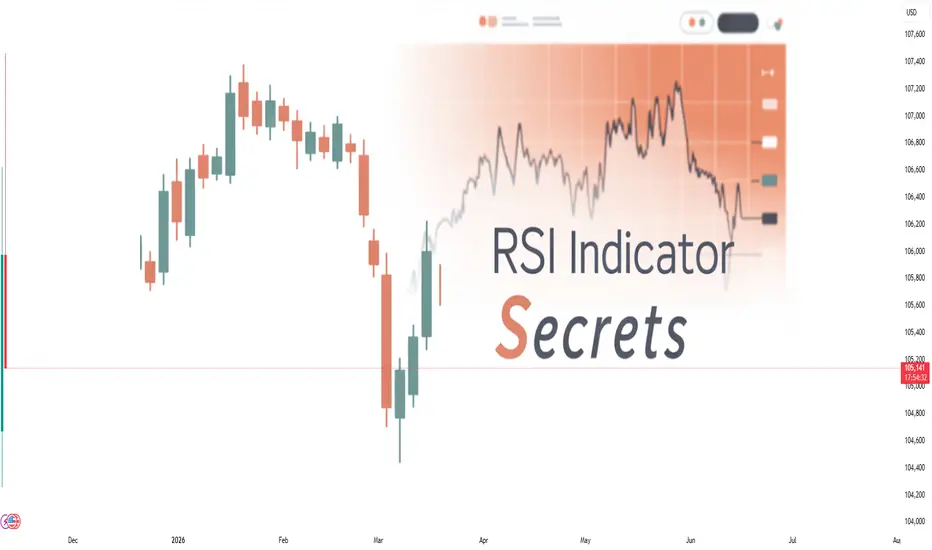
Relative Strength Index (RSI) Indicator Secrets1. The Hidden Meaning Behind RSI Levels
Most traders use the 70/30 rule blindly. In reality, RSI levels are relative, not absolute. For instance:
In a strong uptrend, RSI can remain above 70 for a long period — this does not mean the market will immediately reverse. It often indicates strong bullish momentum.
In a downtrend, RSI can stay below 30 for an extended time — signaling strong bearish pressure, not necessarily an immediate bounce.
Secret Tip:
Adjust your RSI levels based on market conditions:
Bullish market: Use RSI zones of 40–80 (support around 40, resistance around 80).
Bearish market: Use RSI zones of 20–60 (resistance around 60, support around 20).
By doing this, you interpret RSI in the context of trend strength rather than treating it as an isolated signal.
2. RSI as a Trend Identifier
One of the most overlooked uses of RSI is trend confirmation. Traders often rely on moving averages or price patterns to identify trends, but RSI can do this more efficiently.
In uptrends, RSI tends to stay above 40 and frequently reach 70–80.
In downtrends, RSI remains below 60 and often hits 20–30.
Secret Insight:
If RSI repeatedly bounces from the 40–50 zone during a price pullback, it suggests that the uptrend is healthy. Conversely, if RSI fails to move above 60 during rallies, it signals weakness in the market.
This method helps traders stay with the trend longer, instead of prematurely exiting a position when RSI crosses traditional overbought or oversold levels.
3. RSI Divergence – The Ultimate Reversal Signal
RSI divergence is one of the strongest signals for trend reversal. It occurs when the price makes a new high or low that isn’t confirmed by the RSI.
Bullish Divergence: Price makes a lower low, but RSI makes a higher low — signaling potential upward reversal.
Bearish Divergence: Price makes a higher high, but RSI makes a lower high — indicating possible downward reversal.
Secret Tip:
For divergence to be effective, it must occur after a strong trend and be confirmed by volume or candlestick patterns (like Doji, hammer, or engulfing). Many traders lose money by trading every small divergence — patience is key.
Additionally, hidden divergence can predict trend continuation:
Hidden Bullish Divergence: RSI makes a lower low, but price makes a higher low → continuation of uptrend.
Hidden Bearish Divergence: RSI makes a higher high, but price makes a lower high → continuation of downtrend.
Combining regular and hidden divergences can give traders early entry signals and improve accuracy.
4. RSI Swing Rejections: The Secret Entry Technique
Welles Wilder’s original writings described an advanced RSI technique called “Swing Rejection”, which most traders overlook.
A bullish swing rejection occurs when:
RSI drops below 30 (oversold zone).
It rises above 30.
Pulls back but stays above 30.
Then breaks its previous high.
This pattern signals a strong bullish reversal — often before the price fully turns up.
A bearish swing rejection is the opposite:
RSI rises above 70.
Falls below 70.
Rebounds but fails to cross 70 again.
Then breaks its prior low — confirming weakness.
Secret Insight:
Swing rejections filter out false overbought/oversold signals and identify high-probability turning points in the market.
5. RSI with Multiple Time Frames
Professional traders rarely rely on a single RSI setting or timeframe. Instead, they confirm RSI signals across multiple timeframes.
For example:
If the daily RSI is oversold but the weekly RSI is still in a downtrend, the bounce may be short-lived.
When both daily and weekly RSI align in the same direction, it indicates a powerful trend reversal or continuation.
Secret Tip:
Use RSI(14) on higher timeframes (daily/weekly) for trend bias, and RSI(7) or RSI(9) on lower timeframes (hourly or 4-hour) for precise entries.
6. RSI and Moving Averages – A Smart Combination
Combining RSI with moving averages creates a more reliable trading system. For example:
Use a 50-period moving average to determine the trend direction.
Trade RSI signals only in the direction of the moving average.
Example:
If the price is above the 50-MA and RSI bounces from 40 → it’s a strong buy signal.
If the price is below the 50-MA and RSI drops from 60 → it’s a strong sell signal.
This combination filters out false signals and aligns trades with the dominant market trend.
7. RSI Range Shifts – The Professional Secret
A rarely discussed RSI secret is the concept of range shifts. In a strong uptrend, RSI tends to move between 40–80 instead of 30–70. In a strong downtrend, it shifts between 20–60. Recognizing this range shift early helps traders identify when the market transitions from sideways to trending behavior.
When RSI consistently fails to fall below 40 and pushes above 70, it confirms that bulls control the market. Conversely, when RSI struggles to rise above 60 and keeps hitting 30, bears dominate.
Spotting a range shift early can help you enter trends sooner and ride them longer.
8. Customizing RSI Periods for Different Assets
Most traders use the default 14-period RSI. However, adjusting the period can dramatically change its responsiveness:
Shorter RSI (5 or 7): More sensitive, gives early signals but more noise.
Longer RSI (20 or 30): Smoother, fewer false signals but more lag.
Secret Tip:
For volatile instruments like cryptocurrencies or small-cap stocks, use a shorter RSI (7–10).
For stable assets like large-cap stocks or indices, use longer RSI (14–21).
Customizing RSI settings according to volatility improves accuracy and reduces whipsaws.
9. Psychological Secrets of RSI
At its core, RSI reflects market psychology — the tug-of-war between buyers and sellers. When RSI rises above 70, it shows traders’ greed; when it falls below 30, it reveals fear. Understanding this helps you trade in the opposite direction of crowd emotions.
The best traders use RSI not just as a technical tool, but as a window into trader sentiment. Combining RSI readings with support/resistance zones or volume analysis offers a powerful edge.
10. Conclusion
The RSI indicator is far more than a simple overbought/oversold tool. Its true strength lies in understanding context, trend structure, divergence, and range behavior. By mastering RSI’s hidden secrets — such as swing rejections, range shifts, and multiple timeframe confirmations — traders can dramatically improve accuracy and timing.
When used intelligently, RSI reveals the rhythm of market momentum and helps traders ride trends, spot reversals, and stay on the right side of price action. Like all tools, it works best when combined with sound risk management, patience, and discipline — the true secrets behind profitable trading.
XAUUSD – PRICE STRUCTURE UPDATE: MAINTAINING THE TRADING ...💛 XAUUSD – PRICE STRUCTURE UPDATE: MAINTAINING THE TRADING SCENARIO 🎯
🌤 Overview
Hello everyone 💬
The price structure of gold is still on track as per the previous scenario — those who have bought according to the prior plan might have already profited and should continue to hold their ground.
The price in the Asian session at the start of the week has risen steadily, breaking through the 4021 zone, confirming a short-term uptrend and aiming to retest the upper edge of the H4 price channel.
This is a positive signal before the market might enter a deeper correction in the mid-week sessions.
In terms of news, the latest statement from US President Trump indicates that the government shutdown might soon end — this is a factor that could cause significant USD volatility, thereby having a short-term impact on gold prices.
💹 Technical Analysis
📈 On the H4 frame, the price remains within the medium-term upward channel, maintaining the structure of “higher lows”.
🟣 Breaking the 4021 zone confirms that upward momentum is prevailing, and the Sell Zone Liquidity 4090–4100 continues to be the short-term target for testing.
🔹 After hitting this zone, a correction is expected towards the 3920 – 3785 zone (Buy Zone Fibonacci) – where buyers might return strongly.
💫 The current price signal is entirely in line with the previous technical scenario, with no need to change the trading plan.
🎯 Reference Trading Plan
💢 SHORT scenario (short-term)
Entry: 4098–4102 | SL: 4112
TP: 4078 – 4025 – 3998 – 3920 – 3875 – 3785
💖 LONG scenario (long-term strategy)
Entry: 3785–3789 | SL: 3777
TP: 3810 – 3865 – 3925 – 3988
🌷 Conclusion
Gold prices are moving exactly as predicted in the structure 💛
Be patient, maintain discipline, and stick to the key price zones – this is the time when perseverance will yield the greatest advantage.

Step-by-Step Divergence Trading StrategyOption Pricing Factors
Option prices are influenced by several key factors:
Spot Price: Current market price of the asset.
Strike Price: Pre-agreed exercise price.
Time to Expiry: Longer duration = higher premium (due to time value).
Volatility: Higher volatility = higher premium (greater uncertainty).
Interest Rates: Affect cost of carry.
Dividends: Expected payouts can impact call and put prices.

Sub-Brokers in India1. Who is a Sub-Broker?
A sub-broker is an intermediary who acts as a bridge between investors and stockbrokers. In simple terms, a sub-broker is an agent or franchise partner who does not directly trade on the stock exchanges but helps investors carry out their trades through a registered stockbroker.
Earlier, sub-brokers were required to register with SEBI under the SEBI (Stock Brokers and Sub-Brokers) Regulations, 1992. However, after 2018, SEBI discontinued the direct registration of new sub-brokers, shifting the model toward Authorised Persons (APs) under the exchange’s regulations (like NSE or BSE). Thus, in the current system, the term sub-broker and authorised person are used interchangeably, although “sub-broker” still exists in market terminology.
2. Evolution of Sub-Brokers in India
In the early 1990s and 2000s, the Indian capital market was dominated by physical trading and traditional brokerage houses. Investors from smaller towns had limited access to stock exchanges located in metros like Mumbai or Delhi. Sub-brokers emerged as local representatives of big brokers, offering access to markets through personalized services.
With the introduction of dematerialization, online trading, and discount brokerages, the ecosystem began to shift. Full-service brokers started expanding their presence through sub-broker networks and franchisees. After SEBI’s 2018 circular, the registration and regulatory structure changed, giving rise to the Authorised Person (AP) model, which simplified processes and brought all sub-brokers under the supervision of exchanges rather than SEBI.
Today, sub-brokers continue to play a vital role in financial inclusion, especially in tier-2 and tier-3 cities, where personal trust and relationships drive investment decisions.
3. Role and Responsibilities of Sub-Brokers
Sub-brokers perform several important functions that help the stock market ecosystem grow smoothly. Their main responsibilities include:
Client Acquisition and Relationship Management:
They identify and onboard new investors, explaining investment opportunities and helping clients open trading and demat accounts through their affiliated brokers.
Advisory Services:
Many sub-brokers provide personalized advisory support—guiding clients about market trends, suitable investment products, and portfolio diversification (though only SEBI-registered advisors can offer paid advice).
Trade Execution Assistance:
They help clients place buy/sell orders, manage trade confirmations, and ensure smooth execution through the broker’s platform.
Documentation and Compliance:
Sub-brokers assist in completing KYC (Know Your Customer) documentation and ensure compliance with SEBI and exchange rules.
After-Sales Service:
They support clients with margin updates, account statements, payout requests, and grievance redressal.
In short, sub-brokers act as the local face of big brokerage firms, ensuring last-mile connectivity and personal service to clients.
4. The Regulatory Framework
The SEBI (Stock Brokers and Sub-Brokers) Regulations, 1992 originally governed sub-broker activities. However, with changing market dynamics, SEBI simplified the process by amending the regulations.
Key milestones include:
1992: Sub-broker registration made mandatory under SEBI rules.
2018: SEBI discontinued new registrations of sub-brokers and replaced them with the Authorised Person (AP) model.
Current Framework:
A sub-broker (now AP) must be affiliated with a SEBI-registered stockbroker (member of NSE, BSE, or MCX).
The stock exchange maintains records and ensures due diligence before approving an AP.
Sub-brokers must follow all rules regarding client onboarding, KYC, and grievance handling.
Thus, while the term “sub-broker” still exists informally, all new participants are registered under the AP structure.
5. How to Become a Sub-Broker or Authorised Person
To become a sub-broker (or AP) in India, the following steps are generally followed:
Select a Broker Partner:
Choose a SEBI-registered brokerage firm like Angel One, ICICI Direct, Zerodha, Sharekhan, or Motilal Oswal that offers franchise or AP programs.
Application Process:
Submit an application to the broker and respective stock exchange with necessary documents (identity proof, educational qualification, business address, etc.).
Documentation:
The documents required typically include:
PAN and Aadhaar Card
Proof of business premises
Educational certificates (minimum 10+2)
Bank statement and canceled cheque
Photograph and signature
Exchange Approval:
The broker forwards the application to the exchange (e.g., NSE or BSE) for approval. Once approved, the applicant becomes an authorised person and can start operations.
Franchise Agreement:
A business agreement is signed between the broker and the sub-broker/AP defining revenue sharing, rights, and responsibilities.
6. Revenue Model of Sub-Brokers
Sub-brokers earn income mainly through revenue sharing with the main broker. The structure varies depending on the broker, product type, and business volume.
Common revenue models include:
Commission Sharing:
The sub-broker earns a fixed percentage of the brokerage generated by clients introduced by them. The typical sharing ratio is 60:40 to 80:20 (in favor of the sub-broker).
Referral Income:
For clients referred to digital brokers, sub-brokers may earn a one-time onboarding incentive or small lifetime brokerage sharing.
Additional Incentives:
Some brokers offer performance bonuses, marketing support, or rebates for reaching trading volume targets.
Thus, income potential depends on the sub-broker’s client base, service quality, and regional presence.
7. Advantages of Being a Sub-Broker
Low Investment, High Potential:
Unlike starting a full-fledged brokerage, becoming a sub-broker requires limited capital investment.
Established Brand Support:
Working with reputed brokers allows sub-brokers to leverage brand trust and advanced technology platforms.
Wide Product Range:
Sub-brokers can offer clients access to equities, derivatives, commodities, mutual funds, and IPOs under one platform.
Recurring Income:
Since brokerage is earned on every transaction, sub-brokers enjoy recurring revenue as long as clients remain active.
Local Market Expansion:
Sub-brokers act as key drivers of financial inclusion, helping investors from smaller cities participate in markets confidently.
8. Challenges Faced by Sub-Brokers
Despite opportunities, sub-brokers face several challenges in the modern trading environment:
Digital Disruption:
Discount brokers like Zerodha and Groww have reduced brokerage fees drastically, impacting commission-based income.
Regulatory Compliance:
Sub-brokers must stay updated with frequent SEBI and exchange rule changes.
Client Retention:
With the rise of online self-trading, retaining clients through personalized service has become more critical.
Competition:
Thousands of sub-brokers and financial distributors operate in the same localities, making differentiation difficult.
Nevertheless, many sub-brokers are adapting by embracing digital tools, offering hybrid advisory models, and focusing on long-term wealth management.
9. Future of Sub-Brokers in India
The sub-broker system is not disappearing—it is evolving. The Authorised Person model, combined with digital franchise frameworks, is making sub-brokerage more transparent, scalable, and technology-driven.
In the coming years, the focus will shift toward:
Digital client acquisition and onboarding
AI-driven advisory and analytics tools
Multi-asset offerings (stocks, mutual funds, insurance, loans)
Partner networks expanding in rural and semi-urban regions
SEBI’s vision of financial inclusion aligns well with the sub-broker model, ensuring that even small investors across India get access to capital markets.
Conclusion
Sub-brokers have been the backbone of India’s retail participation in stock markets. While their regulatory identity has evolved into that of Authorised Persons, their importance remains undiminished. They serve as the personal link between investors and markets—educating, assisting, and empowering individuals to invest confidently.
In an age of digital platforms and algorithmic trading, sub-brokers continue to add human value—trust, guidance, and service—which technology alone cannot replace. As India’s financial markets expand, the sub-broker network will remain an essential pillar of inclusive market growth and investor participation.

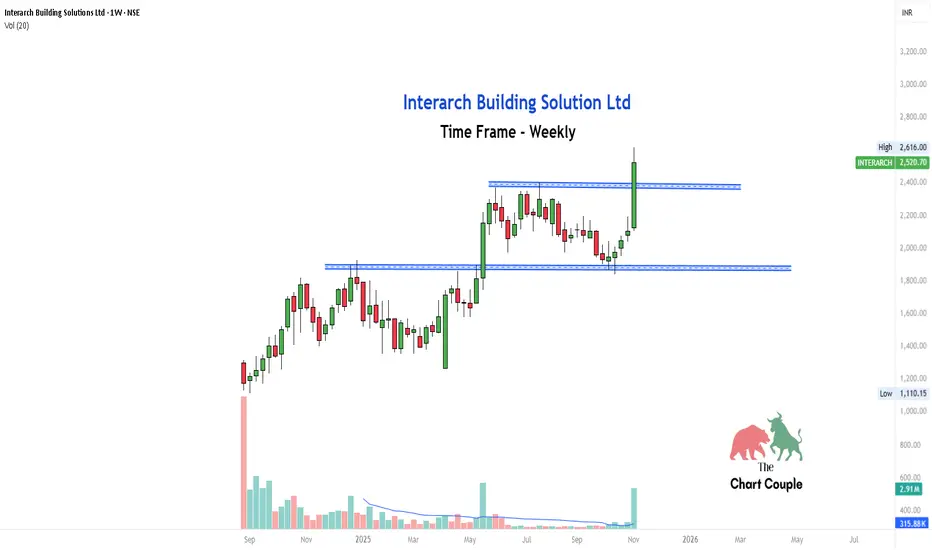
Interarch Building Solution Ltd — Weekly Chart AnalysisInterarch Building Solution Ltd recently broke above a well-defined resistance zone around ₹2,400 after consolidating for several weeks.
The breakout candle is supported by noticeable volume, which validates the move and makes it a strong case study for breakout learners.
What can we learn here:
Breakouts are more reliable on higher timeframes like weekly charts.
Volume expansion often precedes sustained momentum.
Patience during consolidation phases pays off when structure confirms breakout.
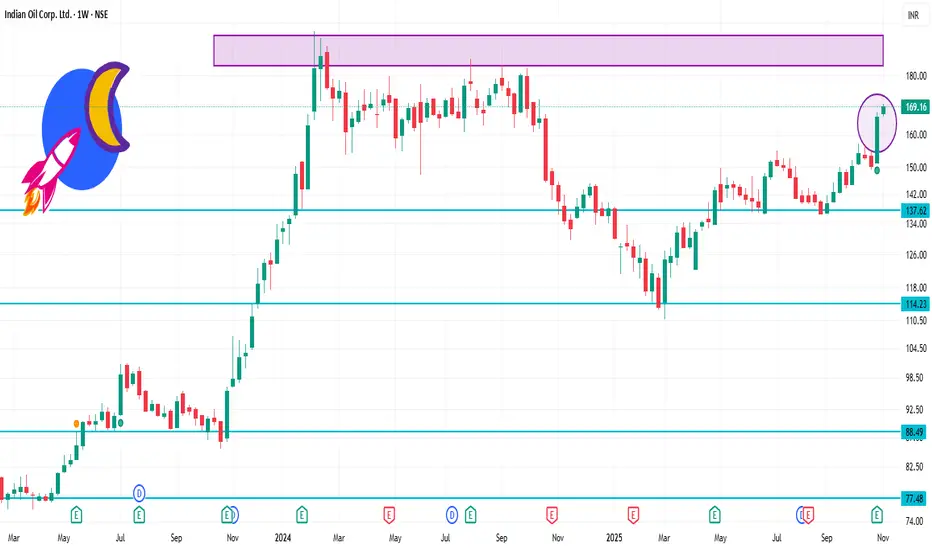
IOC 1 Week Time Frame 📌 Current Price Snapshot
The stock is trading around ₹ 167.97 on the NSE.
One technical commentary shows support in the ₹ 164-166 range, resistance in the ₹ 170-172 range.
✅ My Base-Case for This Week
Given the current price around ₹ 168 and the above levels:
a) The stock may oscillate between ₹ 164 (support) and ₹ 172 (resistance) this week.
b) If it holds above ₹ 166 and crosses above ~₹ 170 with strength, then the ~₹ 172 level is the immediate target.
c) If it fails to hold ~₹ 164, then a pull-back toward ~₹ 160-162 is possible.
Sharing my Secret Trading Mindset with Price actionIn this 18 minute video I will try to change the way you trade by sharing my trading experience using charts older than 3 months .

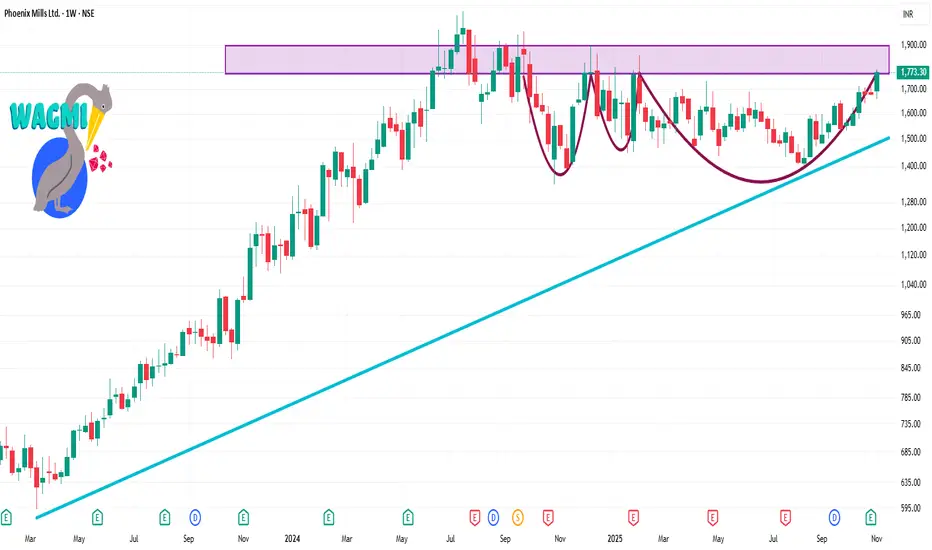
PHOENIXLTD 1 Week Time Frame ✅ Current Context
The stock is trading around ~ ₹1,750 – ₹1,770 region.
Technical indicators show mixed signals: daily SMAs are around ₹1,575-₹1,600, meaning price is above medium-term averages.
Momentum indicators: some overbought signals present; trend strength moderate.
🔍 My Derived Key Levels (for next 1-2 weeks)
Given current price and the above pivots, useful levels to watch:
Near-term support: ~ ₹1,700 – ₹1,730 (psychological + price above SMA)
First major support: ~ ₹1,470 – ₹1,500 zone (around S1)
Immediate resistance: ~ ₹1,800 – ₹1,820
Stretch target / higher resistance: ~ ₹1,640 + zone (~R2) if a pull-back happens and this acts as resistance on any retracement
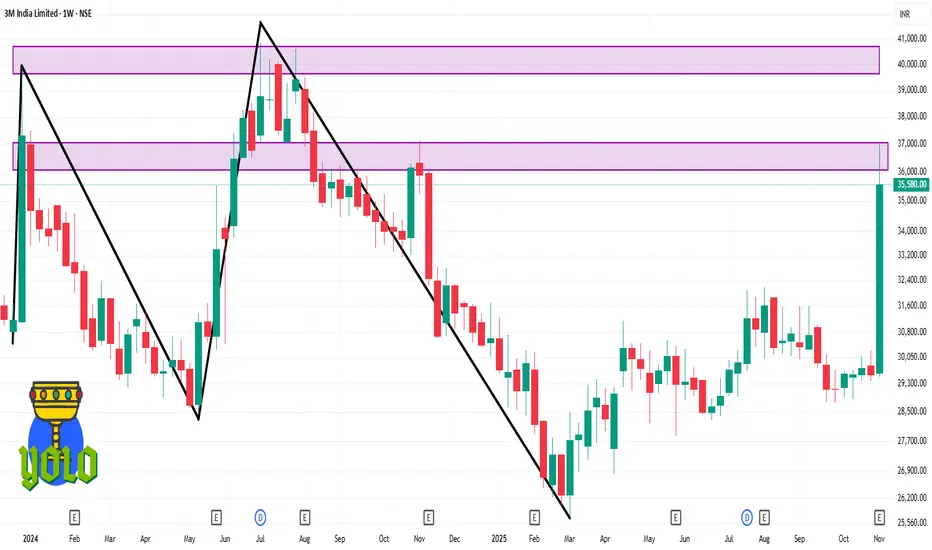
3MINDIA 1 Week Time Frame 📊 1-Week Performance
The stock moved up by ~ +20.37% over the past week.
The current share price is around ₹35,580 (as of 7 Nov 2025) with a small recent pull-back of -0.59%.
It is trading nearer to its 52-week high (~₹37,000) with its 52-week low being ~₹25,718.
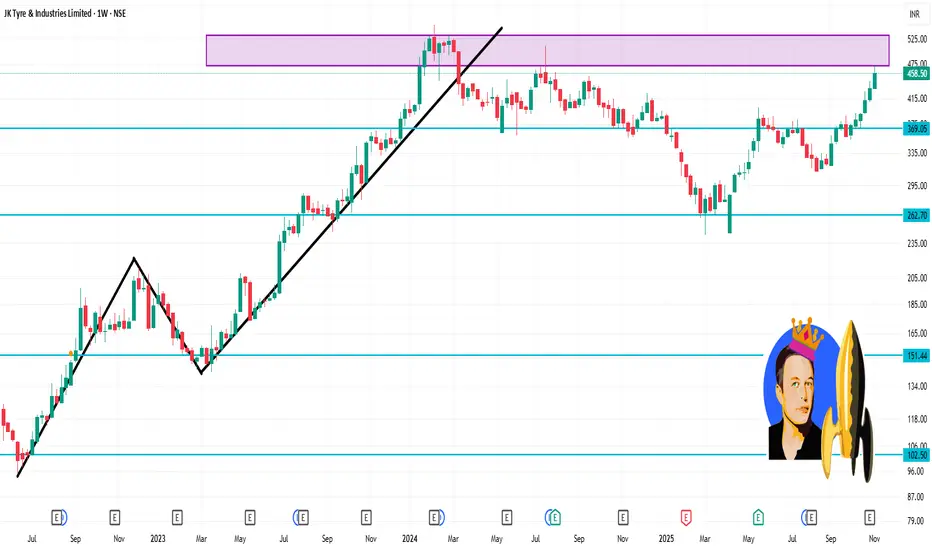
JKTYRE 1 Week Time Frame 🧮 Key support & resistance levels for the week ahead
Based on pivot/fibonacci calculations and support/resistance studies:
Resistance levels
~ ₹466 – primary resistance in the immediate zone.
Further resistance ~ ₹474-₹486 zone.
Support levels
First support: ~ ₹446-₹454 region.
Lower support (if deeper pull-back): ~ ₹408-₹390 range.
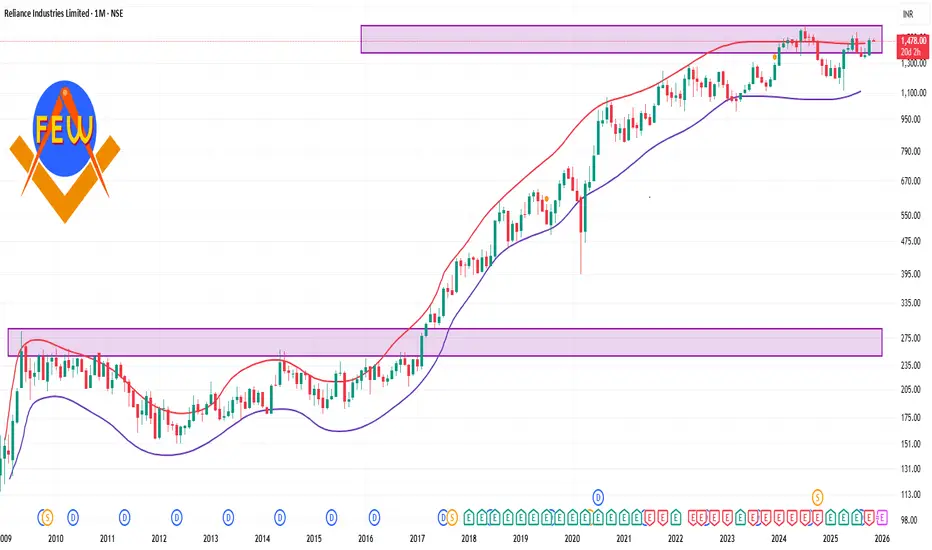
Reliance 1 Month Time Frame ✅ What we know
RIL’s current price is around ₹1,478 per share.
Over the past month, the stock has had a positive return according to some sources: ~ +5–8 %.
Recent support/resistance behaviour: In late Oct/early Nov the stock was fluctuating in the ~₹1,480-₹1,500 range.
The 52-week high is ~₹1,551, and the 52-week low ~₹1,114.85.
LiamTrading – XAUUSD D1 | Scenario for Week 2 of NovemberLiamTrading – XAUUSD D1 | Scenario for Week 2 of November
Accumulation range 4047–3928, prioritise buying on breakout – watch for short at 4200 (FVG + Fib 0.382)
Overview: After the correction from the historical peak, gold is forming a bottom – accumulating in the price box 4047–3928. The D1 structure still leans towards a medium-term uptrend if the price holds above 3928; the ~4200 area coincides with a broad FVG + Fib 0.382, a “liquidity pool” prone to strong reactions.
Macro Summary
Hedging flows against public debt/deficit risks and net buying demand from some central banks/Asian bloc support the long-term trend.
Expectations of a cooling interest rate path in 2026 help ease pressure on gold, but pullbacks may still occur before major technical milestones.
Technical Analysis (D1 Frame – Trendline | S/R | Volume zone | Fibonacci)
Accumulation Range: 4047 (top of the box) ↔️ 3928 (bottom of the box). D1 closing above 4047 confirms an upper range expansion; breaking 3928 triggers a deeper decline to lower Fib levels.
Fibonacci of the most recent up wave:
The price is oscillating around 0.618 → tendency to form a base.
Deeper area if the base breaks: 0.5 ~ 3850 and 0.382 ~ 3710.
Key resistance: 4090–4120 (mid-box area), ~4200 (FVG + Fib 0.382) – expected large liquidity/short-term reversal zone.
Important support: 3990–4010 (psychological/trading cushion), 3928 (lower range – breakout mark).
Trendline: The medium-term uptrend line remains intact if corrections do not close below 3928.
Trading Scenario for the New Week
Scenario 1 – Buy with the trend on upper range breakout
Condition: D1 closes above 4047, retest holds firm at 4038–4047.
Entry: 4048–4055
SL: 4018
TP: 4090 → 4120 → 4185–4205 (FVG + Fib 0.382)
Management: Take partial profit at 4090/4120, move SL to breakeven at +1R.
Scenario 1b – Buy at the box bottom (fade range)
Entry: 3935–3945 (when there is a rejection candle/clear buying tail at 3928–3945)
SL: 3895
TP: 3995–4010 → 4040–4047
Note: If D1 closes below 3928, cancel the plan and switch bias to a bearish scenario.
Scenario 2 – Short reaction at the 4200 liquidity zone
Entry: 4185–4205 (FVG + Fib 0.382) when clear rejection appears on D1/H4
SL: 4225
TP: 4120 → 4047 → 4010 (extended target: 3850 if there is a breakdown signal)
Note: Counter-trend order; reduce volume, exit quickly if D1 closes above 4205.
Risk & Invalidation
The medium-term bullish bias remains valid as long as D1 does not close below 3928.
D1 closing below 3928 opens the path to 3850 (Fib 0.5), even 3710 (Fib 0.382).
Strong news (CPI, employment, central bank speeches) can disrupt signals; wait for candle closure according to the chosen frame.
Summary
Gold is “spring-loaded” within 4047–3928. Priority plan: Buy on breakout–hold 4047 to aim for 4090–4120 and test ~4200; simultaneously watch for short reaction at 4200. If 3928 breaks, switch scenario to decline towards 3850 → 3710.

XAUUSD – H4 PERSPECTIVE: WAIT FOR LIQUIDITY TEST BEFORE DEEP...💛 XAUUSD – H4 PERSPECTIVE: WAIT FOR LIQUIDITY TEST BEFORE DEEP DECLINE 🎯
🌤 1. Overview
Hello everyone 💬
Gold just ended the week with a candle closing at the 4001 region, after a slight rise and then holding steady in the upward channel on the H4 frame.
The current sideways movement is making it difficult for many traders to find short-term entry points.
However, the 4090 area still has an unfilled liquidity gap (FVG), which coincides with the upper edge of the price channel. This could be the next short-term destination before the market adjusts for a deeper decline.
From my perspective, gold might rise another leg to sweep the liquidity in the upper region, then adjust back to the 3785 area – an important Fibonacci Retracement zone, where a strong reaction from buyers is highly likely.
💹 2. Technical Analysis
📈 The price structure is still maintaining an upward trend within the H4 price channel, with each subsequent low being higher than the previous one.
🟣 The 4090–4102 area is a liquidity region yet to be swept, located at the channel's peak – a high probability of a downward reaction.
🔹 The potential Buy zone around 3785–3789 coincides with Fibonacci 0.618 and a strong historical support area.
💫 Main scenario: Price might test the upper liquidity region, then adjust down to the Buy Zone before forming a larger upward momentum.
🎯 3. Reference Trading Plan
💢 SELL scenario (short-term)
Entry: 4098–4102 | SL: 4112
TP: 4078 – 4025 – 3998 – 3920 – 3875 – 3785
💖 BUY scenario (long-term strategy)
Entry: 3785–3789 | SL: 3777
TP: 3810 – 3865 – 3925 – 3988
⚠️ 4. Important Notes
Prioritize short-term Sell if there is a strong reaction at the 4090–4100 region.
Long-term Buy only if the price adjusts deeply to the 3785–3790 region.
Limit emotional trading – this is a liquidity accumulation phase before major volatility.
🌷 5. Conclusion & Interaction with LanaM2
Gold is following the accumulation path before forming a major wave 💛
Be patient and observe reactions at the two critical regions 4090 and 3785, as these could be the pivot points for the coming week.

$NEAR Ready for a Massive Breakout: Next Stop $20+ Incoming CRYPTOCAP:NEAR Ready for a Massive Breakout: Next Stop $20+ Incoming
The chart structure looks absolutely explosive right now! $NEAR/USDT has bounced hard from the triangle support, confirming strength and signaling that a massive rally is brewing.
I’ve been accumulating heavy in the $2.50 - $1.90 zone, expecting a big breakout rally ahead!
Targets: $7.70 / $16.70 / $30 / $50
If CRYPTOCAP:NEAR can smash through the $5 resistance, get ready for a vertical flight toward $20+, with long-term eyes on $50
Why I’m ultra-bullish:
✅ Strong recovery from key support zone
✅ Bullish triangle breakout structure
✅ Volume uptick showing accumulation
✅ Momentum shifting rapidly toward bulls
Chart invalidation below $1.50, but above that, it’s looking unstoppable. NFA & DYOR

XAUUSD – AWAITING CONFIRMATION OF UPTREND – TARGET 4050💛 XAUUSD – AWAITING CONFIRMATION OF UPTREND – TARGET 4050 🎯
🌤 1. Overview
Hello everyone 💬
Gold today remains in a phase of indecision – waiting for signals to confirm a new trend.
On the H2 chart, the price has broken the downtrend line and is retesting this line. The structure of “higher lows” indicates that buying pressure is gradually gaining dominance.
The previous peak around 4018 is currently the decisive point for the trend – if the price confirms a breakout above, the upward momentum may extend towards the 4050 area.
Currently, the market is fluctuating within the range of 3964 – 4018, and needs to break out of this zone to determine a clearer direction.
💹 2. ICT Perspective
📈 The price has broken the downtrend line and retested the structure on the H2 chart – an early signal for the potential formation of an uptrend.
🟣 The area 3964–4018 is a short-term liquidity accumulation zone before the price expands.
🔹 OB 4040–4042 coincides with significant resistance, suitable for short sell orders (scalp) if there is a strong reaction.
💫 When the price surpasses 4018, the upward structure will be confirmed and the expansion target may aim towards 4050 – 4077.
🎯 3. Reference Trading Plan
💖 BUY scenario (priority when confirmed)
Entry: above 4018 | SL: 4011
TP: 4025 – 4033 – 4050 – 4077
💢 Short SELL scenario (scalping)
Entry: 4040–4042 | SL: 4046
TP: 4022 – 4015 – 3998
⚠️ 4. Important Notes
Clear confirmation is needed when breaking the 4018 zone before entering a buy order.
If the price continues to fluctuate within the 3964–4018 range, trading should be limited.
Today is Friday, manage risk more tightly, prioritise accuracy in each order.
🌷 5. Conclusion & Interaction with LanaM2
Gold is showing positive signals 💛
Be patient and wait for reactions around the 4018 zone – this could be the start of a new uptrend if clearly confirmed.

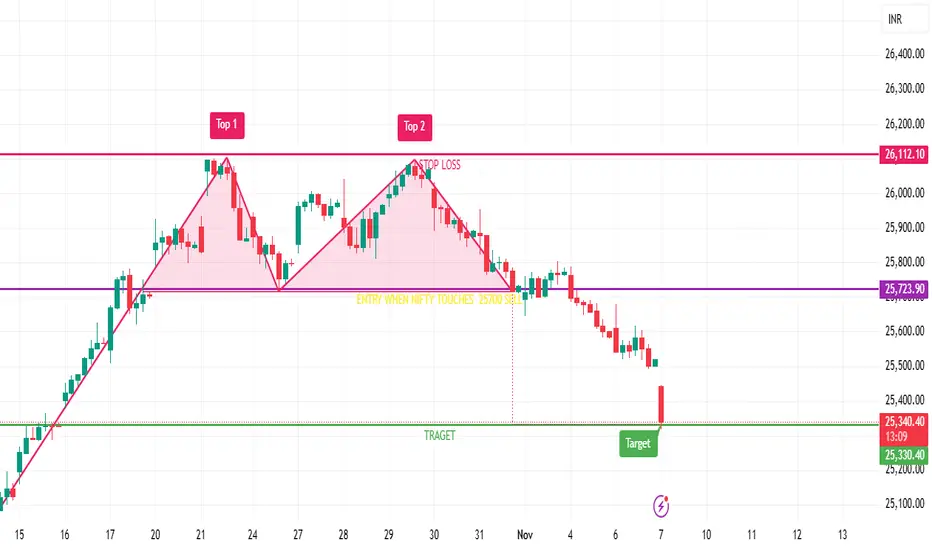
Nifty 1-Hour Chart – Double Top PatternThe trade has successfully reached the target levels.
🔹 Trade Recap
*Entry:** Sell near 25,700
Stop Loss:** 26,100
Target: 25,320 ✅ *Achieved*
🔹 Update
The double top breakdown played out as expected, and Nifty slipped toward the 25,300 zone after breaching the neckline near 25,700.
Traders are advised to **book profits** at current levels and **close short positions** as the target has been met.
Further direction will depend on whether Nifty sustains below 25,300 or shows signs of consolidation and reversal.
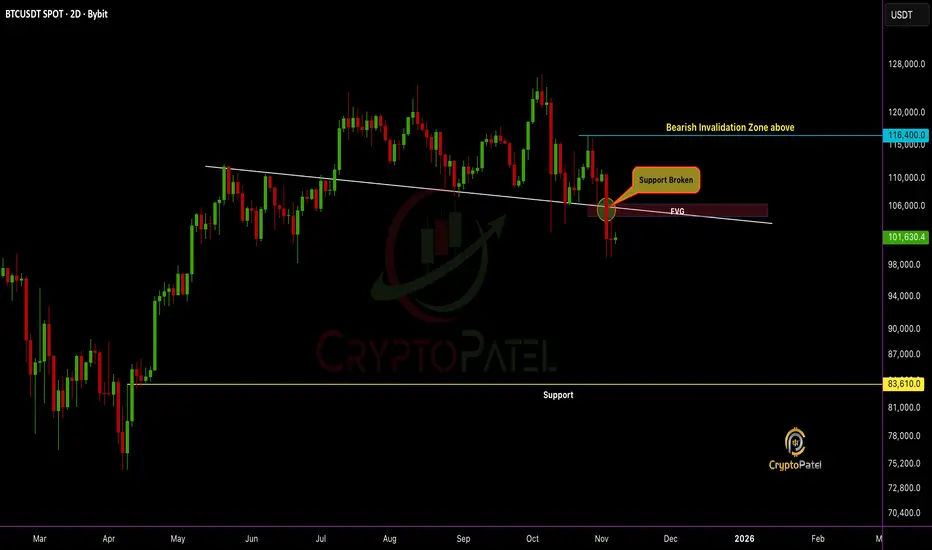
BTC Breakdown Confirmed, Structure Flipped Bearish: Next $88610?BTC Breakdown Confirmed, Structure Flipped Bearish: Next Stop $83,610?
Support is broken and the structure confirms a clear bearish shift.
#Bitcoin failed to reclaim the Fair Value Gap (FVG) zone, turning it into strong resistance.
High chances CRYPTOCAP:BTC could fill the FVG and continue the downside move toward $83,610.
Bulls remain trapped unless price reclaims $116,400, the bearish invalidation zone.
Trend bias remains bearish. Liquidity targets below are in play.
NFa & DYOR
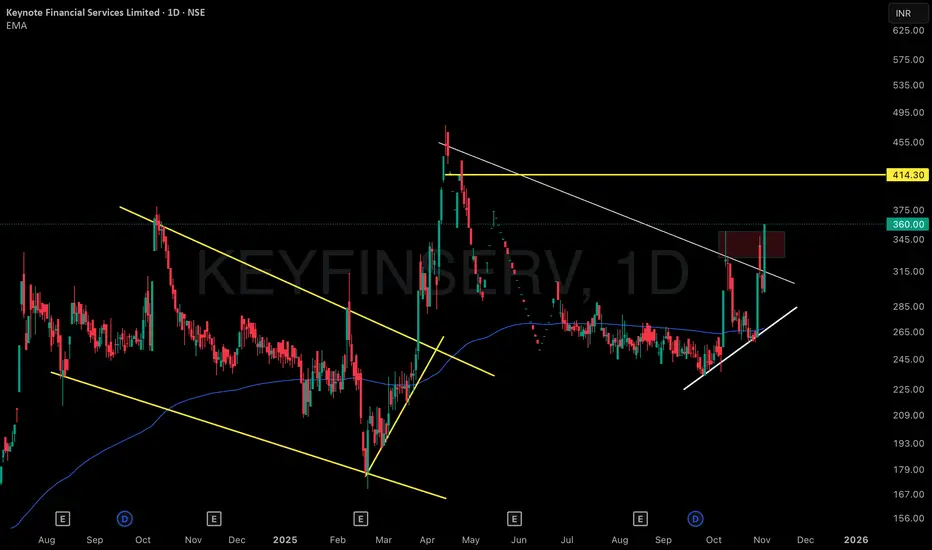
VCP Formation within Symmetrical Triangle above 200 EMAThis chart displays a Volatility Contraction Pattern (VCP) developing within a classic symmetrical triangle on the daily timeframe. Two sharply converging trendlines encapsulate the price action with the lower line connecting a series of higher lows (the trendline) and the upper line linking lower highs (counter trendline). Such convergence is characteristic of symmetrical triangles, which represent a period of price consolidation and equilibrium between buyers and sellers.
Volume tends to contract as the pattern matures, signaling market indecision and reduced volatility. Notably, this consolidation is taking place right around the 200-day moving average, which serves as an important reference point for longer-term market participants. The convergence of price and volume patterns here aligns with textbook VCP behaviour and highlights the potential for significant crowd psychology shifts.
This post’s intent is observational and educational, focusing on the visual behavior of price and volume embedded within technical patterns. Studying such symmetries can strengthen understanding of market structure and technical analysis skills, allowing for systematic review rather than speculative outlooks or trade signals.
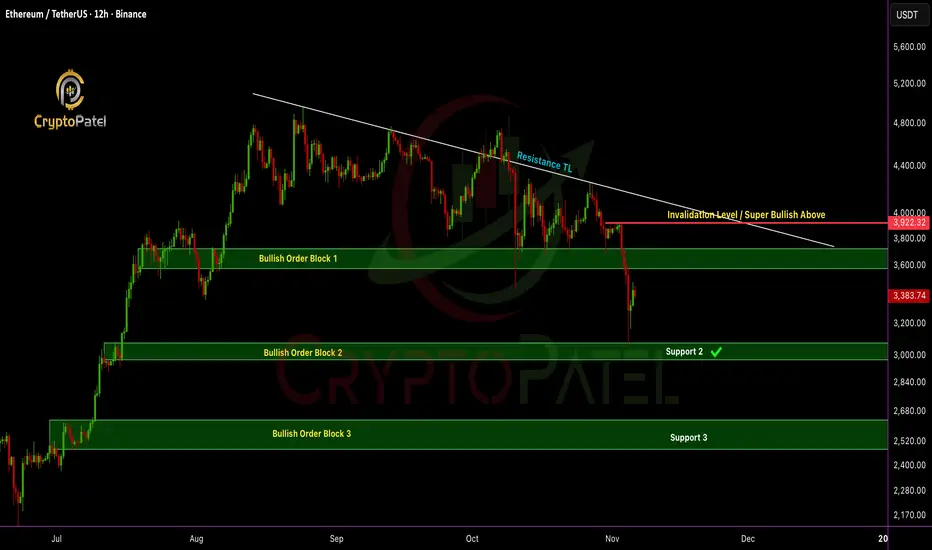
ETH/USDT dumped 20% after my analysisETHEREUM Update: Price just hit the bullish order block at $3,057 and bounced exactly as predicted ✅
Quick recap:
✅ Short-term: I’m bearish below $3,920, next potential leg down $2,500–$2,200 if $3,000 support breaks.
✅ Medium-term: Holding $3,000 support is key, could spark the next bullish wave.
✅ Long-term: Still super bullish & Target remains $10K–$15K ETH
Paper hands panic. Legends load the blood & hold.
Which one are you? 👇
NFA & DYOR
XAUUSD – INTRADAY BULLISH SCENARIO – TARGET 4050💛 XAUUSD – INTRADAY BULLISH SCENARIO – TARGET 4050 🎯
🌤 1. Overview
Hello everyone 💬
Although the larger timeframe for gold still leans towards a bearish trend, today in the short term, I prioritise a bullish scenario.
On the M30 timeframe, the price structure is gradually increasing, indicating that short-term capital is shifting to the buying side.
Zone 3990 is a very important area – where a Break of Structure (BOS) has just appeared and is also a strong resistance that has reacted multiple times before.
Price needs to confirm breaking this zone to continue expanding the bullish trend.
💹 2. Technical Analysis (ICT Perspective)
📈 An ascending structure (BOS) has formed on M30.
🟣 Buy Zone 3977–3979 coincides with the support trendline – a beautiful confluence point for buyers.
🔹 Resistance zone 3990–4000 is the area to confirm the main direction.
💫 Higher target: Fibonacci Extension 1.618 around 4049–4050, coinciding with the psychological resistance 4050.
🎯 3. Trading Plan Reference
💖 MAIN BUY (priority)
Entry: 3977–3979 | SL: 3970
TP: 3988 – 4000 – 4022 – 4040 – 4050
💢 SHORT SELL (when price reacts strongly at resistance)
Entry: 4012–4014 | SL: 4020
TP: 4002 – 3988 – 3965
⚠️ 4. Important Notes
Price needs to confirm through zone 3990 to reinforce the bullish trend.
If it breaks below 3970, the ascending structure is temporarily invalidated.
Today, prioritise buying according to the capital flow, sell only when there is a clear signal at the resistance zone.
🌷 5. Conclusion & Interaction with LanaM2
Gold is showing positive signals 💛
Patiently wait for reactions at the Buy Zone 3977–3979, this could be the starting point for a new upward move towards 4050.
This is not investment advice, just a personal perspective according to the ICT method.
If you find it useful, please 💛 like – 💬 comment – 🔔 follow LanaM2 to update gold analysis with me every day ✨

Recurring VCP Structures: Multi-Phase Consolidation & Expansion1 . This chart distinctly showcases a series of visually captivating Volatility Contraction Patterns (VCPs) across multiple phases, elegantly demarcated by yellow trendlines that map out both historical and present consolidation zones. Each contraction zone is marked by repeated, precise touches on trend boundaries, reflecting steady accumulation followed by eruptive volatility and sharp price expansions—almost like a pattern “echo” cycling through the chart.
2 . The highlighted VCP structures reveal not just one, but several contraction-and-expansion cycles, creating an intricate tapestry of market behaviour. Note how each phase includes a concentrated period of sideways price movement, where activity compresses before unleashing swift, directional breakouts. The interplay of these phases turns the chart into a textbook reference for sequential VCP observation, with periods of quiet consolidation—almost like calm before a storm—setting the stage for pronounced volatility bursts.
3 . Recent activity amplifies this effect: vivid volatility swings transition rapidly into tight consolidation, echoing earlier pattern cycles and further emphasizing the recurring structural nature. These technical formations, combined with strong boundary touches and clear momentum surges, make the chart an excellent study in pattern recognition, volatility monitoring, and visual market structure analysis—all shared purely for observational insight, with no predictions or directional bias.