Difference btw Beginner, Pro and Full time Traders ( Mtfa view )In this Big 20 minutes video, I will try to explain the most beautfull conept of Multi time frame analysis from the perspective of 4 different types of trader .
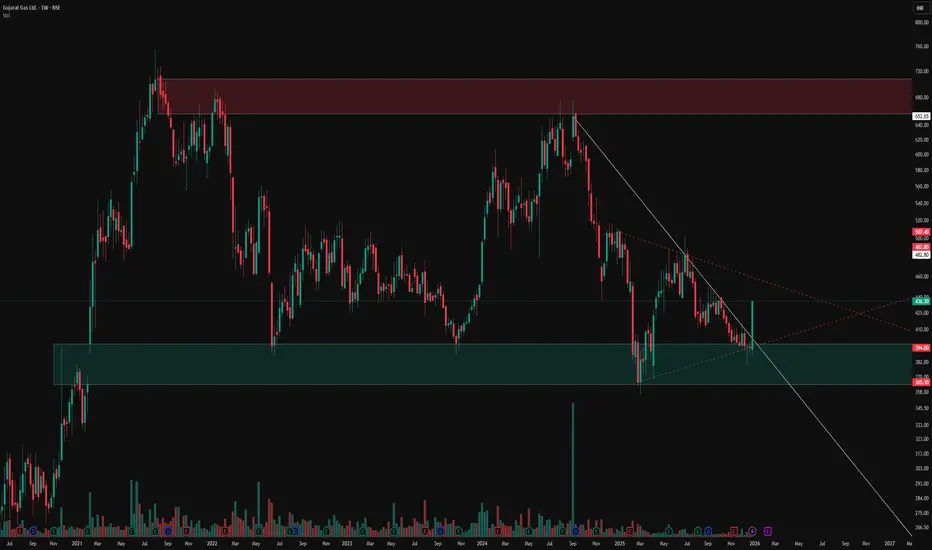
Charts used are older than 3 months
Trading

Part 3 Introduction to Institutional TradingIncome Through Option Selling
Short straddles, strangles, and spreads are used to make weekly or monthly income.
This is one of the most stable use cases of options.
Option selling works because:
Time decay benefits the seller
Most price action remains range-bound
Sellers use probability-based models
Institutions have been doing this for decades. Today, retail traders also follow similar approaches on indices.

XAUUSD H1 - Liquidity reaction post-geopolitical spikeGold surged strongly at the start of the week as escalating geopolitical tensions boosted safe-haven demand, while expectations of further Fed rate cuts continued to support the broader bullish narrative. From a technical perspective, price is now reacting around key liquidity and Fibonacci zones rather than trending impulsively.
TECHNICAL OVERVIEW
On H1, gold experienced a sharp sell-off followed by a recovery, forming a V-shaped reaction that suggests aggressive liquidity clearing.
Price is currently trading below prior breakdown zones, indicating that supply remains active at higher levels.
The market structure favors selling on rallies in the short term, while deeper pullbacks may attract fresh buyers.
KEY LEVELS & MARKET BEHAVIOR
Upper sell zones (supply & Fibonacci confluence):
4497 – 4500 (FVG sell zone, premium area)
4431 – 4435 (Fibonacci + former support turned resistance)
These zones represent areas where sellers previously stepped in aggressively, making them important reaction levels if price rebounds.
Lower buy-side liquidity:
4345 – 4350 (Value Low / buy-side liquidity zone)
This area aligns with trendline support and prior accumulation, making it a key level to monitor for a bullish reaction if price rotates lower.
EXPECTED PRICE FLOW
Short term: price may continue to consolidate and rotate between resistance and liquidity below, with choppy price action likely.
A rejection from the upper resistance zones could lead to another leg lower toward buy-side liquidity.
If buy-side liquidity is absorbed and defended, the market may attempt another recovery move.
FUNDAMENTAL CONTEXT
Gold’s strength is underpinned by two major factors:
Rising geopolitical risk, which increases demand for safe-haven assets.
Dovish expectations from the Federal Reserve, as markets continue to price in additional rate cuts, reducing the opportunity cost of holding non-yielding assets like gold.
These fundamentals support gold on higher timeframes, even as short-term technical corrections play out.
BIG PICTURE VIEW
Medium-term bias remains constructive due to macro and geopolitical support.
Short-term price action is driven by liquidity and reaction zones rather than trend continuation.
Patience is key—allow price to interact with major levels before committing to the next directional move.
Let the market show its hand at liquidity.

XAUUSD (H2) – Buying priority todayGold holds above 4,400 on safe-haven flows | Trade liquidity, don’t chase
Quick summary
Gold started the week with strong momentum and pushed above 4,400 during the Asian session as global markets rotated into safe-haven assets. Geopolitical risk is the key driver after reports of US ground strikes in Venezuela and the detention of President Nicolás Maduro and his wife. With that backdrop, my plan today is simple: prioritize BUY setups at liquidity zones, and avoid FOMO while the price is elevated.
1) Macro context: Why gold is supported
When geopolitical risk escalates, capital typically flows into gold.
Headline-driven sessions often bring:
✅ fast pumps, ✅ liquidity sweeps, ✅ larger wicks/spreads.
➡️ The safest execution is waiting for pullbacks into predefined buy zones, not chasing highs.
2) Technical view (based on your chart)
On H2, gold has bounced sharply and your chart highlights clear execution areas:
Key levels for today
✅ Buy zone: 4340 – 4345 (trend/structure pullback zone)
✅ Strong Liquidity: lower support band (marked on chart)
✅ Sell zone: 4436 – 4440 (near-term supply / reaction area)
✅ Sell swing / target: 4515 – 4520 (higher objective / profit-taking zone)
3) Trading plan (Liam style: trade the level)
Scenario A (priority): BUY the pullback into 4340–4345
✅ Buy: 4340 – 4345
SL (guide): below the zone (adjust to spread / lower TF structure)
TP1: 4400 – 4410
TP2: 4436 – 4440
TP3: 4515 – 4520 (if momentum continues with headlines)
Logic: 4340–4345 offers a cleaner R:R than chasing above 4,400.
Scenario B: If the price holds above 4,400 and only dips lightly
Look for a buy only on clear holding signals near the closest support/strong liquidity (M15–H1).
Still not recommending FOMO entries in headline volatility.
Scenario C: SELL reaction (scalp) at supply
✅ If price tags 4436–4440 and shows weakness:
Sell scalp: 4436 – 4440
SL: above the zone
TP: back toward 4400–4380
Logic: This is a near-term supply area — good for quick profit-taking, not a long-term reversal call.
4) Notes (avoid getting swept)
The Asian session can spike hard on headlines → wait for pullback confirmations.
Reduce size if spreads widen.
Only execute when price hits the level and prints a clear reaction (rejection / engulf / MSS).
What’s your plan today: buying the 4340–4345 pullback, or waiting for price to push into 4515–4520 before reassessing?

Hidden Parallel Channel: Weighted Lines & Zones ExposedThis chart illustrates key technical elements where price interacts with multiple reference lines and zones, emphasizing their observed relevance based on proximity and historical behavior.
The red counter trend line, distant from price by 35-40%, carries less immediate weight, while the white counter trend line touched by price demonstrates stronger participation. Green highlights a long-term weekly demand zone from historical levels, and the white zone on daily timeframe marks a prior gap down with resistance reaction.
Parallel dotted white lines outline a hidden channel, repeatedly respected and rejected by price, underscoring its structural significance. These elements combine multi-timeframe context to showcase how markets organize around dynamic references rather than static predictions.
Motto is to showcase how one can create setup from any or all of the above ingredients, its all about perspective and how you approach and backtest in markets - experience is importnat - field experience in trading is scrolling Trading view and keep backtesting .
Disclaimer: This is purely educational content on price action, zones, and patterns. Not SEBI-registered advice. Charts use historical data >3 months old; NO forecasts, NO buy/sell recommendations, or guarantees of results. DYOR and consult professionals.

Part 1 Master Candle Stick Patterns Risks in Option Trading
Options require deep understanding. Some risks include:
A. Time Decay (Theta)
Option value reduces every day.
B. Volatility Crush
Premium falls rapidly when volatility decreases (common after events).
C. Low Liquidity
Wider bid–ask spreads can increase trading cost.
D. Large Losses for Sellers
Shorting options without hedges can be very risky.
E. Emotional Trading
High leverage leads to overtrading.

Part 1 Support and ResistanceHow Option Premium Works
When you buy an option, you pay a premium.
When you sell an option, you receive it.
The premium is influenced by:
i. Intrinsic Value
The real value if exercised now.
For Calls: Max(0, Spot – Strike)
For Puts: Max(0, Strike – Spot)
ii. Time Value
The extra value based on how much time is left before expiry.
More time → more value.
Closer to expiry → less value.
iii. Volatility
Higher volatility increases option premiums because prices may move dramatically.
iv. Interest Rates & Dividends
These impact pricing but are secondary for most intraday/swing traders.
Option pricing is usually calculated using models like Black-Scholes, but traders mainly use practical observation.

XAUUSD (H1) – Inverse Head & Shoulders formingLana focuses on pullback buys above key liquidity 💛
Quick overview
Timeframe: H1
Pattern: Inverse Head & Shoulders confirmed on the chart
Bias: Bullish continuation while price holds above neckline
Strategy: Buy pullbacks into liquidity zones, avoid chasing highs
Technical view – Inverse Head & Shoulders
On H1, gold has completed a clean Inverse Head & Shoulders structure:
Left shoulder: Formed after the first sharp sell-off
Head: Deeper liquidity sweep, followed by strong rejection
Right shoulder: Higher low, showing weakening selling pressure
Neckline: Around the 4030–4040 resistance zone (now being tested)
The recent breakout and strong follow-through suggest buyers have regained control. As long as price holds above the neckline, the structure favors continuation to the upside.
Key levels Lana is watching
Primary buy zone – Pullback entry
Buy: 4363 – 4367
This area aligns with prior structure support and sits inside a healthy pullback zone. If price revisits and shows acceptance, it offers a good risk-to-reward buy.
Liquidity risk zone – Deeper pullback
Liquidity risk: 4333 – 4349
If volatility increases and price sweeps deeper liquidity, this zone becomes the secondary area to watch for bullish absorption.
Upside targets & resistance
High liquidity area: 4512 – 4517
ATH zone: Above the previous all-time high
These zones are expected to attract profit-taking or short-term reactions, so Lana avoids chasing price near these levels.
Fundamental context (market drivers)
Geopolitics: Rising tension after comments about potential military intervention in Colombia adds background support for gold as a safe haven.
Goldman Sachs: Views Venezuela-related developments as having limited impact on oil, keeping broader commodity sentiment stable.
ISM Manufacturing PMI (US): Any sign of slowing manufacturing can pressure USD and indirectly support gold.
Overall, fundamentals remain supportive for gold, reinforcing the bullish technical structure.
Trading plan (Lana’s approach)
Prefer buying pullbacks into 4363–4367 while structure holds.
Be patient if price dips into 4333–4349 and wait for confirmation before entering.
If price falls back below the neckline and fails to reclaim it, Lana steps aside and reassesses.
This is Lana’s personal market view and not financial advice. Please manage your own risk before trading. 💛

Unveiling Hidden Symmetrical Triangle and Saving from FakeoutsThis weekly chart post highlights key price action elements in a sideways pattern, focusing on zones, trendlines, and a subtle symmetrical triangle for educational observation. Green demand zones and red supply zones frame the overall range, while the white counter trend line traces internal fluctuations. The dotted red line uncovers a hidden symmetrical triangle, where converging lines often lead to breakout rejections observed as fakeouts
Key Chart Features
-Demand & Supply Zones: Green areas mark demand support, red zones indicate supply resistance, revealing price reactions within the sideways structure.
-Counter Trend Line: White line connects minor highs and lows, illustrating counter-trend swings that define the internal rhythm amid broader consolidation.
-Hidden Symmetrical Triangle: Dotted red outline exposes the converging pattern, a consolidation coil with balanced higher lows and lower highs, frequently trapping breakout attempts.
Disclaimer: Not a SEBI-registered advisor. This is purely educational on price dynamics, supply-demand, trendlines, and hidden patterns—no investment advice or forecasts. Past patterns do not guarantee future results; conduct your own analysis.
Gold Rewards Timing, Not Activity🟡 Gold Rewards Timing, Not Activity ⏳✨
Gold is not a market that rewards constant action.
It rewards waiting, observation, and precise timing.
Many traders believe that trading more means earning more. In Gold, this mindset often leads to overtrading, emotional decisions, and unnecessary losses.
⏱️ 1. Gold Moves in Phases, Not Constant Trends
Gold spends a large amount of time in:
consolidation 🔄
slow accumulation 🧩
controlled ranges 📦
During these phases, price appears “boring,” but the market is actually preparing.
Trading aggressively in these conditions usually means trading noise, not opportunity.
🧠 2. Activity Feeds Emotions, Timing Controls Risk
High activity leads to:
impatience 😤
forced entries 🎯
emotional exits ❌
Good timing, on the other hand, comes from:
understanding context 🧭
waiting for price to show intent 📊
acting only when conditions align ✅
Gold punishes impatience faster than most markets.
🏦 3. Institutions Trade Less, But Trade Better
Large players do not chase every candle.
They wait for:
liquidity to build 💧
weak hands to exit 🧹
price to reach meaningful zones 📍
When timing is right, Gold often moves fast and decisively — leaving overactive traders behind.
⚡ 4. Big Gold Moves Come After Quiet Periods
Some of the strongest Gold expansions begin after:
low volatility 😴
reduced participation 📉
trader boredom 💤
This is why patience is not passive — it is strategic.
🧩 Key Insight
In Gold, doing less at the right time often outperforms doing more at the wrong time.
🎯 Final Takeaway
❌ More trades ≠ more profits
✅ Better timing = cleaner execution
🟡 Gold rewards discipline, context, and patience
Master timing, and activity will take care of itself.

XAUUSD (H4) – Monday StrategyGeopolitical shock risk, gold may spike | Trade liquidity and reaction zones only
Quick summary
News around Trump’s claim that Maduro has been detained, plus Venezuela’s response (they don’t know his and his wife’s whereabouts and are demanding proof of life), raises geopolitical uncertainty sharply. For gold, that’s a classic catalyst for a gap/spike at Monday open.
So my rule for Monday: no FOMO, only trade liquidity zones and confirmed reactions on the chart.
1) Macro context: Why gold can surge on Monday
Rising geopolitical tension often drives flows into safe-haven assets like gold.
When facts are unclear and tensions escalate, the market can open with:
✅ sharp spikes, ✅ liquidity sweeps, ✅ wider spreads.
➡️ Best approach: wait for price to hit levels, then trade the reaction — not the headline.
2) Technical view (H4 – based on your chart)
Gold is currently moving inside a larger structure after a heavy move, and your chart highlights the key zones clearly:
Key zones
Sell test support 4450 (pullback area where price may get sold)
Liquidity 4330 (major liquidity magnet)
OB 4309 (order block / short-term reaction zone)
Support 4277 (intermediate support)
Buy zone 4203–4206 (deep support / swing buy area)
3) Monday trading scenarios (Liam style: trade the level)
Scenario A (priority): Spike up → SELL around 4450
✅ If gold pumps on the headline at the open:
Sell around 4450 (sell-test zone)
SL: above the most recent swing high (refine on lower TF)
TP1: 4330
TP2: 4309
TP3: 4277
Logic: Headline-driven opens often spike to sweep buy-side liquidity first, then rotate back into value/liquidity.
Scenario B: Sweep down → BUY at liquidity zones
✅ If price gets pulled down first:
Buy around 4330 (Liquidity)
Buy confirmation at 4309 (OB)
SL (guide): below 4300
TP: 4380 → 4450 (scale out)
Logic: 4330 is a major liquidity magnet and often produces a sharp reaction bounce.
Scenario C (worst-case dump): BUY the deep support 4203–4206
✅ If volatility is extreme and price flushes:
Buy: 4203 – 4206
SL: 4195
TP: 4277 → 4330
Logic: This is a deep swing-buy area if the market does a hard liquidity reset.
4) Key notes for a headline-driven Monday open
Avoid trading the first 5–10 minutes if spreads widen.
Only enter once price hits the level and shows a clear reaction (rejection / engulf / MSS on M15).
Reduce size — geopolitical opens can whip hard.
Do you think Monday’s move sweeps up into 4450 first, or drops straight into 4330 liquidity?

Lets Backtest the High, New High Strategy on Monthly time frameHello everyone, My name is Apoorv ( Full time Trader )
I make educational content videos
Charts used in this video are 3 months or older

XAUUSD D1 – Liquidity Rotation in Bullish ChannelLiquidity Rotation Inside a Strong Bullish Channel
Gold remains in a clear long-term uptrend on the daily timeframe, trading inside a well-defined ascending channel. Recent volatility, however, suggests the market is entering a liquidity-driven correction phase rather than a trend reversal.
TECHNICAL STRUCTURE
On D1, price is still respecting the rising channel, with higher highs and higher lows intact.
The rejection from the upper channel highlights profit-taking and sell-side liquidity absorption near premium levels.
Current price action suggests a rotation between upper liquidity (distribution) and lower value zones (accumulation).
KEY LIQUIDITY ZONES TO WATCH
Sell-side liquidity (premium zone):
4480 – 4485
This area represents a strong liquidity cluster near the upper channel and prior expansion highs, where price has shown clear rejection.
Buy-side liquidity (value zones):
4180 – 4185
A psychological level and mid-channel support where buyers may re-enter if price rotates lower.
4000 – 4005
Major long-term liquidity and Fibonacci confluence near the lower channel boundary, acting as a key structural support.
EXPECTED PRICE BEHAVIOUR
Short term: price may continue to fluctuate and rebalance between liquidity pools, with choppy conditions likely.
Medium term: as long as price holds above the lower channel, pullbacks are considered corrective within the broader bullish trend.
A clean rejection from sell liquidity followed by a move into buy liquidity would be a healthy reset for continuation later.
FUNDAMENTAL & GEOPOLITICAL BACKDROP
Geopolitical risk has sharply increased after former President Trump announced a large-scale US operation against Venezuela, including the arrest of President Maduro. This event adds a new layer of uncertainty to global markets and reinforces safe-haven demand.
Historically, rising geopolitical tensions, combined with a softer US dollar environment, tend to support gold prices, especially on higher timeframes.
BIG PICTURE VIEW
Gold’s long-term bullish narrative remains intact
Current moves are driven by liquidity rotation, not weakness
Geopolitical risk could accelerate upside once the corrective phase completes
Patience remains key. Let price move between liquidity zones before committing to the next directional leg.

Part 10 Trade Like Institutiona Protective Put & Married Put
Protective Put
Hold stock
Buy put
Acts like insurance.
Married Put
Buy stock + Buy put simultaneously
Useful in high-risk environments.

BNB Price Forecast 2026 | Is $10K/BNB Possible? | Analysis By CPBNB has shown strong price action recently. After bouncing from the $500 support zone, price moved higher, broke the previous all-time high, and successfully cleared the $700 resistance, which is now acting as a strong support area.
Currently, BNB is consolidating around the $800 level, suggesting the market is digesting the recent move.
Technical Overview
Multi-year ascending trendline: Still intact, indicating long-term bullish structure.
Major support zone: $500–$800
This range has acted as an accumulation area during previous pullbacks.
Current structure: Sideways consolidation near $800 after a strong breakout.
Possible Scenarios
Bullish continuation:
If BNB holds above $800 and breaks higher with volume, continuation toward higher levels is possible.
Pullback scenario:
If price drops below $800, a retest of $700–$500 could occur. Historically, this zone has provided strong demand and may attract long-term buyers.
Long-Term Perspective (Cycle-Based)
Bull market target (speculative): Around $3,000
Macro cycle projections (high risk & speculative): $10,000–$20,000
These levels are not predictions, but potential zones based on historical cycles, trend strength, and broader market conditions.
Key Takeaway
The overall structure remains bullish as long as price stays above major support levels. Consolidations and pullbacks within an uptrend are normal and often help reset the market before the next move.
This is an educational analysis only. Not financial advice.
Always manage risk and do your own research (DYOR).

Controlling Trading Risk FactorsA Comprehensive Guide to Long-Term Survival in Financial Markets
Trading in financial markets offers significant opportunities for wealth creation, but it also exposes participants to substantial risks. The difference between consistent traders and those who exit the markets prematurely is not superior prediction, but effective control of trading risk factors. Risk is unavoidable in trading; however, it is manageable. Controlling trading risk factors means identifying, measuring, and mitigating the elements that can negatively impact capital, performance, and psychological stability. This process forms the foundation of professional trading and long-term sustainability.
Understanding Trading Risk
Trading risk refers to the probability of financial loss arising from market uncertainty, volatility, leverage, behavioral errors, and external events. Markets are influenced by countless variables—economic data, geopolitical developments, interest rates, liquidity flows, and investor sentiment. Since traders cannot control market outcomes, the focus must shift to controlling exposure and decision-making processes. Risk control is not about avoiding losses entirely, but about ensuring losses are limited, planned, and recoverable.
Position Sizing: The First Line of Defense
One of the most critical risk factors in trading is improper position sizing. Many traders fail not because their analysis is wrong, but because they risk too much on a single trade. Position sizing determines how much capital is allocated to each trade relative to the total account size. A disciplined approach—such as risking only 1–2% of total capital per trade—ensures that no single loss can significantly damage the account. Proper position sizing smooths the equity curve and allows traders to survive inevitable losing streaks.
Stop-Loss Discipline and Risk-Reward Management
Stop-loss orders are essential tools for controlling downside risk. They define the maximum acceptable loss before entering a trade, transforming uncertainty into a quantified risk. Traders who ignore stop-losses often allow small losses to turn into catastrophic ones. Alongside stop-loss placement, risk-reward ratio plays a vital role. Trades should be structured so that potential rewards outweigh risks, typically at least 1:2 or higher. Even with a modest win rate, favorable risk-reward dynamics can lead to profitability over time.
Managing Leverage Carefully
Leverage amplifies both gains and losses, making it one of the most dangerous risk factors in trading. Excessive leverage can wipe out accounts even with minor market moves. Professional traders treat leverage as a strategic tool, not a shortcut to fast profits. Controlling leverage means using it selectively, understanding margin requirements, and maintaining sufficient buffer to withstand volatility. Lower leverage provides emotional stability and prevents forced liquidations during adverse price movements.
Diversification and Correlation Awareness
Concentration risk arises when too much capital is allocated to highly correlated assets or similar strategies. Traders often believe they are diversified when they are not—for example, holding multiple stocks from the same sector or trades driven by the same macro factor. True diversification considers correlations across instruments, timeframes, and strategies. By spreading risk intelligently, traders reduce the impact of a single market event on overall performance.
Volatility and Market Condition Adaptation
Market volatility is not constant; it expands and contracts over time. Strategies that work well in trending markets may fail in range-bound or highly volatile conditions. Failing to adapt to changing market regimes is a major risk factor. Traders must adjust position sizes, stop distances, and expectations based on current volatility levels. Using tools such as Average True Range (ATR) or volatility indices can help align risk parameters with market conditions.
Psychological Risk and Emotional Control
Psychological factors are among the most underestimated trading risks. Fear, greed, overconfidence, and revenge trading often lead to impulsive decisions that violate risk rules. Emotional trading increases position sizes after losses, removes stop-losses, or leads to overtrading. Controlling psychological risk requires self-awareness, discipline, and routine. Maintaining a trading journal, following a predefined trading plan, and taking breaks after drawdowns are effective ways to reduce emotional interference.
Drawdown Management and Capital Preservation
Drawdowns are inevitable, but uncontrolled drawdowns can permanently impair trading capital. Effective risk control includes predefined drawdown limits, such as reducing position size after a certain percentage loss or pausing trading altogether. Capital preservation should always take priority over profit generation. Traders who protect capital during unfavorable periods are best positioned to capitalize when conditions improve.
Risk of Overtrading and Strategy Drift
Overtrading increases transaction costs, exposure, and emotional fatigue. Many traders feel compelled to trade constantly, mistaking activity for productivity. This behavior often leads to lower-quality setups and higher risk. Similarly, strategy drift—deviating from a proven system due to recent losses or market noise—introduces inconsistency. Strict trade filters and adherence to tested strategies help control these risks.
External and Event-Based Risks
Macroeconomic announcements, earnings releases, geopolitical tensions, and policy decisions can cause sudden price shocks. Ignoring event risk can result in slippage and gaps beyond stop-loss levels. Traders should be aware of economic calendars and adjust exposure ahead of high-impact events. Some choose to reduce position size or stay flat during major announcements, prioritizing risk control over opportunity.
The Role of a Trading Plan and Risk Framework
A well-defined trading plan is the backbone of risk management. It outlines entry criteria, exit rules, position sizing, maximum risk per trade, and drawdown limits. A consistent risk framework transforms trading from speculation into a structured business. Without a plan, risk decisions become reactive and emotionally driven, increasing the likelihood of large losses.
Conclusion
Controlling trading risk factors is not optional—it is the core skill that separates successful traders from unsuccessful ones. Markets are unpredictable, but risk exposure is controllable. By managing position size, leverage, stop-losses, psychological behavior, diversification, and drawdowns, traders create resilience against uncertainty. Long-term success in trading is less about finding the perfect strategy and more about surviving long enough for probabilities to work in your favor. In trading, those who control risk control their future.

XAUUSD (H2) – Liam Plan (Jan 02)Price is compressing in a structure, wait for the trendline break to choose direction 🎯
Quick summary
After the strong bearish BOS, gold is rebounding and compressing inside a diagonal structure (triangle/flag-like). Today the clean approach is confirmation trading:
SELL only after a confirmed break of the trendline (4348–4350) as marked on your chart.
SELL reactions at the upper supply / VAL zones (4460–4463 and 4513–4518).
BUY is secondary — only if price holds the 4400–4405 key support and shows a clear reaction on lower timeframes.
Macro backdrop (CME FedWatch)
Probability Fed holds rates in January: 85.1%
Probability of a 25 bps cut in January: 14.9%
By March: probability of 25 bps cumulative cut: 51.2%, hold 42.8%, 50 bps cut 5.9%
👉 This keeps markets sensitive to USD / yields expectations. Gold can bounce technically, but volatility spikes are likely — so we stick to levels + confirmation.
Key Levels (from your chart)
✅ Sell zone 1: 4513 – 4518
✅ Sell VAL: 4460 – 4463
✅ Reaction / flip zone: 4400 – 4405
✅ Breakdown trigger: 4348 – 4350 (sell upon confirmed trendline breakout)
Trading scenarios (Liam style: trade the level)
1) SELL scenarios (priority)
A. SELL on trendline breakdown confirmation
Trigger: clean break + close below 4348–4350
Entry: sell the retest back into the broken trendline
TP1: 4320–4305
TP2: 4260–4240
TP3: deeper extension (towards the 41xx area) if momentum expands
Logic: This is the clearest “trend confirmation” on your chart. No chasing — let price confirm first.
B. SELL reaction at supply
Sell: 4460–4463 (VAL)
Stronger sell: 4513–4518 (premium supply)
Only sell with visible weakness / rejection on M15–H1.
2) BUY scenario (secondary – reaction only)
Buy zone: 4400–4405
Condition: hold the zone + print higher lows on lower TF
TP: 4460 → 4513 (scale out)
Logic: This is a key support/flip area. If it holds, price can rotate up to test supply above before the next decision.
Key notes
Compression often creates false breaks — don’t trade mid-range.
Two clean plays only: break 4348–4350 to sell with confirmation, or retrace to 4460/4513 to sell the reaction.
What’s your bias today: selling the 4348 breakdown, or waiting for 4460–4463 for a cleaner pullback sell?

XAUUSD Pullback – Monitor Supply Before Next MoveMarket Context (Short-Term)
Gold has printed a strong bearish impulse, followed by a technical pullback phase. The current upside move is corrective in nature, driven by liquidity rebalancing, not a confirmed trend reversal.
Market Structure & Price Action
Short-term structure remains bearish with lower highs in place.
The ongoing recovery is a pullback within a bearish leg, not a new bullish trend.
No valid bullish break of structure has been confirmed on the intraday timeframe.
Key Technical Zones
Supply / Sell Reaction Zone: 4,401 – 4,462
→ Major distribution area. Expect selling pressure and potential bearish reaction.
Intermediate Resistance: 4,348 – 4,350
→ Current reaction zone where price may consolidate or fake-break before the next move.
Demand / Buy Zones:
4,322 – 4,326
4,285 – 4,290
→ Liquidity-rich demand areas where the pullback may complete.
Primary Scenario (MMF Bias)
Price continues to retrace into the 4,40x supply zone, shows rejection or bearish confirmation, then rotates lower toward the demand zones below.
Alternative Scenario
If price accepts above 4,401 with strong bullish displacement and clean structure, the pullback could extend toward the higher supply near 4,46x.
Flow & Macro Considerations
Early-year liquidity remains thin, increasing the probability of liquidity sweeps on both sides. Patience is required—wait for price reaction at key zones rather than chasing momentum.
Conclusion
Bias remains bearish-to-neutral while below supply. Focus on price reaction at key zones, not direction. Let the market reveal intent.

Trading view, Mountains, Back testing strategy & New yearHappy new year to the Trading view Family, Wishing everyone a strong Year Ahead and in green .
Keep back testing and learning .

Will Bitcoin Hit $50,000 or $500K In Next Cycle ?Most People Still Don’t Understand What This #Bitcoin Chart Is Saying.
This Is The 12-Month CRYPTOCAP:BTC Structure.
It Has Been Respected For 15 Years.
Every Cycle:
Excess → Reset → Higher Floor → Expansion.
All Called “The End.”
All Were Structural Resets.
Here’s The Part Retail Misses:
Bitcoin Is Now Holding Above Its Previous Cycle High, Historically The Most Bullish Phase Of The Cycle.
That’s Not Optimism.
That’s Market Memory.
No Price Targets.
No Narratives.
Just Structure Doing What It Always Does.
If You’re Waiting For Certainty, You’ll Buy Late.
If You Understand Cycles, You Already Know What Comes Next.
🟠 Bitcoin Doesn’t Need Belief. It Needs Time.
IMO:
2026 For Bitcoin Will Likely Be Bearish, And We Could See Bitcoin Under $50K Based On Previous Fractals And Cycle Analysis.
However, 2027–2028 Could Be Massive For Bitcoin, And We May See $500K Within The Next 4 Years, In My Opinion.
This Is Just My Personal View, Not Financial Advice.
Always DYOR Before Any Investment Decisions.

XAUUSD (H1) – Liam View: Strong Bullish Breakout→ short-term bearish shift, prefer selling the pullback | Quick reaction buy at 4330–4333
Quick summary
Gold just printed a very aggressive dump with clear BOS (Break of Structure) — a short-term bearish shift is now in play. Price is currently in a technical rebound, so the cleaner plan is:
Don’t chase shorts at the lows
Wait for a pullback into 4458–4462 to sell from a premium supply zone
If price sweeps back down, look for a quick reaction buy at 4330–4333
1) Technical view (based on your chart)
The sell-off looks like a classic liquidity dump: large bearish candles, multiple supports broken → confirms bearish pressure intraday.
After a dump, the market often retraces into supply (re-distribution) before the next leg.
The 4330–4333 area is marked as a support that already “tested liquidity” — it can still provide a bounce, but it’s more of a scalp zone, not a full reversal yet.
2) Key Levels
✅ Sell zone: 4458 – 4462 (supply / pullback short)
✅ Buy zone: 4330 – 4333 (support / quick reaction)
3) Trading scenarios (Liam style: trade the level)
Scenario A (priority): SELL the pullback
✅ Sell: 4458 – 4462
SL guide: 4470 (or above the most recent lower-TF swing high)
TP1: 4400 – 4390
TP2: 4333
TP3: extension lower if structure continues to break down
Logic: After a strong BOS, 4458–4462 is where you get a better short entry — avoid selling late.
Scenario B: BUY reaction at support (scalp only)
✅ Buy: 4330 – 4333
SL guide: 4322–4325
TP: 4370 → 4400 (scale out)
Logic: This zone can spark a technical bounce. Only buy with clear holding signals on lower timeframes (M5–M15) — no catching falling knives.
4) Confirmation rules (avoid noise)
If price reaches 4458–4462 and fails to reclaim above → SELL bias stays strong.
If 4330 breaks and closes below → stop looking for buys and focus on pullback sells.
5) Risk notes
No mid-range entries — only act at 4330–4333 or 4458–4462.
Risk per trade: max 1–2%.
After a dump, spreads and wicks can expand — reduce size.
Which side are you leaning today: selling 4458–4462, or waiting for 4330–4333 to buy the reaction bounce?

XAUUSD (H1) – Bearish Correction After ATHLana focuses on selling rallies, waiting for a deeper buying zone 💛
Quick overview
Market state: Sharp sell-off after failing to hold above ATH
Timeframe: H1
Current structure: Strong bearish impulse → corrective rebound in progress
Intraday bias: Sell on pullbacks, buy only at major support
Technical picture (based on the chart)
Gold printed a clear distribution top near ATH, followed by a strong bearish displacement. This move broke the short-term bullish structure and shifted momentum to the downside.
Price is now attempting a technical rebound, but so far this looks corrective rather than impulsive. As long as price stays below key resistance, Lana treats this as a sell-the-rally environment.
Key observations:
Strong bearish candle confirms loss of bullish control
Current rebound is moving into prior liquidity + Fibonacci reaction zone
Market is likely building a lower high before the next move
Key levels to trade
Sell zone – priority setup
Sell: 4392 – 4395
This zone aligns with:
Prior structure resistance
Fibonacci retracement area
Liquidity resting above current price
If price reaches this zone and shows rejection, Lana will look for sell continuation.
Buy zone – only at strong support
Buy: 4275 – 4278
This is a higher-timeframe support zone and the first area where buyers may attempt to step back in. Lana only considers buys here if price shows clear reaction and stabilization.
Intraday scenarios
Scenario 1 – Rejection at resistance (preferred)
Price retraces into 4392–4395, fails to break higher, and rolls over → continuation to the downside, targeting deeper liquidity.
Scenario 2 – Deeper correction then recovery
If selling pressure extends, price may sweep liquidity into 4275–4278 before forming a base for a larger rebound into the new year.
Market tone
The recent move reflects profit-taking and risk reduction after an extended rally. With year-end liquidity thinning out, price action can remain volatile and deceptive, making zone-based trading essential.
This analysis reflects Lana’s technical view and is not financial advice. Always manage your own risk and wait for confirmation before entering trades 💛

XAUUSD liquidity grab done, awaiting next move.Market Context (Intraday)
Gold has just completed a sharp sell-off, breaking below the previous structure and sweeping sell-side liquidity. The strong bearish displacement suggests a stop-hunt and rebalancing phase, not a clean trend continuation yet. Current price action shows consolidation after liquidity absorption.
Technical Structure
Market is trading below the descending trendline, keeping short-term pressure bearish.
A clear liquidity sweep occurred below 4,321, followed by a weak rebound.
Price is now reacting inside a key rebalancing zone, where both buyers and sellers may reposition.
Key Levels to Watch
Sell Reaction Zone: 4,455 – 4,460
→ Strong supply + trendline resistance. Expect rejection if price rallies here.
Mid Resistance / Decision Zone: 4,390 – 4,395
→ Intraday flip zone. Failure here keeps bearish bias intact.
Buy Zone (Liquidity): 4,245 – 4,255
→ Major demand + sell-side liquidity. Area to watch for potential bullish reaction.
Scenarios
Bearish Scenario:
If price fails below 4,390, expect continuation toward 4,320 → 4,250 to complete liquidity collection.
Bullish Recovery Scenario:
A strong reaction from 4,245–4,255 followed by acceptance above 4,395 could open a recovery move toward 4,455+.
Macro Notes
With year-end positioning and lower liquidity conditions, price is likely to be driven by liquidity hunts rather than clean trends. Avoid chasing moves; focus on reactions at key zones.
Bias
Neutral to bearish intraday, until price shows a clear acceptance above resistance.
