Part 7 Trading Master Class With Experts Factors That Affect Option Trading Decisions
When trading options, traders must analyze several aspects beyond just price direction:
Market Volatility: Options thrive on volatility. High volatility increases premiums.
Time to Expiry: The closer to expiry, the faster time decay (Theta effect).
Trend and Technical Analysis: Price patterns, volume, and support/resistance levels guide strike selection.
Implied Volatility (IV): It reflects the market’s expectation of future movement.
Events: Earnings announcements, policy decisions, and global news can move volatility and price sharply.
A skilled trader combines these factors with proper strategy and money management.
Tradingforex

Part 3 Learn Institutional Trading Introduction to Option Trading
Option trading is one of the most powerful tools in the financial markets. It allows traders and investors to speculate on price movements, hedge risks, and generate income in various market conditions. Unlike traditional stock trading—where you buy or sell shares directly—option trading gives you the right but not the obligation to buy or sell an asset at a predetermined price within a specified period.
In simple words, options give you flexibility. You can profit whether the market goes up, down, or stays flat—if you know how to use them properly. However, this flexibility also brings complexity. To understand option trading deeply, one needs to grasp how options work, the factors affecting their price, and the strategies traders use to make consistent returns.

Part 2 Ride The Big Moves Advantages of Option Trading
Leverage:
A small premium can control a large amount of the underlying asset.
Flexibility:
You can profit in bullish, bearish, or neutral markets using different strategies.
Defined Risk:
Option buyers’ risk is limited to the premium paid.
Income Generation:
Selling options can create consistent income streams through premiums.
Hedging:
Options protect existing positions against adverse price movements.

Part 1 Ride The Big Moves Hedging with Options
One of the most practical uses of options is hedging, which means reducing risk exposure in an existing portfolio.
For example, suppose you own 1,000 shares of Reliance Industries at ₹2,500 each. You worry about short-term market declines. You can buy put options with a strike price near ₹2,450.
If the price drops, your stock loses value — but the put option gains value, reducing your overall loss.
Similarly, farmers, exporters, and institutions often use options to lock in prices and protect against adverse moves in commodities, currencies, or interest rates.

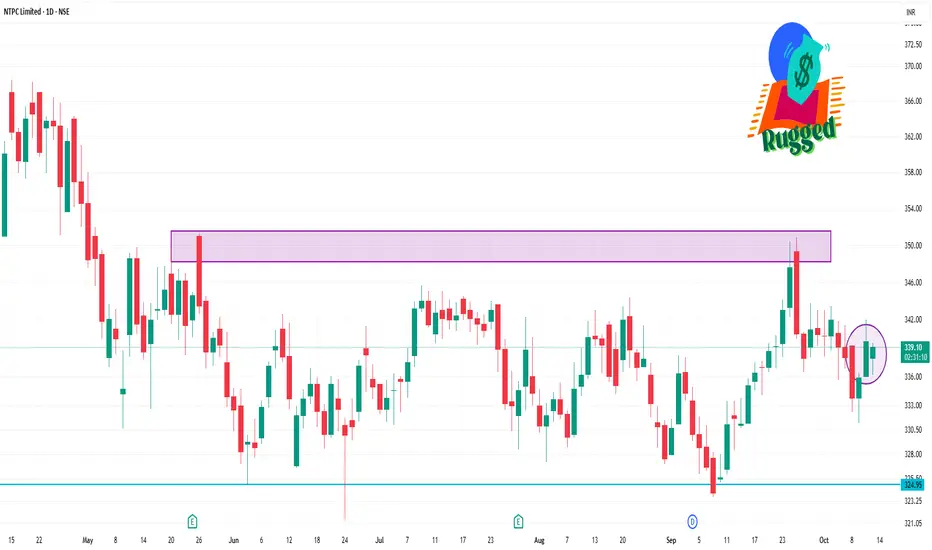
NTPC 1 Day Time Frame📈 Intraday Support & Resistance Levels
Immediate Support: ₹337.29
Immediate Resistance: ₹340.85
Key Pivot Point: ₹339.20
These levels are derived from standard pivot point calculations and are commonly used by traders for short-term strategies.
🔍 Technical Indicators
Relative Strength Index (RSI): 53.93 — indicating a neutral market condition.
Moving Average Convergence Divergence (MACD): 0.330 — suggesting a bullish trend.
5-Day Moving Average: ₹338.45 — supporting a bullish outlook.
50-Day Moving Average: ₹338.05 — reinforcing the bullish trend.
200-Day Moving Average: ₹336.12 — indicating long-term bullish sentiment.
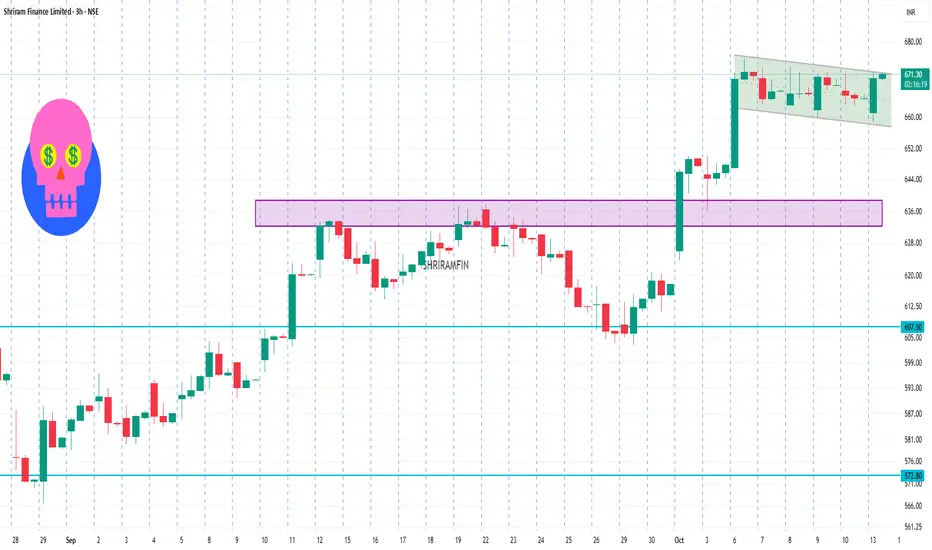
SHRIRAMFIN 3 Hour Time Frame📊 3-Hour Timeframe Technical Levels
Current Price: ₹669.70
Pivot Points:
S1: ₹666.48
Pivot: ₹669.97
R1: ₹674.88
R2: ₹678.37
R3: ₹682.87
Fibonacci Levels:
Retracement:
23.6%: ₹658.34
38.2%: ₹647.73
50%: ₹639.15
61.8%: ₹630.57
76.4%: ₹619.96
Projection:
23.6%: ₹682.21
38.2%: ₹692.82
50%: ₹701.40
61.8%: ₹709.98
76.4%: ₹720.59
Extension:
123.6%: ₹753.14
138.2%: ₹775.18
150%: ₹793.00
161.8%: ₹810.82
176.4%: ₹832.86
Camarilla Levels:
R4: ₹669.67
R3: ₹666.59
R2: ₹663.51
R1: ₹660.43
S1: ₹657.72
S2: ₹654.07
S3: ₹650.55
S4: ₹647.83
Woodie's Levels:
R1: ₹669.25
R2: ₹674.53
R3: ₹679.25
S1: ₹660.85
S2: ₹657.72
S3: ₹654.57
Demark Levels:
R1: ₹668.23
R2: ₹672.50
S1: ₹659.82
S2: ₹665.30
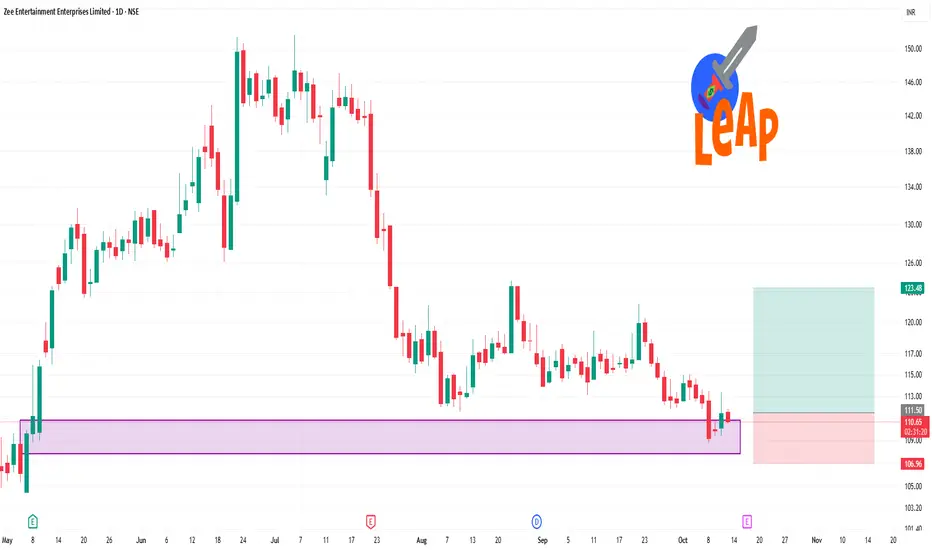
ZEEL 1 Day Time Frame 📊 Daily Technical Levels:
Pivot Point (CPR): ₹111.39
Support Levels:
S1: ₹109.43
S2: ₹107.44
S3: ₹105.48
Resistance Levels:
R1: ₹113.38
R2: ₹115.34
R3: ₹117.33
These levels are based on standard pivot point calculations and are useful for identifying potential reversal points.
📈 Market Sentiment:
The stock's recent performance has been influenced by factors such as a 14% year-on-year decline in revenue and a 16% quarter-on-quarter drop, primarily due to reduced advertising revenue.
Reuters
⚠️ Conclusion:
The current technical indicators and market sentiment suggest a cautious approach. Traders should monitor the support and resistance levels closely and consider the broader market conditions before making investment decisions.
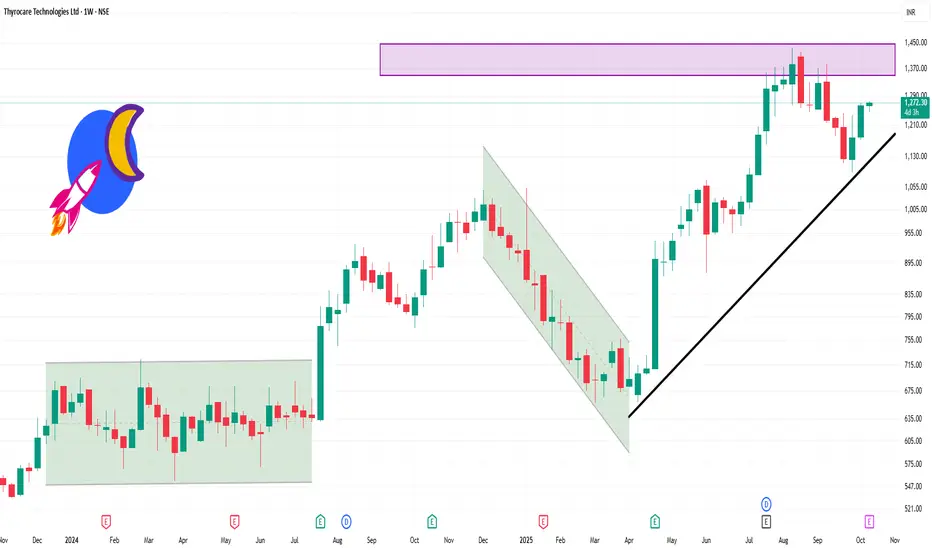
THYROCARE 1 Week Time Frame 📈 1-Week Performance Snapshot
Current Price (Oct 10, 2025): ₹1,264.00
Weekly Gain: Approximately +4.76%
Weekly Range: ₹1,205.80 – ₹1,270.50
This upward trend is supported by increased trading volume, indicating strong investor interest.
🔍 Technical Indicators
Support Levels: ₹1,246.35 and ₹1,208.21
Resistance Levels: ₹1,337.05
Moving Averages: Short-term indicators suggest a bullish outlook, though a potential correction could occur if support levels are breached
📊 Additional Insights
Market Capitalization: ₹6,664.05 crore
P/E Ratio: 62.52
Dividend Yield: 1.66%
52-Week High/Low: ₹1,435.00 / ₹658.00
These metrics position Thyrocare as a significant player in the healthcare sector, with robust financials and a consistent dividend history.
SBIN 1 Month Time Frame📊 1-Month Technical Summary
Overall Rating: Strong Buy
Technical Indicators:
Relative Strength Index (RSI): 71.165 – Suggests the stock is in overbought territory but still indicates buying momentum.
Moving Averages:
5-Day: ₹883.14
50-Day: ₹868.70
200-Day: ₹845.81
MACD: 5.170 – Indicates a bullish trend.
🔄 Pivot Levels (Classic Method)
Resistance Levels:
R1: ₹883.35
R2: ₹884.85
R3: ₹887.20
Support Levels:
S1: ₹879.50
S2: ₹877.15
S3: ₹875.65
Pivot Point: ₹881.00

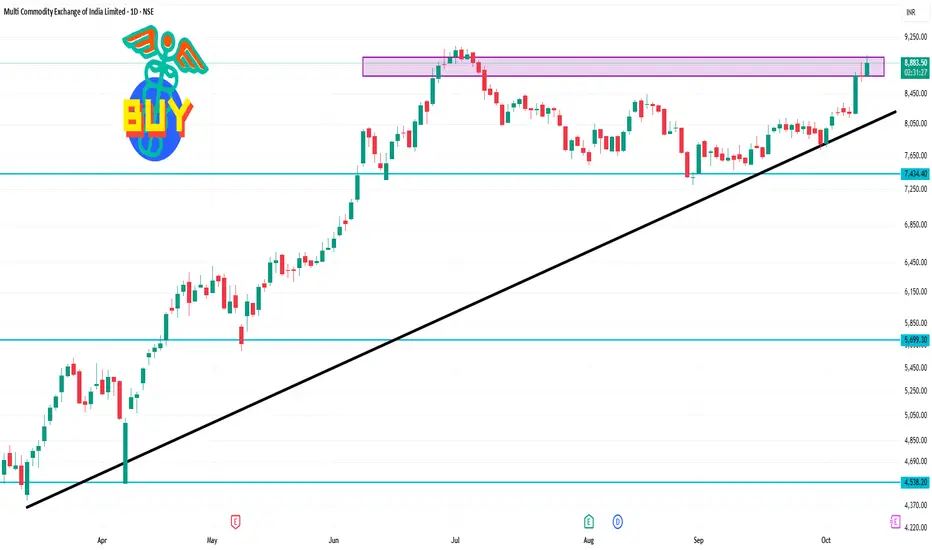
MCX 1 Day Time Frame Opening Price: ₹8,700.00
Day’s High: ₹8,988.00
Day’s Low: ₹8,700.00
Previous Close: ₹8,688.50
Volume: 610,010 shares traded
VWAP (Volume-Weighted Average Price): ₹8,893.80
Technical Indicators:
According to TradingView, the 1-day technical analysis for MCX indicates a strong buy signal, with the majority of indicators, including moving averages and oscillators, supporting this trend. However, the oscillator readings are currently neutral, suggesting a balanced market momentum.
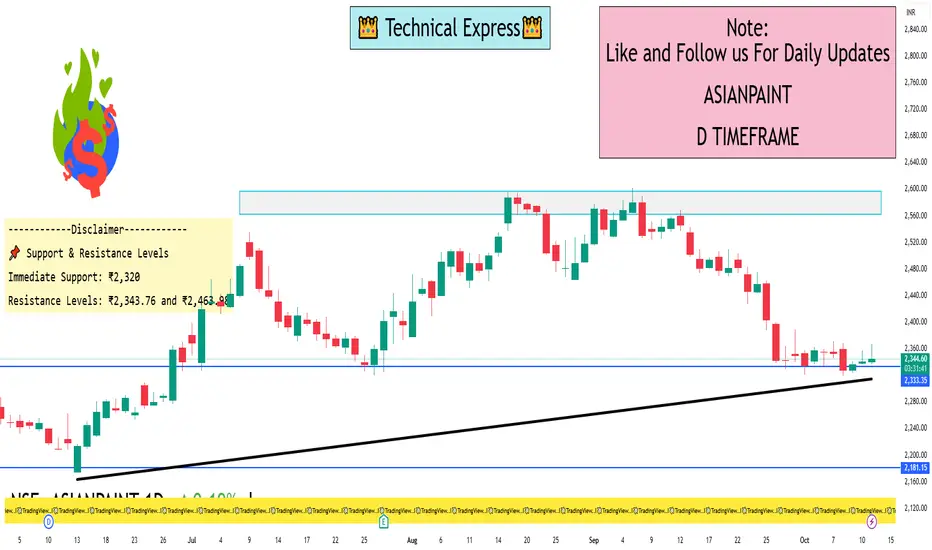
ASIANPAINT 1 Day View📈 Current Price & Trading Range
Current Price: ₹2,357.70
Day’s Range: ₹2,337.00 – ₹2,366.60
Previous Close: ₹2,340.20
52-Week Range: ₹2,124.75 – ₹3,103.55
📊 Technical Indicators
RSI (14-day): 38.17 — indicating a neutral to bearish condition.
MACD: -41.59 — suggesting bearish momentum.
Stochastic RSI: 10.76 — points to an oversold condition, possibly signaling a reversal.
Rate of Change (ROC): -1.93 — reflects downward momentum.
Commodity Channel Index (CCI): -1.93 — supports the bearish outlook.
Average Directional Index (ADX): 32.54 — indicates a strong trend, confirming the downtrend.
Parabolic SAR: ₹2,320 — suggests a bearish trend continuation.
Supertrend: ₹2,444 — aligns with the bearish trend.
📌 Summary
Asian Paints Ltd. is currently in a bearish phase on the 1-day timeframe. Key support at ₹2,320 is crucial; a breach could lead to further declines. Conversely, a rebound above ₹2,463.98 might indicate a potential trend reversal.
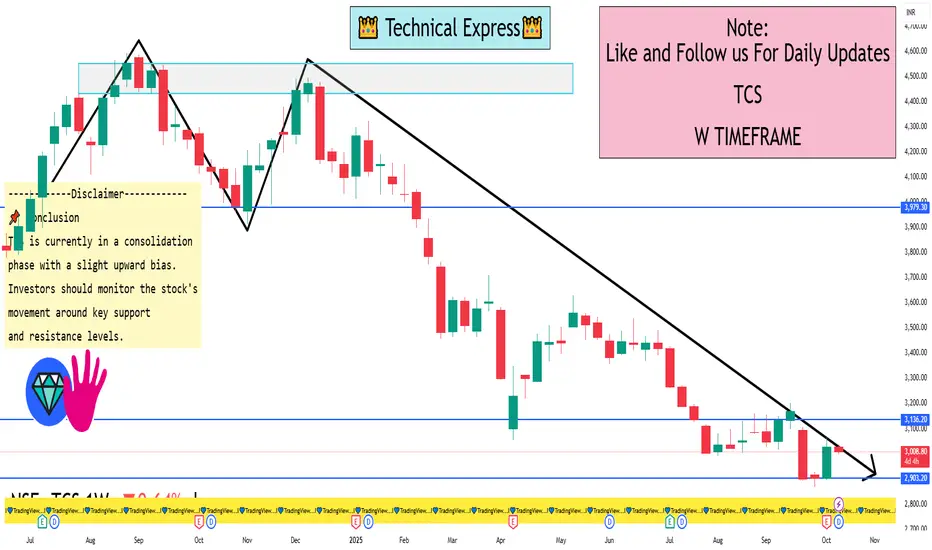
TCS 1 Week View 📊 Weekly Technical Overview
Current Price: ₹3,004.80 (NSE)
Weekly Performance: +3.57%
Year-to-Date Performance: −26.69%
52-Week High: ₹4,592.25 (Aug 30, 2024)
52-Week Low: ₹2,888.40
🔍 Key Technical Indicators
Moving Averages:
5-Day MA: ₹3,018.94 (Sell)
50-Day MA: ₹2,980.76 (Buy)
200-Day MA: ₹3,046.08 (Sell)
Relative Strength Index (RSI): Currently at 40, indicating a neutral stance.
MACD: Bearish crossover observed, suggesting downward momentum.
Support Levels: ₹2,888.40
Resistance Levels: ₹3,176.70
📌 Conclusion
TCS is currently in a consolidation phase with a slight upward bias. Investors should monitor the stock's movement around key support and resistance levels. A break below ₹2,888.40 could signal further downside, while a rise above ₹3,176.70 may indicate a potential trend reversal.
Behavioral Finance and Trader Psychology:Introduction
The traditional models of finance and economics often assume that individuals are rational decision-makers, consistently acting in their best interests to maximize utility. However, real-world financial behavior frequently deviates from these assumptions. Behavioral finance and trader psychology delve into the psychological influences and biases that affect financial decision-making, challenging the notion of rational actors in the market.
Behavioral Finance: An Overview
Definition and Emergence
Behavioral finance is a subfield of behavioral economics that examines how psychological factors influence financial behaviors and market outcomes. It emerged in the late 1970s as a response to the Efficient Market Hypothesis (EMH), which posits that asset prices reflect all available information and thus always trade at their fair value. Behavioral finance contends that cognitive biases and emotional factors lead to market anomalies and inefficiencies.
Key Concepts in Behavioral Finance
Cognitive Biases: These are systematic patterns of deviation from norm or rationality in judgment, whereby inferences about other people and situations may be drawn in an illogical fashion. Common cognitive biases include:
Confirmation Bias: The tendency to search for, interpret, favor, and recall information in a way that confirms one's preexisting beliefs or hypotheses.
Anchoring Bias: The reliance on the first piece of information encountered (the "anchor") when making decisions.
Overconfidence Bias: The tendency to overestimate one's own abilities, knowledge, or control over events.
Availability Bias: The tendency to overestimate the likelihood of events based on their availability in memory.
Emotional Biases: These biases arise from emotions and feelings that influence decision-making. Examples include:
Loss Aversion: The tendency to prefer avoiding losses rather than acquiring equivalent gains; it's better to not lose $5 than to find $5.
Regret Aversion: The reluctance to make decisions due to the fear of making a wrong choice and the potential for future regret.
Herd Behavior: The tendency to mimic the actions (rational or irrational) of a larger group, often leading to asset bubbles or crashes.
Market Implications
Behavioral finance explains various market phenomena that traditional theories struggle with, such as asset bubbles, market crashes, and anomalies like the January effect or momentum. It suggests that markets are not always efficient and that prices can deviate from their intrinsic values due to collective psychological factors.
Trader Psychology: The Emotional Landscape of Trading
Definition and Importance
Trader psychology refers to the emotional and mental state of a trader, which significantly impacts their trading decisions and performance. Understanding trader psychology is crucial because emotions like fear, greed, and hope can lead to impulsive decisions, overtrading, or holding onto losing positions longer than rational analysis would suggest.
Common Psychological Challenges
Fear and Greed: These are the two primary emotions that drive market behavior. Fear can lead to panic selling during downturns, while greed can result in chasing after high-risk, high-reward opportunities during bull markets.
Overtrading: Driven by the desire to make profits or recover losses, traders may engage in excessive trading, leading to higher transaction costs and potential losses.
Loss Aversion: Traders may hold onto losing positions longer than advisable, hoping the market will turn in their favor, due to the psychological pain associated with realizing a loss.
Confirmation Bias: Traders may seek information that confirms their existing beliefs about a trade, ignoring contradictory evidence, which can lead to poor decision-making.
Strategies for Managing Trader Psychology
Developing a Trading Plan: Having a clear plan with defined entry and exit points can help mitigate emotional decision-making.
Risk Management: Setting stop-loss orders and position sizes can prevent significant losses and reduce emotional stress.
Mindfulness and Emotional Awareness: Practicing mindfulness can help traders recognize emotional reactions and prevent them from influencing trading decisions.
Continuous Learning: Educating oneself about psychological biases and their impact on trading can lead to more rational decision-making.
Integrating Behavioral Finance and Trader Psychology
The integration of behavioral finance and trader psychology offers a comprehensive understanding of financial decision-making. While behavioral finance provides a framework for understanding how biases and emotions affect market outcomes, trader psychology focuses on the individual trader's mental and emotional state. Together, they highlight the importance of psychological factors in financial markets and the need for strategies to mitigate their negative effects.
Conclusion
Behavioral finance and trader psychology underscore the complexity of financial markets and the significant role of human behavior in shaping market outcomes. By acknowledging and understanding the psychological factors that influence decision-making, investors and traders can develop strategies to make more informed and rational financial decisions. This holistic approach not only enhances individual performance but also contributes to the overall efficiency and stability of financial markets.
Technical Analysis and Chart PatternsIntroduction to Technical Analysis
Technical Analysis (TA) is the study of historical price and volume data to forecast future price movements in financial markets. Unlike fundamental analysis, which focuses on the intrinsic value of an asset, technical analysis relies on patterns, trends, and statistical indicators to identify trading opportunities. It is widely used across equity, forex, commodities, and cryptocurrency markets by traders of all timeframes, from intraday scalpers to long-term investors.
The foundation of technical analysis rests on three main assumptions:
Market Action Discounts Everything: All information, whether public or private, is already reflected in the current price of an asset.
Prices Move in Trends: Markets follow trends rather than random movement, and identifying these trends can help traders profit.
History Tends to Repeat Itself: Human psychology drives market behavior, and patterns formed in the past tend to recur under similar conditions.
1. Key Principles of Technical Analysis
Trend Analysis
Uptrend: Characterized by higher highs and higher lows. Indicates bullish sentiment.
Downtrend: Characterized by lower highs and lower lows. Indicates bearish sentiment.
Sideways/Range-bound Trend: Occurs when prices move horizontally, often leading to breakout opportunities.
Support and Resistance Levels
Support: A price level where demand is strong enough to prevent further decline. Often a buying opportunity.
Resistance: A price level where selling pressure prevents further rise. Often a selling opportunity.
Breakouts and Breakdowns: Breaching these levels can signal the start of new trends.
Volume Analysis
Volume reflects the intensity of a price movement.
Rising prices with increasing volume confirm trends, whereas divergences (e.g., rising price with falling volume) indicate potential reversals.
Momentum Indicators
Measure the speed and strength of price movements.
Examples: Relative Strength Index (RSI), Moving Average Convergence Divergence (MACD), Stochastic Oscillator.
Moving Averages
Smooth out price fluctuations to identify trends.
Common types: Simple Moving Average (SMA), Exponential Moving Average (EMA).
Crossovers (e.g., 50-day SMA crossing 200-day SMA) are key trading signals.
2. Chart Types
Understanding chart types is crucial for recognizing patterns:
Line Charts
Simple representation connecting closing prices.
Useful for identifying long-term trends but lacks intraday information.
Bar Charts
Displays open, high, low, and close (OHLC) for each period.
Provides more detailed insight into market sentiment.
Candlestick Charts
Originated in Japan; visually appealing and widely used.
Each candlestick shows open, high, low, and close, forming recognizable patterns that signal market direction.
Point and Figure Charts
Ignores time; focuses solely on price changes.
Useful for identifying strong trends and breakout points.
3. Chart Patterns
Chart patterns are visual representations of market psychology, helping traders anticipate future price action. They can be broadly categorized into reversal and continuation patterns.
3.1 Reversal Patterns
Reversal patterns indicate a potential change in trend.
Head and Shoulders
Signifies a trend reversal from bullish to bearish.
Features a left shoulder, a head (higher peak), and a right shoulder.
The neckline is the support level; breaking it confirms the trend reversal.
Inverse Head and Shoulders
Opposite of the standard head and shoulders.
Signals reversal from bearish to bullish.
Double Top
Occurs after an uptrend; two peaks at roughly the same level.
Breaking the support level between the peaks signals a downtrend.
Double Bottom
Occurs after a downtrend; two troughs at a similar level.
Breaking the resistance confirms a bullish reversal.
Triple Top/Bottom
Less common but more reliable than double tops or bottoms.
Indicates stronger resistance or support levels.
3.2 Continuation Patterns
Continuation patterns suggest that the existing trend is likely to continue.
Triangles
Ascending Triangle: Bullish; flat resistance and rising support. Breakout likely upwards.
Descending Triangle: Bearish; flat support and descending resistance. Breakout likely downwards.
Symmetrical Triangle: Neutral; breakout direction depends on the preceding trend.
Flags and Pennants
Short-term consolidation patterns after strong moves.
Flags: Rectangular consolidation; pennants: small symmetrical triangles.
Typically continue in the direction of the previous trend.
Rectangles (Trading Ranges)
Horizontal consolidation between support and resistance.
Breakout indicates trend continuation.
3.3 Candlestick Patterns
Candlestick patterns provide detailed insight into market sentiment:
Single Candlestick Patterns
Doji: Indicates indecision; potential reversal if appearing after a strong trend.
Hammer/Inverted Hammer: Bullish reversal after a downtrend.
Shooting Star: Bearish reversal after an uptrend.
Multiple Candlestick Patterns
Engulfing Pattern: Bullish or bearish reversal depending on candle alignment.
Morning Star/Evening Star: Signals trend reversal.
Three White Soldiers/Three Black Crows: Strong trend continuation patterns.
4. Indicators and Oscillators
Technical analysis often combines chart patterns with indicators:
Trend Indicators
Moving Averages, MACD, ADX (Average Directional Index)
Momentum Indicators
RSI, Stochastic Oscillator, Rate of Change (ROC)
Volatility Indicators
Bollinger Bands, Average True Range (ATR)
Volume Indicators
On-Balance Volume (OBV), Chaikin Money Flow (CMF)
5. Technical Analysis in Trading Strategy
Technical analysis is integrated into different trading strategies:
Day Trading
Focuses on intraday price movements using candlestick patterns and intraday indicators.
Swing Trading
Capitalizes on short to medium-term trends using support/resistance and chart patterns.
Position Trading
Long-term trend following; relies on moving averages, trendlines, and breakout patterns.
Algorithmic Trading
Combines TA rules with automated systems for high-frequency trading.
6. Advantages of Technical Analysis
Quick decision-making due to focus on charts and indicators.
Applicable across different asset classes and timeframes.
Helps identify entry and exit points with greater precision.
7. Limitations of Technical Analysis
Reliance on historical data; past performance doesn’t guarantee future results.
Can produce false signals in highly volatile or low-volume markets.
Requires experience and discipline to interpret patterns accurately.
8. Combining Technical Analysis with Other Tools
Many traders combine TA with fundamental analysis to improve accuracy.
Sentiment analysis, news events, and macroeconomic data can enhance decision-making.
Risk management is essential: stop-loss, position sizing, and portfolio diversification mitigate losses.
Conclusion
Technical analysis and chart patterns provide traders with a structured way to interpret market behavior. While no method guarantees success, mastery of TA enables traders to identify high-probability setups, manage risk, and make informed decisions. With the right combination of pattern recognition, indicator use, and disciplined execution, technical analysis can be a powerful tool in the trader’s arsenal.
By understanding trends, patterns, support/resistance levels, and combining them with indicators and sound risk management, traders can navigate financial markets with greater confidence and precision.
Divergence SecretsThere are two main types of options: Call Options and Put Options.
A Call Option gives the buyer the right to buy an asset at a predetermined price, called the strike price, before the expiry date. Investors buy calls when they expect the price of the underlying asset to rise.
A Put Option, on the other hand, gives the buyer the right to sell an asset at the strike price before expiry. Traders buy puts when they expect the asset’s price to fall.

Part 2 Support and ResistanceAdvantages of Option Trading
a. Leverage:
Options allow traders to control large positions with small capital. Buying one option contract often represents 100 shares, meaning traders can gain significant exposure at a fraction of the cost.
b. Flexibility:
Options can be used for speculation, hedging, or income generation.
c. Limited Risk for Buyers:
When you buy options, your maximum loss is limited to the premium paid.
d. Hedging Tool:
Investors can use options to protect their portfolios from downside risk — for instance, buying a put option as insurance against a market fall.

Part 1 Support and Resistance Option Pricing – The Greeks
Option pricing is influenced by several factors such as the underlying price, time to expiry, volatility, and interest rates. These factors are represented by “Greeks,” which measure the sensitivity of an option’s price to different variables:
Delta (Δ): Measures how much the option price changes with a ₹1 move in the underlying asset.
Gamma (Γ): Measures the rate of change of Delta — i.e., how stable Delta is.
Theta (Θ): Measures time decay — how much value the option loses each day as expiry nears.
Vega (ν): Measures sensitivity to volatility — how much the option price changes with changes in market volatility.
Rho (ρ): Measures sensitivity to interest rates.
Understanding these helps traders build strategies that match their risk tolerance and market view.

Option Trading Participants in Option Trading
There are generally four types of participants in the options market:
Buyers of Calls: Expect the price of the underlying to go up.
Sellers (Writers) of Calls: Expect the price to remain the same or fall.
Buyers of Puts: Expect the price of the underlying to go down.
Sellers (Writers) of Puts: Expect the price to remain the same or rise.
Buyers have limited risk (the premium paid) and unlimited profit potential, while sellers have limited profit (premium received) but unlimited potential risk.

Part 1 Candle Stick PatternKey Terminology in Options
Before diving deeper, understanding these basic terms is essential:
Strike Price: The price at which the option can be exercised.
Premium: The price paid by the buyer to purchase the option.
Expiry Date: The date on which the option contract ends.
In the Money (ITM): When exercising the option gives a profit (e.g., a call option when the stock price is above the strike price).
Out of the Money (OTM): When exercising the option gives a loss (e.g., a call option when the stock price is below the strike price).
At the Money (ATM): When the stock price and strike price are almost the same.
Underlying Asset: The financial instrument (like a stock, index, or currency) on which the option is based.

PCR Trading Strategies What is an Option?
An option is a financial contract that gives the buyer the right, but not the obligation, to buy or sell an underlying asset (such as a stock or index) at a specific price (called the strike price) before or on a certain date (called the expiry date).
There are two main types of options:
Call Option: Gives the holder the right to buy the asset.
Put Option: Gives the holder the right to sell the asset.
The person who sells (writes) the option has the obligation to fulfill the contract if the buyer chooses to exercise it.

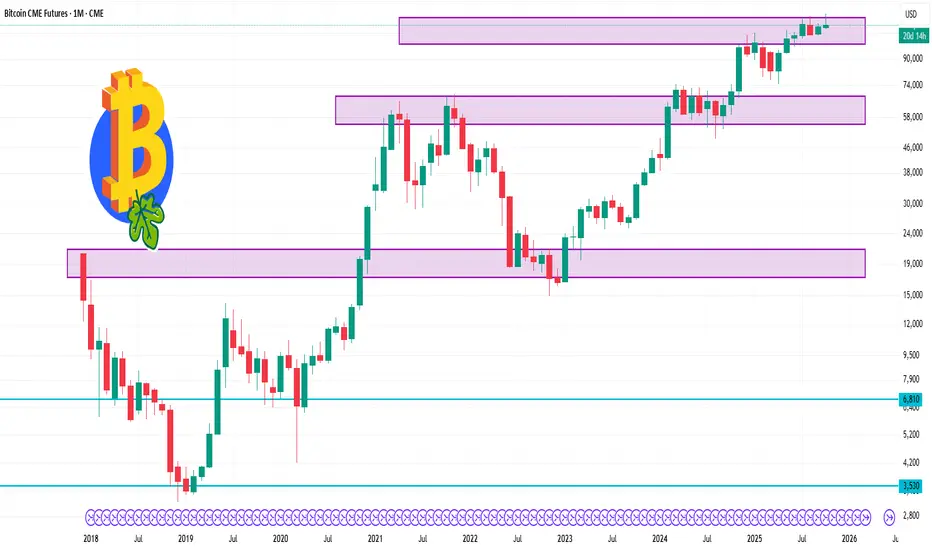
Bitcoin 1 Month Time frame 📊 1-Month Price Range
High: $123,270
Low: $113,150
Current: $116,990
52-Week Range: $59,990 – $127,240
🔍 Technical Overview
The 1-month technical analysis for BTC.1 indicates a neutral market sentiment, with no strong buy or sell signals.
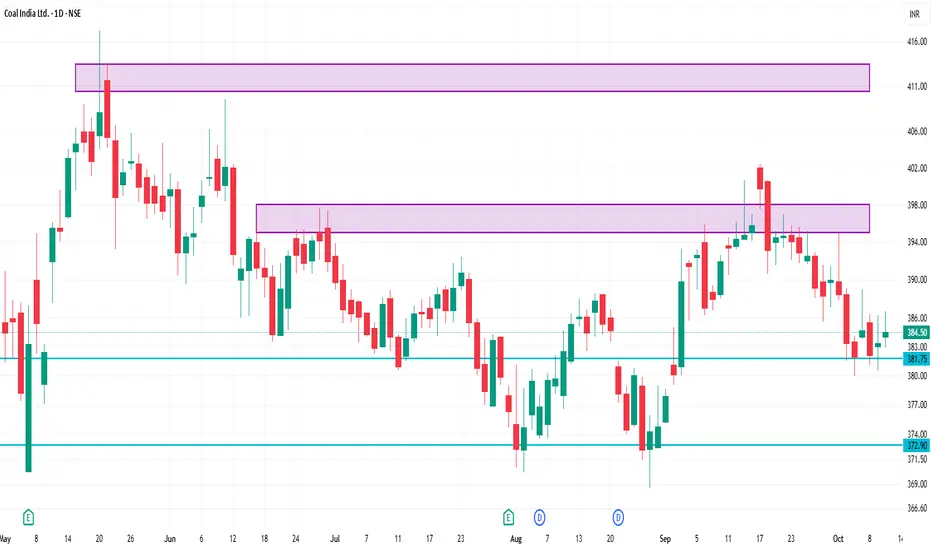
COALINDIA 1 Day Time Frame 📊 Key Intraday Levels
Support Levels: ₹382.95 – ₹383.35
Resistance Levels: ₹386.70 – ₹387.85
Day Range: ₹382.95 – ₹386.70
Previous Close: ₹383.35
Upper Circuit Limit: ₹421.65
Lower Circuit Limit: ₹345.05
52-Week Range: ₹349.25 – ₹502.45
🔍 Technical Indicators
Pivot Points: Central Pivot at ₹389.17, with resistance at ₹391.20 and support at ₹388.55.
Candlestick Patterns: Recent sessions have shown patterns like Harami Bullish and Doji, indicating indecision and possible reversal attempts.
Relative Strength Index (RSI): The 14-day RSI is at 48.52, suggesting a neutral market condition.
📈 Summary
Coal India Ltd is currently trading near its support level of ₹383.35. A breakout above ₹387.85 could signal a bullish trend, while a decline below ₹382.95 may indicate a bearish move. Technical indicators suggest a neutral market condition, with recent candlestick patterns indicating indecision and possible reversal attempts.
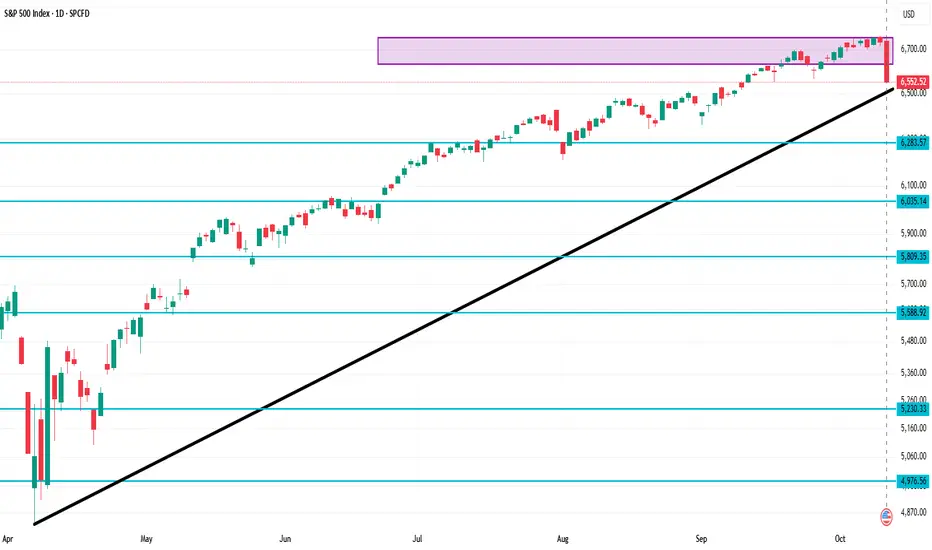
SPX 1 Day Time Frame Earlier today, the index opened at 6,740.49 USD, with a daily high of 6,762.40 USD and a low of 6,550.78 USD.
Key Metrics:
Opening Price: 6,740.49 USD
Day's Range: 6,550.78 – 6,762.40 USD
52-Week Range: 4,835.04 – 6,764.58 USD
Previous Close: 6,735.11 USD
Change: -182.6 USD
% Change: -2.71%
This downturn follows President Trump's recent threats of "massive" tariffs on China, marking the largest single-day loss for the S&P 500 since April 2025.