Part 11 Trading Master Class With Experts Option Greeks
Option prices are influenced by several factors, measured through the Greeks:
Delta: Measures how much the option price changes with a ₹1 move in the underlying.
Gamma: Measures how Delta changes as the underlying price changes.
Theta: Measures time decay (how the option loses value daily).
Vega: Measures sensitivity to volatility changes.
Rho: Measures sensitivity to interest rate changes.
Traders use these Greeks to manage risk and plan strategies.
Tradinghub

Part 1 Support and Resistance How Option Trading Works
Let’s take a simple example:
You buy a Call Option for Reliance Industries with a strike price of ₹2,400, expiring in one month.
The premium is ₹50 per share, and the lot size is 250 shares.
So, your cost = ₹50 × 250 = ₹12,500.
If the stock price rises to ₹2,500 before expiry, your option becomes profitable.
You can either exercise your right to buy at ₹2,400 (and immediately sell at ₹2,500), or you can sell the option itself in the market for a profit.
If the stock stays below ₹2,400, your option will expire worthless, and your loss will be limited to the premium paid (₹12,500).

ITC 1 Day Time Frame📊 Key Support & Resistance Levels
Support Levels: ₹398.30, ₹399.25, ₹397
Resistance Levels: ₹401, ₹402, ₹403
The stock is currently near the support zone, indicating potential for a short-term rebound if buying pressure increases.
📈 Pivot Points (Classic Method)
Pivot Point: ₹399.58
Resistance Levels: R1: ₹400.62, R2: ₹401.98, R3: ₹403.02
Support Levels: S1: ₹398.22, S2: ₹397.18, S3: ₹395.82
Trading below the pivot point suggests a bearish bias.

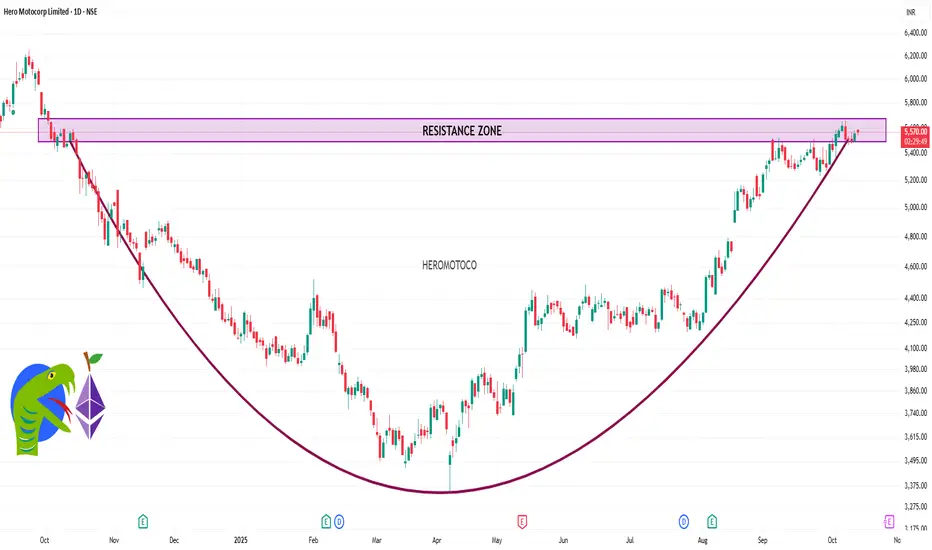
HEROMOTOCO 1 Day Time Frame 📈 Current Price and Technical Overview
Current Price: ₹5,547.50
Day's Range: ₹5,540.00 – ₹5,591.00
52-Week Range: ₹3,344.00 – ₹5,659.00
Volume: 181,480 shares
VWAP: ₹5,561.87
Market Cap: ₹111,208 crore
🔍 Technical Indicator
RSI (14-day): 53.69 — Neutral
MACD: 4.05 — Buy Signal
CCI: 92.51 — Buy Signal
ADX: 28.12 — Buy Signal
ATR (14-day): ₹35.14 — Indicates lower volatility
📊 Moving Averages
5-day EMA: ₹5,443.40 — Buy Signal
20-day EMA: ₹5,547.67 — Buy Signal
50-day EMA: ₹5,521.93 — Buy Signal
100-day EMA: ₹5,484.48 — Buy Signal
200-day EMA: ₹5,350.33 — Buy Signal
Breakout and Breakdown Trading1. Introduction to Breakout and Breakdown Trading
In financial markets, price movement is influenced by the forces of supply and demand. Traders identify key levels where these forces tend to converge and then anticipate movements when price “breaks out” above a resistance level or “breaks down” below a support level.
Breakout Trading: A strategy that involves entering a position when the price moves above a defined resistance level with the expectation of further upward momentum.
Breakdown Trading: The opposite approach, where traders enter a position when the price falls below a support level, anticipating a continuation of downward movement.
These strategies are rooted in technical analysis, relying on historical price action and market psychology rather than fundamental factors.
2. Core Concepts
2.1 Support and Resistance
Support: A price level where buying interest is strong enough to prevent further decline. It acts as a “floor.”
Resistance: A price level where selling pressure is strong enough to prevent further increase. It acts as a “ceiling.”
Breakouts occur when price surpasses resistance, while breakdowns happen when price falls below support.
2.2 Volume
Volume is a crucial confirmation tool. A breakout or breakdown is considered strong if accompanied by increased trading volume, as this indicates genuine market participation rather than a false move.
2.3 Price Consolidation
Before breakouts or breakdowns, prices often consolidate in tight ranges. These consolidations can be:
Rectangles
Triangles
Flags and pennants
Understanding the consolidation pattern helps traders anticipate the direction and magnitude of the breakout or breakdown.
3. Types of Breakouts and Breakdowns
3.1 Horizontal Breakouts
Occur when price breaks a clearly defined horizontal support or resistance.
Example: A stock repeatedly fails to move above $100. A breakout above $100 signals upward momentum.
3.2 Trendline Breakouts
Occur when price crosses a diagonal trendline drawn along highs or lows.
Uptrend breakout: Price breaks above a descending trendline.
Downtrend breakdown: Price falls below an ascending trendline.
3.3 Pattern-Based Breakouts
Certain chart patterns often precede strong breakouts or breakdowns:
Triangles: Symmetrical, ascending, or descending triangles
Rectangles: Price moves within a horizontal range
Flags and Pennants: Continuation patterns after a sharp move
Pattern-based breakouts tend to offer predictable price targets based on pattern dimensions.
4. Breakout Trading Strategy
4.1 Identifying a Breakout
Look for a well-defined resistance level or consolidation pattern.
Confirm breakout using volume: higher than average volume indicates strong buying interest.
Check for fundamental or news catalysts that may strengthen the breakout.
4.2 Entry Techniques
Aggressive Entry: Enter immediately when price crosses resistance.
Conservative Entry: Wait for a candle to close above resistance to confirm breakout.
4.3 Stop Loss Placement
Below the breakout point or recent swing low.
Helps protect against false breakouts.
4.4 Profit Targets
Use pattern-based targets: For triangles or rectangles, project the height of the pattern above breakout.
Use trailing stops to capture extended moves without exiting too early.
5. Breakdown Trading Strategy
5.1 Identifying a Breakdown
Look for a strong support level or consolidation pattern.
Check for rising selling volume: heavy selling confirms breakdown.
Identify any macroeconomic or sector-specific events that may accelerate declines.
5.2 Entry Techniques
Aggressive Entry: Enter immediately as the price breaks support.
Conservative Entry: Wait for a candle close below support to reduce risk.
5.3 Stop Loss Placement
Above the breakdown point or recent swing high.
Protects against false breakdowns where the price quickly recovers.
5.4 Profit Targets
Pattern-based projections: Use the height of the consolidation pattern subtracted from the breakdown point.
Trailing stops help lock in gains in volatile markets.
6. Psychological Aspects of Breakout and Breakdown Trading
Trading breakouts and breakdowns is as much psychological as technical:
6.1 Fear of Missing Out (FOMO)
Many traders enter too early due to FOMO, risking false breakouts.
Patience and confirmation reduce this risk.
6.2 Market Sentiment
Breakouts often occur when sentiment shifts from neutral or negative to bullish.
Breakdowns often coincide with panic selling or negative news.
6.3 Confirmation Bias
Traders may see a breakout or breakdown where none exists.
Strict adherence to predefined rules prevents bias-driven errors.
7. Common Mistakes and Risks
7.1 False Breakouts/Breakdowns
Occur when price briefly crosses support or resistance but reverses immediately.
Mitigation: Wait for candle close, confirm with volume, and consider broader market trend.
7.2 Overleveraging
Using excessive margin amplifies losses if breakout fails.
Always use proper risk management (1–2% of capital per trade).
7.3 Ignoring Market Context
Breakouts in choppy or low-liquidity markets are less reliable.
Always consider overall market trend, sector strength, and macroeconomic factors.
8. Tools and Indicators for Confirmation
8.1 Volume Indicators
On-Balance Volume (OBV)
Volume Oscillator
8.2 Momentum Indicators
RSI (Relative Strength Index): Confirms overbought or oversold conditions
MACD (Moving Average Convergence Divergence): Identifies trend shifts
8.3 Moving Averages
Help confirm breakout/breakdown trend direction.
Common strategy: Wait for price to cross above/below 20-day or 50-day moving average.
9. Examples of Breakout and Breakdown Trading
9.1 Breakout Example
Stock consolidates between $50–$55.
Breaks above $55 on heavy volume, closing at $56.
Entry: $56
Stop Loss: $54.50 (below consolidation)
Target: $61 (height of consolidation added to breakout level)
9.2 Breakdown Example
Stock trades between $70–$65.
Falls below $65 with high volume, closing at $64.
Entry: $64
Stop Loss: $66 (above consolidation)
Target: $59 (height of consolidation subtracted from breakdown level)
10. Advanced Techniques
10.1 Pullback Entry
After breakout, price often retests the breakout level.
Provides lower-risk entry opportunities.
10.2 Multiple Timeframe Analysis
Confirm breakout on higher timeframe (daily or weekly) while entering on lower timeframe (hourly or 15-min).
Reduces the likelihood of false breakouts.
10.3 Combining with Fundamental Analysis
Breakouts accompanied by strong earnings, positive news, or macroeconomic support have higher reliability.
Breakdowns following negative news or sector weakness confirm downward trend.
Conclusion
Breakout and breakdown trading is a cornerstone of technical trading, blending market psychology, price action, and disciplined risk management. While the concept is simple—buy above resistance and sell below support—the execution requires attention to volume, patterns, market context, and trading psychology. Traders who master these strategies can capitalize on strong momentum moves and manage risk effectively.
Successful breakout and breakdown trading hinges on patience, confirmation, proper entry and exit points, and disciplined risk management. By combining technical indicators, volume analysis, and pattern recognition, traders can improve the probability of capturing meaningful market moves while avoiding the pitfalls of false signals.
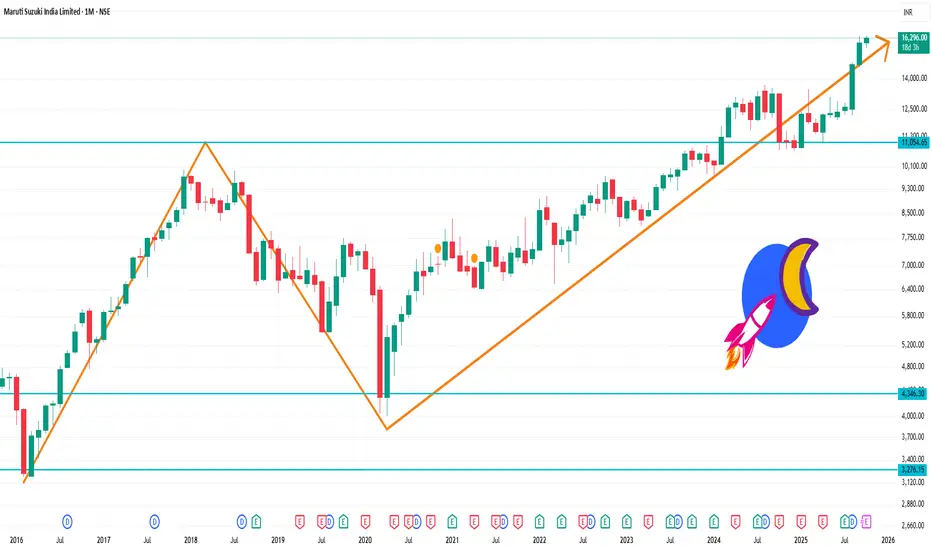
MARUTI 1 Month Time Frame 📊 Monthly Support & Resistance Levels
Based on pivot point analysis, here are the key levels to watch:
Pivot Point (PP): ₹16,163.67
Resistance Levels: ₹16,416.33 (R1), ₹16,567.67 (R2), ₹16,820.33 (R3)
Support Levels: ₹16,012.33 (S1), ₹15,759.67 (S2), ₹15,608.33 (S3)
These levels are derived from standard pivot point calculations and can serve as potential entry or exit points for traders.
Technical Indicators
Relative Strength Index (RSI): Currently at 59.15, indicating that the stock is not yet overbought and may have room for further upside.
Moving Averages: The stock is trading above its 50-day and 200-day moving averages, confirming an uptrend.
MACD: The Moving Average Convergence Divergence (MACD) is positive, suggesting bullish momentum.
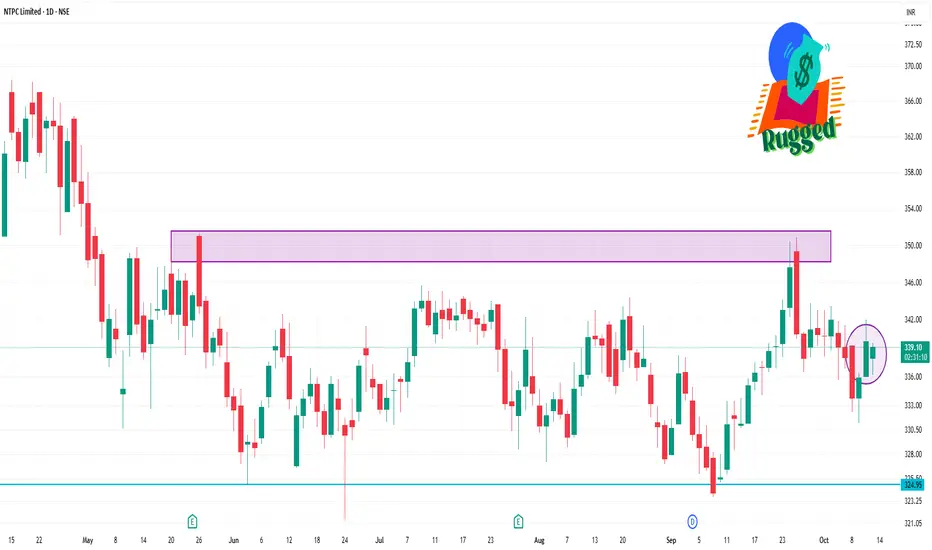
NTPC 1 Day Time Frame📈 Intraday Support & Resistance Levels
Immediate Support: ₹337.29
Immediate Resistance: ₹340.85
Key Pivot Point: ₹339.20
These levels are derived from standard pivot point calculations and are commonly used by traders for short-term strategies.
🔍 Technical Indicators
Relative Strength Index (RSI): 53.93 — indicating a neutral market condition.
Moving Average Convergence Divergence (MACD): 0.330 — suggesting a bullish trend.
5-Day Moving Average: ₹338.45 — supporting a bullish outlook.
50-Day Moving Average: ₹338.05 — reinforcing the bullish trend.
200-Day Moving Average: ₹336.12 — indicating long-term bullish sentiment.
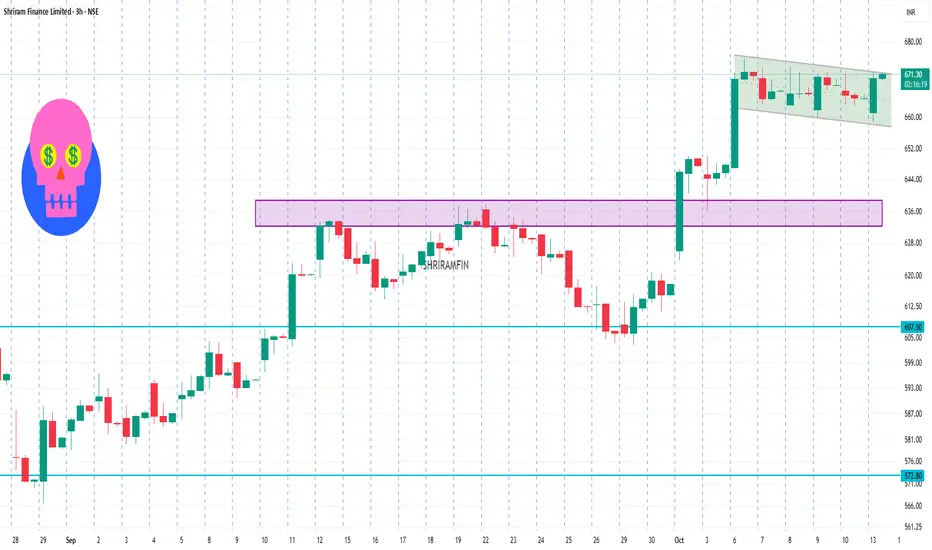
SHRIRAMFIN 3 Hour Time Frame📊 3-Hour Timeframe Technical Levels
Current Price: ₹669.70
Pivot Points:
S1: ₹666.48
Pivot: ₹669.97
R1: ₹674.88
R2: ₹678.37
R3: ₹682.87
Fibonacci Levels:
Retracement:
23.6%: ₹658.34
38.2%: ₹647.73
50%: ₹639.15
61.8%: ₹630.57
76.4%: ₹619.96
Projection:
23.6%: ₹682.21
38.2%: ₹692.82
50%: ₹701.40
61.8%: ₹709.98
76.4%: ₹720.59
Extension:
123.6%: ₹753.14
138.2%: ₹775.18
150%: ₹793.00
161.8%: ₹810.82
176.4%: ₹832.86
Camarilla Levels:
R4: ₹669.67
R3: ₹666.59
R2: ₹663.51
R1: ₹660.43
S1: ₹657.72
S2: ₹654.07
S3: ₹650.55
S4: ₹647.83
Woodie's Levels:
R1: ₹669.25
R2: ₹674.53
R3: ₹679.25
S1: ₹660.85
S2: ₹657.72
S3: ₹654.57
Demark Levels:
R1: ₹668.23
R2: ₹672.50
S1: ₹659.82
S2: ₹665.30
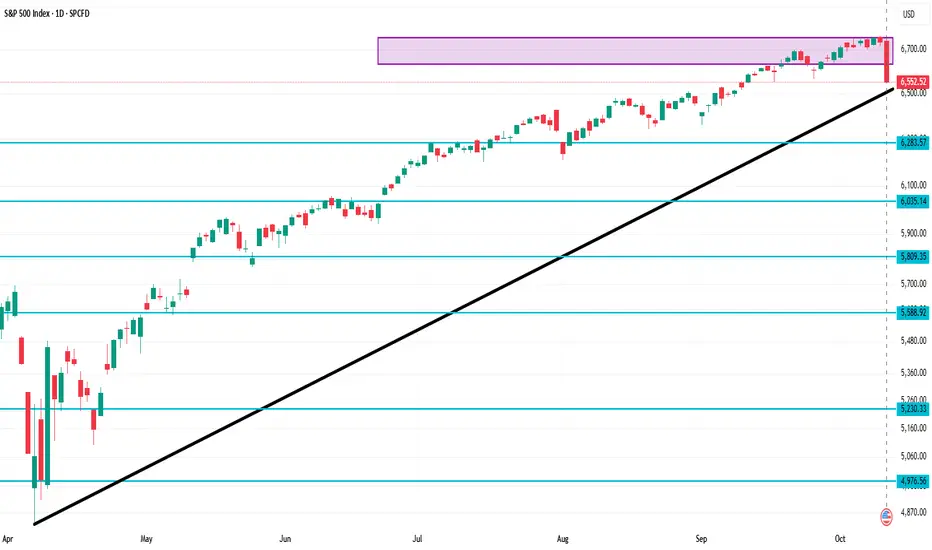
SPX 1 Day Time Frame Earlier today, the index opened at 6,740.49 USD, with a daily high of 6,762.40 USD and a low of 6,550.78 USD.
Key Metrics:
Opening Price: 6,740.49 USD
Day's Range: 6,550.78 – 6,762.40 USD
52-Week Range: 4,835.04 – 6,764.58 USD
Previous Close: 6,735.11 USD
Change: -182.6 USD
% Change: -2.71%
This downturn follows President Trump's recent threats of "massive" tariffs on China, marking the largest single-day loss for the S&P 500 since April 2025.
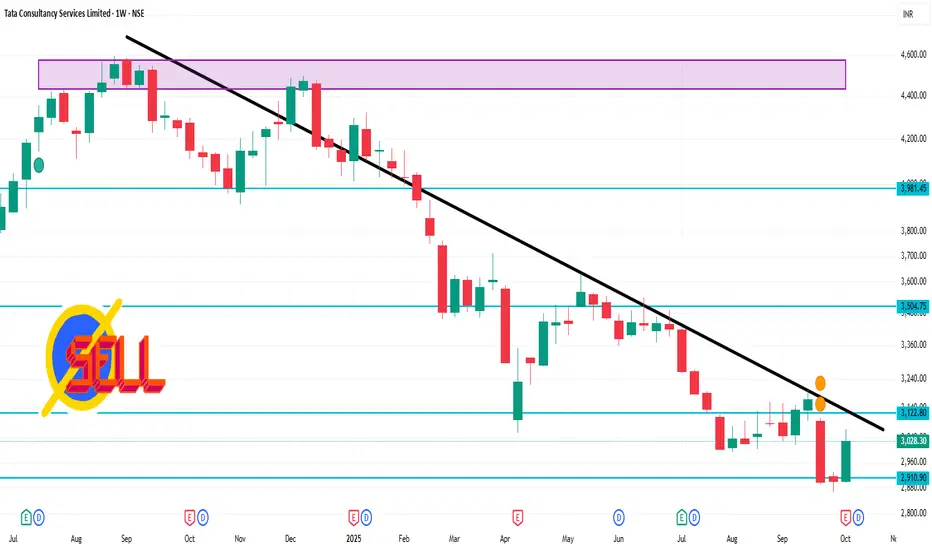
TCS 1 Week Time Frame Weekly Technical Overview
Current Price: ₹3,028.30 on the NSE
52-Week Range: ₹2,866.60 – ₹4,494.90
Volume: Approximately 8.8 million shares traded this week
VWAP: ₹3,032.15
Market Cap: ₹1.095 trillion
Beta: 0.97 (indicating moderate volatility
🔍 Key Technical Indicators
Moving Averages: TCS is trading below its 200-day moving average, suggesting a bearish trend.
RSI: The Relative Strength Index is in the neutral zone, indicating balanced buying and selling pressures.
MACD: The Moving Average Convergence Divergence is showing a bearish crossover, which may signal a potential downward movement.
📈 Outlook
Support Levels: Immediate support is observed around ₹2,950, with a stronger support zone near ₹2,870.
Resistance Levels: Key resistance is at ₹3,100, followed by ₹3,200.
Volatility: The stock's beta of 0.97 suggests that it moves in line with the broader market, with moderate volatility.
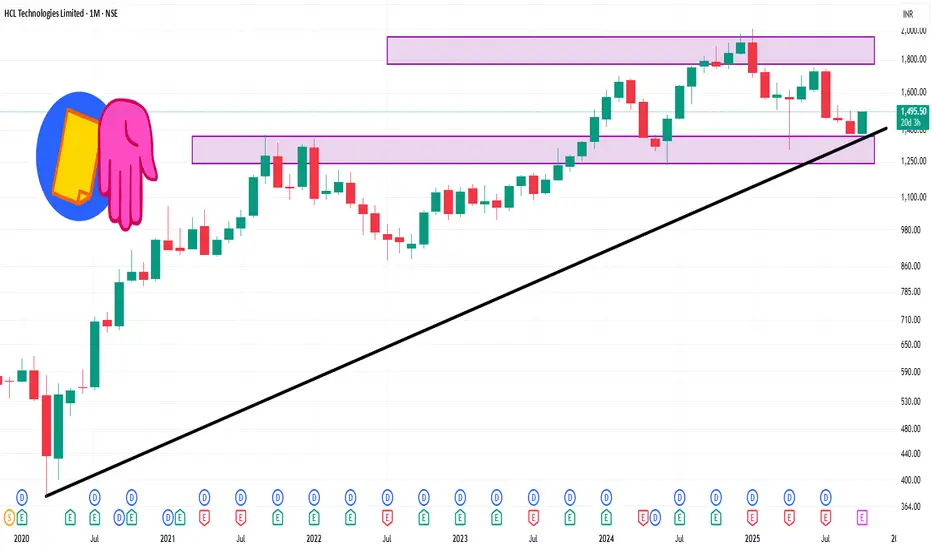
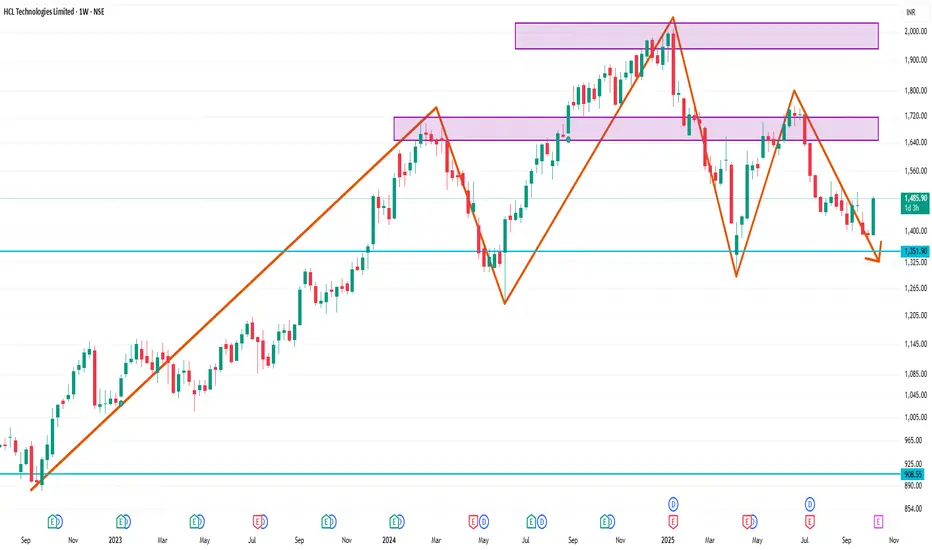
HCLTECH 1 Month Time Frame 📈 1-Month Performance Overview
Current Price: ₹1,495.50
1-Month Change: +4.19%
52-Week Range: ₹1,302.75 – ₹2,012.20
Market Capitalization: ₹4,05,612 crore
P/E Ratio (TTM): 23.88
Dividend Yield: 4.02%
Over the past month, HCL Technologies has shown a steady upward trend, outperforming the Nifty IT Index, which has gained approximately 0.33% during the same period.
📊 Technical Snapshot
1-Month High: ₹1,502.90
1-Month Low: ₹1,380.40
Average Price: ₹1,443.09
Price Change: +2.16%
Open Interest Analysis: Backbone of Derivative Market Insights 1. Understanding Open Interest
Open interest represents the total number of outstanding derivative contracts (futures or options) that have not been settled or closed. It is a measure of market participation and liquidity.
When two traders—say, a buyer and a seller—create a new position, open interest increases by one contract. When both sides close their existing positions, open interest decreases by one. If one side transfers the contract to another trader without creating a new position, open interest remains unchanged.
In simpler terms:
OI increases when new positions are created (new money entering the market).
OI decreases when positions are closed (money exiting the market).
OI remains unchanged when positions are transferred between traders.
Thus, open interest shows whether the market is expanding (with more traders entering) or contracting (with participants exiting).
2. The Role of Open Interest in Futures and Options
In futures trading, open interest shows the number of active contracts for a given asset and expiry date. In options trading, OI reflects the number of outstanding calls and puts for each strike price.
For example:
If the Nifty 50 22,000 Call option shows an OI of 1,200,000 contracts, it means that there are 1.2 million open contracts (positions) that haven’t been closed yet.
This number helps traders gauge where market participants are concentrating their bets—on calls (bullish positions) or puts (bearish positions).
3. Importance of Open Interest Analysis
a. Identifying Market Strength
High OI with strong price movement indicates conviction behind the trend. It shows that new traders are committing capital in the direction of the move, confirming its strength.
b. Understanding Liquidity
Higher open interest typically means better liquidity, narrower bid-ask spreads, and smoother trade execution.
c. Tracking Institutional Activity
Institutional traders (like mutual funds, FIIs, or prop desks) usually dominate OI build-ups. A sudden spike in OI can signal that large players are taking positions, often ahead of a major market move.
d. Predicting Trend Reversals
A sudden drop in OI after a sustained trend often indicates position closure and potential trend reversal.
e. Supporting Technical Analysis
OI acts as a confirmation tool for chart patterns, volume indicators, and price action setups. For example, a breakout supported by rising OI has higher credibility than one with falling OI.
4. Combining Open Interest with Price and Volume
A complete analysis combines price, volume, and open interest:
Price ↑ + Volume ↑ + OI ↑ → Strong uptrend confirmation.
Price ↓ + Volume ↑ + OI ↑ → Strong downtrend confirmation.
Price ↑ + OI ↓ → Short covering rally (temporary rise).
Price ↓ + OI ↓ → Long unwinding (trend exhaustion).
This triad helps traders differentiate between genuine trend moves and fake breakouts.
5. How Professional Traders Use Open Interest
a. Identifying Support and Resistance
In options, the strikes with the highest call OI often act as resistance, while those with highest put OI act as support.
For example:
If Nifty has maximum Call OI at 22,500 and maximum Put OI at 22,000, traders expect the index to trade between 22,000–22,500.
b. Spotting Breakouts
If price crosses a strike with heavy OI buildup, and OI shifts to the next strike, it indicates a potential breakout or breakdown.
c. Tracking Expiry Dynamics
Near expiry, OI concentration often indicates option writers’ zones—areas where institutions will try to keep the index pinned (known as “option expiry games”).
d. Detecting Traps
Sudden OI spikes against price direction may suggest a bull trap or bear trap, where retail traders are caught on the wrong side.
6. Tools and Platforms for OI Analysis
Today, most trading platforms provide real-time OI data. Some popular resources include:
NSE India (official data for futures & options).
TradingView / ChartIQ (OI overlays on price charts).
Sensibull / Opstra / StockEdge / Fyers One for option chain analytics.
These tools allow traders to visualize OI distribution, changes by strike, and intraday buildup patterns.
7. Limitations of Open Interest Analysis
While OI is powerful, it is not infallible. Key limitations include:
Complex Interpretation: OI changes can occur for multiple reasons—new positions, rollovers, or hedging—making analysis tricky.
Expiry Effects: Near expiry, contracts naturally unwind, reducing OI without reflecting sentiment changes.
Lack of Volume Context: High OI with low volume may mislead traders into thinking momentum is strong.
Market Manipulation: Institutions can temporarily create artificial OI buildups to trap retail traders.
Thus, OI should always be used in conjunction with price, volume, and technical indicators.
8. Case Study: Nifty Index Option Chain
Suppose on a given trading day:
22,000 Put OI = 50 lakh contracts.
22,500 Call OI = 55 lakh contracts.
PCR = 0.91.
Interpretation:
Strong support near 22,000 (highest Put OI).
Resistance near 22,500 (highest Call OI).
PCR below 1 → slightly bearish tone.
If price closes above 22,500 with rising OI, resistance is broken, indicating potential upside continuation.
9. Advanced Open Interest Concepts
a. Rollover Analysis
As expiry approaches, traders roll over their positions to the next series. The percentage of OI carried forward (rollover %) shows the conviction of trend continuation.
b. OI Change Analysis
Tracking intraday OI change helps detect fresh long or short buildups in real-time.
c. Long-Short Ratio
In the futures market, the long-short ratio of institutional traders provides an aggregate picture of market bias.
d. Option Chain OI Shift
Monitoring shifts in OI across strikes helps traders anticipate range expansions or contractions.
10. Strategies Using Open Interest
a. Long Buildup Strategy
Condition: Price ↑, OI ↑
Action: Enter long with stop loss below recent low.
b. Short Buildup Strategy
Condition: Price ↓, OI ↑
Action: Enter short with stop loss above recent high.
c. Short Covering Strategy
Condition: Price ↑, OI ↓
Action: Avoid fresh shorts; can take long for short-term rally.
d. Long Unwinding Strategy
Condition: Price ↓, OI ↓
Action: Avoid longs; wait for trend re-entry or reversal.
11. Real-World Insights
Experienced traders often note that:
A sustained OI increase for 3–5 days in one direction signals institutional conviction.
Sharp OI drops before earnings or policy events reflect uncertainty and hedging unwinds.
The shift in maximum OI strikes often precedes trend transitions in the index.
12. Conclusion
Open Interest Analysis is not just a numerical measure—it is a window into the market’s collective psychology. It tells traders whether money is entering or exiting, whether trends are genuine or weak, and where the big players are positioning themselves.
By mastering OI analysis, traders can anticipate moves rather than react to them. It empowers them to identify accumulation or distribution phases, spot traps, and align trades with institutional flows.
However, the key lies in contextual analysis—combining OI data with price, volume, and market structure. Used wisely, open interest becomes a compass that guides traders through the often-chaotic world of derivatives with clarity, confidence, and precision.
Advanced Trading Methods: Mastering Modern Market Strategies1. The Foundation of Advanced Trading
Before diving into the methods, it’s essential to understand what makes a trading approach “advanced.” Advanced trading involves:
Complex analytical frameworks: Using mathematical and statistical models to identify opportunities.
Data-driven decision-making: Reliance on historical and real-time market data.
Algorithmic execution: Automating trades for efficiency and precision.
Risk-adjusted performance: Focusing on consistent, sustainable returns rather than speculative profits.
Behavioral mastery: Understanding and managing human emotions and biases.
An advanced trader combines multiple dimensions — strategy, analysis, risk management, and psychology — into a cohesive trading system.
2. Algorithmic and Quantitative Trading
a. Algorithmic Trading
Algorithmic trading (or “algo trading”) uses computer programs to automatically execute trades based on predefined criteria such as price, volume, and timing. Algorithms help eliminate emotional bias and execute trades faster than human capability.
Key types of algorithmic strategies:
Trend-following algorithms: Identify momentum patterns using moving averages or breakouts.
Mean reversion algorithms: Assume prices will revert to historical averages after deviations.
Arbitrage strategies: Exploit temporary price differences between related instruments.
Market-making algorithms: Provide liquidity by continuously quoting buy and sell prices.
Statistical arbitrage: Use statistical models to detect short-term mispricings between correlated assets.
Algorithmic trading dominates global market volumes, with institutions using complex systems that analyze thousands of data points in milliseconds.
b. Quantitative Trading
Quantitative (quant) trading relies on mathematical modeling and statistical analysis to forecast price movements. Quant traders design models that identify high-probability trade setups.
Quantitative models include:
Factor models: Evaluate stocks based on fundamental factors like earnings, growth, or volatility.
Machine learning models: Use AI to detect nonlinear relationships in large datasets.
Time-series models: Predict future price movements from historical trends using ARIMA, GARCH, or Kalman filters.
Quantitative trading requires programming knowledge (Python, R, MATLAB) and a strong grasp of probability, calculus, and econometrics.
3. Technical Mastery: Advanced Charting and Indicators
a. Multi-Time Frame Analysis
Professional traders analyze price behavior across multiple time frames to align long-term trends with short-term setups. For instance, a trader may confirm an uptrend on the weekly chart and then enter trades on the 1-hour chart to optimize timing.
b. Advanced Indicators
Ichimoku Cloud: Combines support, resistance, and momentum in one view.
Volume Profile: Analyzes traded volume at each price level to identify high-liquidity zones.
Fibonacci Extensions: Predict potential price targets during strong trends.
Bollinger Band Width: Measures volatility expansion or contraction phases.
Average True Range (ATR): Quantifies market volatility for dynamic stop-loss placement.
c. Harmonic Patterns and Elliott Wave Theory
Advanced traders often use harmonic patterns (like Gartley, Bat, and Butterfly) to identify high-probability reversal zones based on Fibonacci ratios. Similarly, Elliott Wave Theory interprets market psychology through wave structures, forecasting long-term cycles of optimism and pessimism.
4. Price Action and Market Structure
While indicators are helpful, many professional traders rely heavily on price action — pure price movement without lagging indicators.
Key components include:
Supply and Demand Zones: Identify institutional order blocks where price reacts strongly.
Liquidity Pools: Areas where stop-losses cluster, often targeted by large players.
Break of Structure (BOS): A shift in market trend confirmed by price breaking a significant high or low.
Order Flow Analysis: Uses volume and bid-ask data to visualize market participant behavior.
By mastering market structure, traders can anticipate institutional activity instead of reacting to it.
5. Derivative-Based Trading Methods
Advanced traders frequently use derivatives — such as options, futures, and swaps — to manage risk and enhance returns.
a. Options Trading
Options offer strategic flexibility through structures like:
Delta-neutral strategies: Profiting from volatility (e.g., straddles, strangles).
Spreads: Combining multiple options to manage directional exposure and cost.
Covered Calls and Protective Puts: Hedging long-term investments.
b. Futures and Hedging
Futures allow traders to speculate on or hedge against price movements in commodities, indices, and currencies. Advanced traders manage leverage, margin requirements, and roll-over costs to maintain efficient positions.
c. Volatility Trading
Volatility is an asset in itself. Advanced traders use instruments like the VIX index, volatility ETFs, or implied volatility analysis to construct trades that profit from market uncertainty.
6. Statistical and Probabilistic Methods
Trading success depends on probability, not certainty. Advanced traders apply statistical techniques to quantify and manage uncertainty.
Core techniques include:
Monte Carlo simulations: Model potential trade outcomes over thousands of iterations.
Backtesting: Testing strategies on historical data to evaluate robustness.
Optimization and curve fitting: Fine-tuning parameters without overfitting.
Risk-reward ratio and expectancy: Measuring expected profit per trade over time.
Sharpe and Sortino ratios: Evaluating risk-adjusted returns.
Probability-based thinking helps traders focus on edge and consistency rather than outcome-driven emotions.
7. Automated Trading and Artificial Intelligence
AI-driven trading is the frontier of modern finance. Machine learning models can adapt and learn from new data, identifying patterns human traders might miss.
Applications of AI in trading:
Natural Language Processing (NLP): Analyzing news sentiment and social media for market signals.
Reinforcement learning: Algorithms that self-improve through simulated environments.
Neural networks: Detecting nonlinear price relationships and predicting future volatility.
Robo-advisors: Automated portfolio management systems optimizing asset allocation.
AI allows for dynamic, adaptive systems that continuously refine themselves based on performance metrics.
8. Risk Management and Position Sizing
Even the best strategy fails without proper risk control. Advanced traders use sophisticated models to preserve capital.
Risk control techniques include:
Value at Risk (VaR): Estimates potential loss under normal conditions.
Kelly Criterion: Determines optimal bet size to maximize long-term growth.
Drawdown control: Limiting capital losses through daily, weekly, or cumulative limits.
Diversification and correlation analysis: Reducing systemic risk by balancing asset exposure.
Position sizing based on volatility, confidence level, and account equity ensures consistent performance and psychological stability.
9. Behavioral Finance and Trading Psychology
Human emotions — fear, greed, overconfidence, and loss aversion — are the greatest obstacles to advanced trading success.
Advanced traders master:
Cognitive discipline: Following systems regardless of emotional impulses.
Journaling: Tracking trades to analyze patterns and improve decision-making.
Mindfulness and focus: Maintaining calm under market pressure.
Probabilistic mindset: Accepting uncertainty as part of the process.
Professional performance depends not only on technical skill but also on emotional intelligence and mental resilience.
10. Global and Macro Trading Approaches
Global markets are interconnected — interest rates, currency movements, and geopolitical events all impact prices. Advanced traders use macro trading strategies to exploit these relationships.
Examples include:
Interest rate arbitrage: Trading based on central bank policy differentials.
Currency carry trade: Borrowing in low-interest currencies to invest in high-yield ones.
Commodities and inflation plays: Using gold or oil to hedge against inflationary trends.
Intermarket analysis: Studying how equities, bonds, and commodities influence each other.
A strong understanding of macroeconomics enhances timing, positioning, and portfolio management across global markets.
11. Portfolio Construction and Risk Parity
Advanced traders think beyond individual trades — they manage portfolios as integrated ecosystems.
Modern portfolio techniques include:
Risk parity models: Allocating capital based on volatility rather than nominal value.
Dynamic rebalancing: Adjusting exposure as market conditions evolve.
Correlation clustering: Ensuring diversification across uncorrelated assets.
Performance attribution: Measuring which strategies contribute most to returns.
This systematic approach maximizes risk-adjusted growth over the long term.
12. The Role of Technology and Infrastructure
Modern trading success depends on robust infrastructure.
Advanced tools include:
Low-latency servers for high-frequency execution.
API integrations for data feeds and brokerage automation.
Backtesting platforms such as QuantConnect or MetaTrader.
Data visualization tools like Tableau or Python dashboards.
Access to real-time data, high-quality execution, and cloud-based analytics transforms strategy into actionable performance.
13. Continuous Learning and Strategy Evolution
Markets evolve — and so must traders. The best professionals constantly refine their systems.
Steps to long-term mastery:
Research: Stay updated with financial innovation and emerging technologies.
Experimentation: Test new strategies under controlled environments.
Mentorship and community: Learn from experienced traders and data scientists.
Performance review: Regularly evaluate metrics and adapt.
Trading is a lifelong pursuit of improvement and adaptation.
Conclusion
Advanced trading is not about complexity for its own sake — it’s about building a structured, data-driven, risk-managed, and psychologically stable approach to the markets. The journey from intermediate to advanced trader involves mastering the synergy between technology, analysis, and human behavior.
By combining algorithmic precision, quantitative modeling, disciplined psychology, and continuous learning, traders can transform their craft into a professional, scalable, and sustainable enterprise.
In the modern financial landscape, knowledge truly is the most powerful form of capital — and advanced trading methods are the foundation upon which lasting success is built.
Part 1 Trading Master Class With ExpertsBasic Terminology in Option Trading
Before diving deep, let’s get familiar with key terms used in options:
Call Option – Gives the buyer the right (not obligation) to buy the underlying asset at a certain price before expiry.
Put Option – Gives the buyer the right (not obligation) to sell the underlying asset at a certain price before expiry.
Strike Price – The fixed price at which the option holder can buy (for calls) or sell (for puts) the underlying asset.
Premium – The price paid to buy the option contract. This is the cost of obtaining the right.
Expiry Date – The date when the option contract expires. After this, the contract becomes invalid.

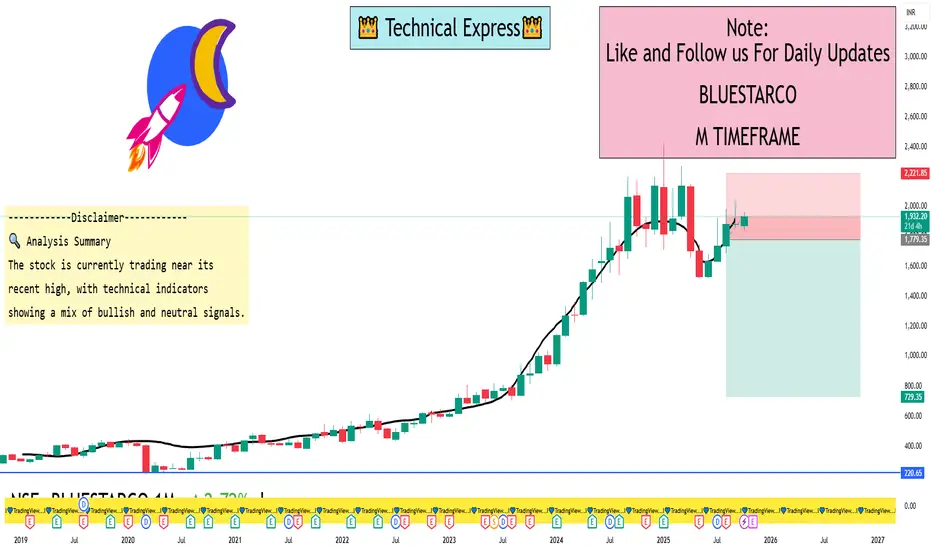
BLUESTARCO 1 Month View📈 Current Price and Trend
Current Price: ₹1,931.10
1-Month Price Change: Approximately +2.62%
52-Week Range: ₹1,521.20 – ₹2,419.95
Recent High: ₹1,964.70 on October 10, 2025
📊 Key Technical Indicators
RSI (14): 47.98 — Neutral, indicating neither overbought nor oversold conditions.
Stochastic RSI (14): 0.13 — Suggests a strong downtrend.
CCI (14): -69.38 — Indicates a downtrend.
MACD (12,26): 8.68 — Bullish crossover, suggesting upward momentum.
ADX (14): 30.75 — Indicates a strong trend.
Williams %R: -38.13 — Bullish, but not yet in the overbought zone.
ATR (14): 19.24 — High volatility.
ROC (12): 1.89 — Positive, indicating upward momentum.
Bull/Bear Power (13): 55.87 — Indicates bullish strength.
🔍 Analysis Summary
The stock is currently trading near its recent high, with technical indicators showing a mix of bullish and neutral signals. The RSI and Stochastic RSI suggest a neutral to slightly bearish short-term outlook, while the MACD, ADX, and Williams %R indicate potential for continued upward momentum. The high ATR value points to increased volatility, which traders should consider when making decisions.
SBI 1 Day View📊 Daily Technical Indicators
RSI (14-day): 73.97 — This indicates a bullish momentum, though approaching overbought territory.
Investing.com India
MACD: 1.87 — Suggests a bullish trend continuation.
Moving Averages:
5-day: ₹871.15
50-day: ₹867.06
200-day: ₹842.74
All are above current price levels, reinforcing the bullish outlook.
📈 Intraday Levels (October 10, 2025)
Current Price: ₹879.65
Expected Range: ₹861–₹865 (Resistance) | ₹855–₹850 (Support)
A breakout above ₹865 could signal further upside momentum.
A dip below ₹850 may indicate a short-term pullback.
🔍 Summary
The daily technical indicators suggest a strong buy signal for SBI. While the RSI indicates bullish momentum, it's approaching overbought levels, which traders should monitor for potential reversals. The stock is trading above key moving averages, supporting the bullish trend. Intraday levels suggest that a breakout above ₹865 could lead to further gains, whereas a decline below ₹850 might signal a short-term correction.

Decoding Market Movements with Volume ProfileWhat is Volume Profile?
Volume Profile is a graphical representation of the amount of trading volume that has occurred at various price levels over a specified period. Unlike traditional volume bars that are plotted at the bottom of a price chart (showing volume over time), Volume Profile displays volume horizontally across price levels, highlighting where the most trading activity occurred.
This is critical because it helps identify price acceptance and rejection zones — areas where traders were most or least interested in transacting. These zones often become future levels of support and resistance.
Core Components of Volume Profile
Point of Control (POC):
This is the price level at which the highest volume of trading occurred within the selected time frame. The POC acts as a “magnet” for price and often represents a fair value area where both buyers and sellers have agreed most.
Value Area (VA):
This is the range of prices that contains around 70% of the total traded volume. It indicates where the majority of trading took place and is divided into:
Value Area High (VAH): The upper boundary of the value area.
Value Area Low (VAL): The lower boundary of the value area.
Prices moving outside this range suggest either overvaluation or undervaluation in the short term.
High Volume Nodes (HVN):
These are zones with concentrated trading activity. They signify strong price acceptance and tend to act as support or resistance.
Low Volume Nodes (LVN):
These are price levels with very little trading activity, showing price rejection zones. When price revisits these areas, it often experiences quick movement due to a lack of liquidity.
How Volume Profile Differs from Traditional Volume Indicators
Traditional volume indicators, such as the volume histogram or On-Balance Volume (OBV), show how much volume occurred over time but do not indicate at which prices the volume took place. Volume Profile, on the other hand, provides a spatial context — revealing where the big players entered or exited the market.
This distinction is vital because markets are driven by institutional traders who operate at specific price levels. By analyzing these price-based volume concentrations, retail traders can align themselves with “smart money” and anticipate key turning points.
Using Volume Profile in Market Analysis
1. Identifying Market Structure
Volume Profile helps traders classify the market into balance (range-bound) and imbalance (trending) conditions.
In a balanced market, volume is evenly distributed, and the price rotates around the POC.
In an imbalanced market, volume shifts in one direction, signaling a new trend or breakout.
Recognizing these conditions early allows traders to adjust strategies — employing mean reversion in balanced phases and trend-following in imbalanced phases.
2. Spotting Support and Resistance Levels
Volume clusters (HVNs) often become key support and resistance zones. When price moves back toward these areas, it may pause or reverse, as these levels represent heavy institutional interest. Conversely, LVNs are potential breakout zones, where prices move swiftly due to a lack of opposing orders.
For example:
If the price rises above VAH with strong volume, it signals bullish conviction.
If it falls below VAL with heavy volume, it indicates bearish strength.
3. Detecting Institutional Activity
Institutions trade in large volumes, and their footprints are visible on the Volume Profile. When you see a large volume concentration forming abruptly, it’s often the result of institutional accumulation or distribution. Understanding these patterns can help traders anticipate future price moves.
For instance:
Accumulation: Heavy volume at the bottom of a range followed by upward price movement.
Distribution: Heavy volume at the top of a range followed by a downward trend.
4. Volume Profile and Trend Confirmation
When analyzing trends, Volume Profile confirms whether price movements are supported by strong participation.
In an uptrend, increasing volume at higher price levels suggests healthy demand.
In a downtrend, higher volume at lower prices confirms strong selling pressure.
If volume weakens during trend continuation, it may signal an impending reversal.
Integrating Volume Profile with Other Technical Tools
To enhance accuracy, traders often combine Volume Profile with complementary tools such as:
Moving Averages:
Identify overall trend direction, while Volume Profile reveals strong price zones within that trend.
Price Action Analysis:
Combine candlestick patterns (like pin bars or engulfing candles) with volume zones to spot high-probability entries.
Market Profile (TPO Charts):
While Volume Profile shows volume distribution, Market Profile displays time spent at each price level, offering a deeper understanding of market behavior.
Fibonacci Retracements:
When Fibonacci levels align with HVNs or LVNs, the confluence strengthens potential reversal zones.
Volume Profile Across Different Markets
Stock Market:
In equities, Volume Profile reveals where institutional buying or selling occurred. It helps traders determine entry levels during consolidations and exit points during rallies.
Futures Market:
Futures traders rely heavily on Volume Profile to identify fair value zones. Exchanges provide accurate volume data, making this tool extremely effective for intraday and positional analysis.
Forex Market:
Though Forex lacks centralized volume data, many platforms offer tick volume approximations. Even this limited data, when analyzed with price levels, gives valuable market insights.
Cryptocurrency Market:
In crypto trading, where volatility is high, Volume Profile helps traders detect zones of high liquidity and potential breakout points.
Practical Trading Strategies Using Volume Profile
1. Reversion to Mean (POC Bounce) Strategy
Wait for price to move away from POC and show exhaustion.
Enter trade when price starts reverting back toward POC.
Use VAH and VAL as targets and stop-loss zones.
2. Breakout and Retest Strategy
Identify LVN or VAL/VAH breakout levels.
Wait for the price to retest these zones with declining volume.
Enter in the direction of the breakout, using the next volume node as the target.
3. Volume Gap Play
When there’s a visible volume gap between two HVNs, it indicates a low liquidity zone.
If price enters this gap, it usually moves quickly until it reaches the next high-volume area.
4. Intraday Volume Profile Setup
Use smaller time-frame profiles (like 5-min or 15-min sessions).
Identify session POCs and value areas.
Trade pullbacks to these zones in alignment with overall market bias.
The Psychology Behind Volume Profile
Volume Profile doesn’t just show numbers — it visualizes market psychology. Every spike or dip in volume tells a story about traders’ emotions:
High-volume zones reflect equilibrium — agreement between buyers and sellers.
Low-volume zones reflect indecision or rejection — a lack of conviction.
Shifts in volume concentration reveal sentiment transitions, such as greed turning to fear or vice versa.
By interpreting these patterns, traders can anticipate how collective behavior might drive the next market phase.
Advantages of Using Volume Profile
Provides clear visual representation of where the real market interest lies.
Identifies hidden support and resistance levels ignored by conventional indicators.
Helps understand institutional footprints and market intent.
Offers flexibility across all markets and time frames.
Encourages data-driven trading decisions instead of emotional impulses.
Limitations of Volume Profile
Despite its effectiveness, traders must remain aware of its constraints:
It requires accurate volume data — not always available in decentralized markets.
Works best when combined with other technical tools.
Interpretation can be subjective; novice traders might misread key zones.
In fast-moving or news-driven markets, volume analysis may lag behind price action.
Conclusion
The Volume Profile is not just another indicator; it’s a comprehensive framework for understanding how markets truly function. By revealing the invisible dynamics of supply and demand, it allows traders to see beyond surface-level price movements. When integrated with disciplined market analysis, it becomes a strategic advantage — helping identify fair value, detect institutional participation, and forecast future price direction with greater confidence.
In today’s algorithm-driven trading environment, those who understand where and why volume accumulates can anticipate market turns before they happen. Whether you’re a short-term scalper, swing trader, or long-term investor, mastering the Volume Profile can transform your market perspective — turning raw data into actionable insight and uncertainty into opportunity.
HCLTECH 1 Week Time Frame📈 1-Week Performance Overview
Current Price: ₹1,480.00 (as of October 9, 2025)
Weekly Gain: Approximately 6.51%
📊 Recent Trading Highlights
October 8, 2025: Closed at ₹1,452.85, up 1.34% from the previous day, outperforming the BSE SENSEX Index, which declined by 0.19%.
October 7, 2025: Closed at ₹1,433.65, marking a 1.20% increase, with the SENSEX Index rising by 0.17%.
October 3, 2025: Closed at ₹1,393.25, up 0.27%, while the SENSEX Index gained 0.28%.
📉 52-Week Range
52-Week High: ₹2,011.00 (January 13, 2025)
52-Week Low: ₹1,302.75
Current Price: ₹1,480.00
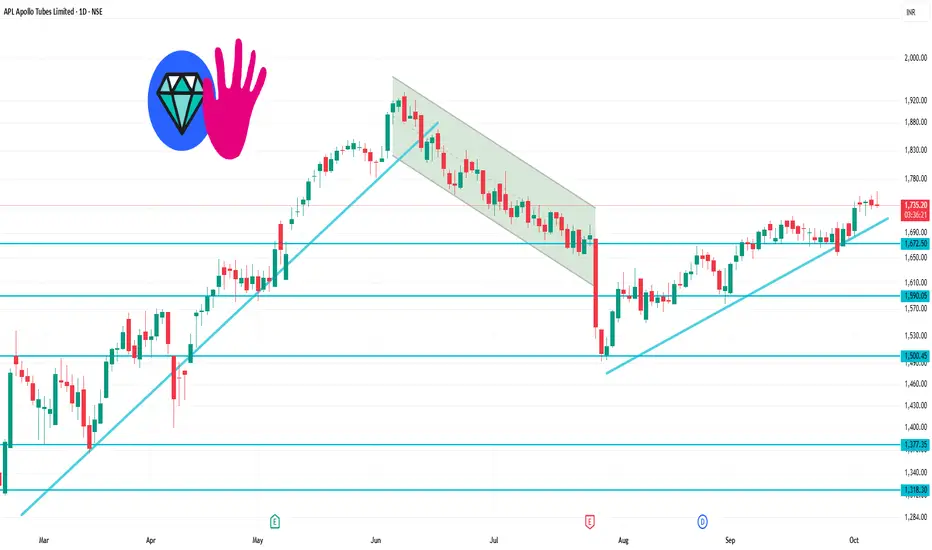
APLAPOLLO 1 Day Time Frame📊 Intraday Support & Resistance Levels
Immediate Support Levels: ₹1,717.57 and ₹1,733.63
Immediate Resistance Levels: ₹1,764.6 and ₹1,764.6
📈 Pivot Points
Standard Pivot Point: ₹1,749.57
Camarilla R3: ₹1,742.82
Fibonacci Resistance: ₹1,748.19
📉 Technical Indicators
Overall Technical Strength: Strong Buy
Moving Averages: Bullish
Oscillators: Bullish
🔮 Trend Outlook
The stock is trading above key support levels, indicating a potential continuation of the upward trend. However, it's essential to monitor for any signs of reversal or consolidation near resistance levels.
ARKADE📊 Current Price & Key Levels
Last Traded Price (LTP): ₹170.08
Pivot Point: ₹171.40
Support Levels:
S1: ₹166.79
S2: ₹163.51
S3: ₹158.90
Resistance Levels:
R1: ₹174.68
R2: ₹179.29
R3: ₹182.57
📉 Technical Indicators Overview
Relative Strength Index (RSI): 30.98 – Indicates a neutral trend.
MACD: -3.47 – Suggests a bearish momentum.
Stochastic RSI: 8.55 – Indicates oversold conditions.
Commodity Channel Index (CCI): -236.51 – Reflects a strong downtrend.
Money Flow Index (MFI): 37.48 – Indicates a downtrend.
📌 Summary
Trend: The stock is currently in a downtrend.
Key Support: ₹166.79
Key Resistance: ₹174.68
Outlook: Short-term bearish with potential for consolidation.

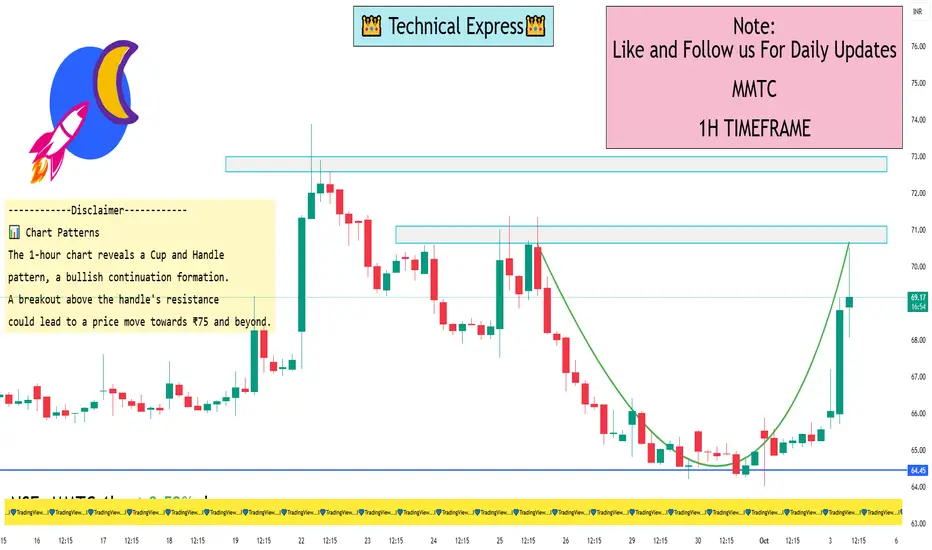
MMTC 1 Hour View📈 1-Hour Timeframe Technical Overview
Trend: The stock is exhibiting a bullish trend on the 1-hour chart, characterized by higher highs and higher lows.
Resistance Levels:
Immediate Resistance: ₹70.
Key Resistance: ₹75.
Support Levels:
Immediate Support: ₹65.
Key Support: ₹62.
Pivot Points:
Central Pivot: ₹64.84
Resistance (R1): ₹66.13
Support (S1): ₹63.55
🔧 Technical Indicators
RSI (Relative Strength Index): Currently neutral, indicating no overbought or oversold conditions.
Moving Averages:
50-period EMA: Trending upwards, supporting the bullish momentum.
200-period EMA: Also trending upwards, confirming the long-term bullish trend.
MACD (Moving Average Convergence Divergence): The MACD line is above the signal line, suggesting bullish momentum.
Volume: Increasing volume on upward movements indicates strong buying interest.
📊 Chart Patterns
The 1-hour chart reveals a Cup and Handle pattern, a bullish continuation formation. A breakout above the handle's resistance could lead to a price move towards ₹75 and beyond.
✅ Summary
MMTC Ltd is showing bullish signals on the 1-hour chart, with key resistance at ₹70 and ₹75, and support at ₹65 and ₹62. Technical indicators confirm the upward momentum. A breakout above ₹70 could signal further bullish movement.
FII and DII1. Introduction
In modern financial markets, institutional investors play a critical role in shaping the dynamics of equity, debt, and derivative markets. Among these, Foreign Institutional Investors (FIIs) and Domestic Institutional Investors (DIIs) are two dominant categories whose investments can influence market liquidity, volatility, and pricing trends. Understanding the characteristics, strategies, and regulatory frameworks governing FIIs and DIIs is essential for investors, policymakers, and financial analysts.
2. Definition and Overview
2.1 Foreign Institutional Investors (FII)
Definition: FIIs are investment entities incorporated outside a domestic market but authorized to invest in that market’s financial instruments. For example, a U.S.-based mutual fund investing in Indian equities is an FII in India.
Types of FIIs:
Pension Funds
Hedge Funds
Mutual Funds
Insurance Companies
Sovereign Wealth Funds
Objective: FIIs primarily seek to diversify portfolios internationally and capitalize on higher returns in emerging markets.
2.2 Domestic Institutional Investors (DII)
Definition: DIIs are investment entities incorporated within the domestic market and investing in local financial instruments. Examples include Indian mutual funds, insurance companies, and banks investing in Indian equities and bonds.
Types of DIIs:
Mutual Funds
Insurance Companies
Banks and Financial Institutions
Pension Funds
Objective: DIIs focus on long-term capital growth and stability, often with a fiduciary responsibility towards domestic investors.
3. Regulatory Framework
3.1 FII Regulations
FIIs operate under strict regulations in host countries to protect domestic financial markets.
In India:
Regulated by Securities and Exchange Board of India (SEBI)
Must register under SEBI’s FII framework.
Subject to limits on equity holdings in single companies.
Required to comply with Anti-Money Laundering (AML) norms.
3.2 DII Regulations
DIIs operate under domestic financial regulations.
Mutual Funds: Regulated by SEBI (Mutual Fund Regulations)
Banks & Insurance Companies: Regulated by RBI (banks) and IRDAI (insurance).
DII investments are often encouraged to stabilize markets and support government securities.
4. Role in Financial Markets
4.1 FIIs
Liquidity Provider: FIIs bring significant foreign capital, improving market liquidity.
Market Volatility: FIIs’ short-term strategies can create volatility due to sudden inflows or outflows.
Price Discovery: Global investment patterns influence asset valuations and market pricing.
Emerging Market Influence: In countries like India, FII investments impact currency, interest rates, and economic policy.
4.2 DIIs
Stabilizers: DIIs often act as counterbalances to FII volatility.
Long-Term Investment: DIIs usually adopt buy-and-hold strategies, ensuring market depth.
Domestic Growth: Their investments support domestic enterprises, infrastructure, and government securities.
5. Investment Strategies
5.1 FIIs Strategies
Arbitrage: Exploiting differences in asset prices across markets.
Momentum Investing: Riding on short-term price trends for quick gains.
Sectoral Focus: FIIs may invest heavily in high-growth sectors like IT or Pharma.
Derivatives: Using futures, options, and swaps to hedge risk or speculate.
5.2 DIIs Strategies
Value Investing: Focusing on fundamentally strong companies with long-term growth potential.
Portfolio Diversification: Reducing risk across sectors and asset classes.
Fixed-Income Instruments: Heavy investments in bonds and government securities.
Market Support: DIIs often buy during FII outflows to stabilize the market.
6. Impact on Stock Markets
6.1 On Equity Markets
FIIs can drive market rallies or corrections due to large-scale trades.
DIIs counterbalance excessive volatility, supporting sustained growth.
Example: In India, FII inflows in IT and Pharma often cause index surges, while DII inflows stabilize sectors like FMCG and Banks.
6.2 On Currency Markets
FIIs’ foreign investments influence exchange rates. Sudden FII outflows may weaken domestic currency.
DIIs typically operate in local currency instruments, minimizing forex risk.
6.3 On Bond Markets
DIIs dominate government and corporate bond markets.
FIIs also invest in sovereign debt, affecting yields and interest rate dynamics.
7. Comparative Analysis of FIIs and DIIs
Feature FII DII
Origin Foreign-based institutions Domestic institutions
Investment Horizon Short to medium term Long-term
Impact on Market Can increase volatility Stabilizes market
Currency Exposure Exposed to forex risk Typically in local currency
Regulatory Oversight SEBI (and home country regulations) SEBI, RBI, IRDAI
Influence on Economy Drives capital inflows and growth Supports domestic stability and growth
8. Challenges and Risks
8.1 FIIs
Market sensitivity to global economic conditions.
Exchange rate fluctuations.
Regulatory changes in home or host countries.
Risk of sudden capital withdrawal affecting liquidity.
8.2 DIIs
Slower response to global trends.
Limited investment resources compared to FIIs.
Regulatory restrictions on certain high-yield investments.
Potential conflict between long-term objectives and short-term market needs.
9. Case Studies and Historical Trends
9.1 India
1990s Liberalization: FII investments surged post-economic liberalization.
2008 Global Financial Crisis: FIIs pulled out capital, DIIs mitigated impact by buying equities.
Post-2020 Pandemic: FIIs initially exited, DIIs supported markets through mutual fund inflows.
9.2 Global Perspective
FIIs dominate emerging markets (India, Brazil, China), affecting stock indices.
DIIs in developed markets (U.S., U.K.) have less relative impact due to higher domestic liquidity.
10. Policy and Market Implications
Regulators monitor FII and DII flows to manage market stability.
Capital controls, investment limits, and taxation policies influence investment decisions.
Governments encourage DIIs to build domestic capital and reduce reliance on foreign funds.
11. Conclusion
FIIs and DIIs are integral to the functioning of financial markets. FIIs bring global capital, sophistication, and market depth but also volatility. DIIs provide stability, long-term growth, and support domestic economic objectives. A balanced participation of both ensures a robust, dynamic, and resilient financial system. Understanding their behavior, strategies, and impact is crucial for investors, regulators, and policymakers aiming to maintain healthy capital markets.
Introduction to Sector Rotation Strategies in Trading1. Understanding Sector Rotation
Sector rotation is a trading strategy used by investors and traders to capitalize on the cyclical movements of different sectors of the economy. The concept stems from the observation that economic conditions, business cycles, and market sentiment affect various sectors differently at different stages of the cycle. By identifying which sectors are likely to outperform in a given phase, traders can allocate capital strategically to maximize returns.
The financial markets are influenced by macroeconomic factors such as interest rates, inflation, consumer spending, corporate earnings, and geopolitical events. These factors create patterns of performance among different sectors—technology, healthcare, financials, energy, consumer discretionary, consumer staples, industrials, materials, utilities, and real estate. Sector rotation involves moving investments from one sector to another based on expected performance changes due to these macroeconomic shifts.
2. The Conceptual Basis of Sector Rotation
2.1 Economic Cycles and Sector Performance
Economic cycles consist of expansion, peak, contraction, and trough phases. Each phase favors certain sectors over others:
Expansion: During periods of economic growth, cyclical sectors such as technology, consumer discretionary, and industrials tend to outperform.
Peak: At the peak of economic activity, investors may rotate toward sectors with stable earnings and dividends, like utilities and consumer staples.
Contraction: Defensive sectors such as healthcare, utilities, and consumer staples often outperform as the economy slows.
Trough: At the bottom of the cycle, early cyclicals like financials and industrials start to recover, signaling the beginning of the next rotation cycle.
This cyclical nature forms the theoretical foundation for sector rotation strategies.
2.2 Market Sentiment and Behavioral Economics
Market sentiment, influenced by investor psychology, can drive sector rotation independently of the fundamental economic cycle. For example, bullish investor sentiment often drives funds into growth sectors like technology, while bearish sentiment increases the appeal of defensive sectors. Understanding behavioral tendencies, including fear and greed, is essential for timing sector rotations.
2.3 Relative Strength and Momentum Indicators
Technical analysts often use relative strength (RS) and momentum indicators to identify sectors with potential for outperformance. Relative strength compares the performance of one sector to another or to the broader market index. Momentum indicators, such as the Moving Average Convergence Divergence (MACD) or the Relative Strength Index (RSI), provide signals for trend reversals and optimal entry points.
3. Key Sectors and Their Roles in Rotation
To implement a sector rotation strategy, traders must understand the characteristics of each sector:
Technology: High growth, highly sensitive to economic expansion, driven by innovation and corporate earnings.
Healthcare: Defensive, stable cash flows, less sensitive to economic cycles.
Financials: Sensitive to interest rates, economic growth, and credit demand.
Energy: Influenced by commodity prices and global economic demand.
Consumer Discretionary: Cyclical, benefits from higher consumer spending.
Consumer Staples: Defensive, maintains stable performance during downturns.
Industrials: Cyclical, tied to economic growth, manufacturing, and infrastructure investment.
Materials: Tied to commodity prices and industrial demand.
Utilities: Defensive, steady dividends, low growth, preferred during economic uncertainty.
Real Estate: Sensitive to interest rates and economic cycles.
Understanding the sensitivity of each sector to macroeconomic variables is crucial for timing rotations effectively.
4. Tools and Techniques for Sector Rotation
4.1 Fundamental Analysis
Traders use fundamental analysis to assess sector health, focusing on factors like GDP growth, interest rates, inflation, and corporate earnings. Key indicators include:
Purchasing Managers’ Index (PMI)
Inflation and CPI reports
Central bank monetary policies
Employment and consumer spending data
These indicators help predict which sectors are likely to outperform in upcoming phases of the economic cycle.
4.2 Technical Analysis
Technical tools assist in identifying the right timing for sector rotations:
Sector ETFs: Exchange-traded funds provide exposure to specific sectors and allow for easy rotation.
Moving Averages: Indicate trend direction and momentum for sector indices.
Relative Strength Charts: Compare performance of sectors against the market benchmark.
MACD and RSI: Detect overbought or oversold conditions, signaling potential rotation points.
4.3 Quantitative Models
Quantitative models, including factor-based investing and algorithmic strategies, allow traders to systematically rotate sectors based on data-driven signals. Factors such as valuation ratios, growth metrics, momentum, and volatility can be incorporated into sector rotation models.
5. Benefits of Sector Rotation Strategies
Enhanced Returns: Capturing sector outperformance can generate alpha beyond broad market gains.
Risk Management: Rotating into defensive sectors during downturns reduces portfolio volatility.
Diversification: Moving across sectors balances exposure and mitigates sector-specific risks.
Flexibility: Can be applied in both long-only and long-short portfolios.
Data-Driven Decision Making: Combines fundamental, technical, and macroeconomic analysis for strategic investment.
6. Challenges in Sector Rotation
While sector rotation can be profitable, it comes with challenges:
Timing Risks: Entering or exiting a sector too early can reduce returns or create losses.
Transaction Costs: Frequent rotation may increase brokerage fees and slippage.
Complex Analysis: Requires constant monitoring of economic indicators, earnings reports, and technical trends.
Market Volatility: Unexpected events can disrupt rotation patterns.
Behavioral Biases: Traders may react emotionally, missing optimal rotation opportunities.
Successful sector rotation demands discipline, research, and a systematic approach.
7. Practical Implementation of Sector Rotation
7.1 Using Sector ETFs
Exchange-traded funds (ETFs) tracking sector indices provide an easy method for implementing rotation strategies. For example:
Technology ETF: QQQ or XLK
Healthcare ETF: XLV
Financial ETF: XLF
Investors can allocate capital dynamically based on economic signals and technical indicators.
7.2 Rotating Across Industry Sub-Sectors
Advanced traders rotate within sectors to capture micro-trends. For example, within the technology sector, semiconductors may outperform software during one cycle, while cloud computing leads in another.
7.3 Integrating with Broader Portfolio Strategy
Sector rotation can complement broader portfolio strategies like:
Value investing
Growth investing
Momentum trading
Dividend investing
Integrating sector rotation helps enhance returns and manage risks across market cycles.
8. Case Studies and Historical Examples
8.1 The 2008 Financial Crisis
During the 2008 financial crisis, defensive sectors like consumer staples, healthcare, and utilities outperformed, while cyclical sectors like financials and industrials suffered. Traders who rotated into defensive sectors preserved capital and captured relative outperformance.
8.2 Post-COVID-19 Recovery (2020–2021)
Technology and consumer discretionary sectors led the recovery due to shifts in consumer behavior and digital adoption. Investors who rotated into these growth sectors early benefited from significant gains.
8.3 Commodity Price Cycles
Energy and materials sectors often experience rotations based on commodity cycles. Traders tracking oil, gas, and metals prices can anticipate sector performance to adjust portfolio allocations accordingly.
9. Sector Rotation and Global Markets
Sector rotation is not limited to domestic markets. International investors can apply rotation strategies to:
Emerging markets
Developed markets
Regional ETFs
Global macroeconomic factors, such as interest rate differentials, trade policies, and geopolitical tensions, create opportunities for cross-border sector rotation.
10. The Future of Sector Rotation
With the rise of technology, artificial intelligence, and data analytics, sector rotation strategies are becoming more sophisticated. AI-driven models can:
Analyze vast economic datasets
Predict sector performance with machine learning
Automate rotation decisions
Reduce human bias
Furthermore, thematic investing and ESG (Environmental, Social, Governance) trends are influencing sector performance, providing new dimensions for rotation strategies.
11. Conclusion
Sector rotation is a dynamic and nuanced trading strategy that leverages economic cycles, market sentiment, and technical analysis to maximize portfolio performance. By understanding sector behavior, monitoring macroeconomic indicators, and applying disciplined entry and exit strategies, traders can enhance returns while managing risks. Though complex, sector rotation remains a powerful tool for both institutional and individual investors seeking to navigate the ever-changing landscape of financial markets.