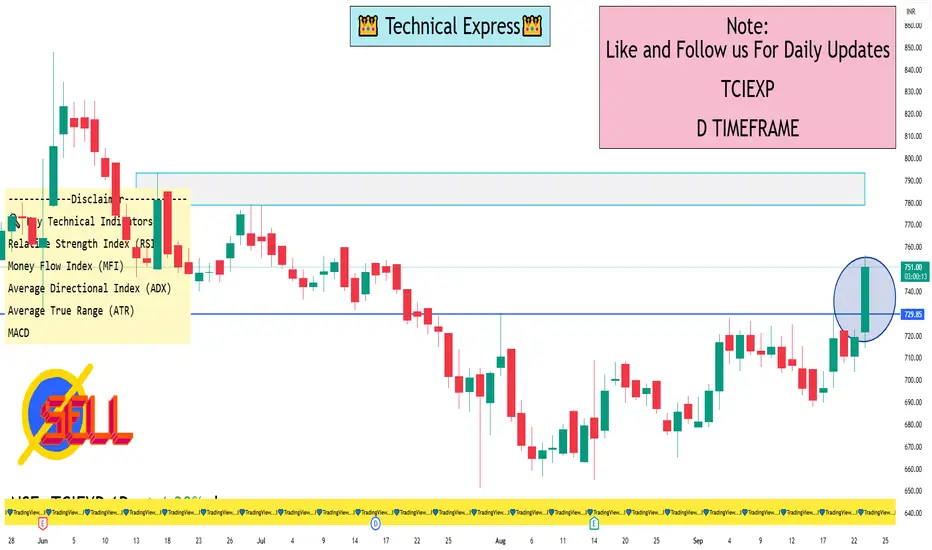
TCIEXP 1 Day View📈 Daily Pivot Levels
Calculated using standard pivot point analysis, the key levels are:
Pivot Point (PP): ₹727.12
Support Levels:
S1: ₹715.38
S2: ₹707.77
S3: ₹696.03
Resistance Levels:
R1: ₹734.73
R2: ₹746.47
R3: ₹757.21
These levels suggest that the stock is trading above the pivot point, indicating a bullish sentiment.
🔍 Key Technical Indicators
Relative Strength Index (RSI): 57.20, indicating neutral momentum.
Money Flow Index (MFI): 42.84, suggesting a balanced buying and selling pressure.
MACD: 3.07, with a signal line at 1.32, indicating a bullish crossover.
Average Directional Index (ADX): 14.91, reflecting a weak trend strength.
Average True Range (ATR): ₹19.41, indicating moderate volatility.
These indicators collectively point towards a cautious bullish outlook, with the stock showing potential for upward movement but lacking strong momentum.
📊 Fibonacci Retracement Levels
Based on recent price movements, key Fibonacci levels are:
Retracement Levels:
23.6%: ₹714.58
38.2%: ₹705.11
50%: ₹697.45
61.8%: ₹689.79
Projection Levels:
23.6%: ₹734.82
38.2%: ₹744.29
50%: ₹751.95
61.8%: ₹759.61
The stock is currently trading above the 23.6% retracement level, suggesting potential for further upward movement towards the projection levels.
📌 Summary
TCI Express Ltd. is currently trading at ₹749.40, above the pivot point of ₹727.12, indicating a bullish sentiment. The stock is showing potential for upward movement towards the resistance levels, with key indicators supporting this outlook. However, the weak ADX suggests that the trend strength is not strong, and investors should monitor the stock closely for any signs of reversal or breakout.
Tradinghub
Retail Trading vs Institutional Trading1. Introduction to Market Participants
Financial markets are arenas where buyers and sellers interact to trade securities, commodities, currencies, and other financial instruments. Participants range from small individual traders to massive hedge funds and banks. Among them, retail traders and institutional traders represent two fundamentally different types of participants:
Retail Traders: Individual investors trading their own personal capital, typically through brokerage accounts. They operate on a smaller scale and often lack access to sophisticated market tools and data.
Institutional Traders: Large entities such as hedge funds, mutual funds, pension funds, and banks that trade on behalf of organizations or clients. They have access to advanced trading platforms, proprietary research, and considerable capital.
These differences have profound implications for trading strategies, risk management, and market influence.
2. Objectives and Motivations
Retail Trading Goals
Retail traders are typically motivated by personal financial goals, which may include:
Wealth accumulation: Generating additional income for retirement or long-term financial security.
Speculation: Capitalizing on short-term market movements for potential high returns.
Learning and experience: Gaining exposure to financial markets as a personal interest.
Retail traders often seek smaller but frequent gains, and their investment horizon can vary from intraday trading to multi-year holdings. Emotional factors, such as fear and greed, play a significant role in their decision-making.
Institutional Trading Goals
Institutional traders operate with a broader set of objectives, including:
Client returns: Maximizing investment returns for clients, shareholders, or beneficiaries.
Capital preservation: Managing risk to avoid significant losses, particularly when dealing with large portfolios.
Market efficiency: Institutions often seek to exploit market inefficiencies using advanced strategies.
Unlike retail traders, institutional traders are guided by formal investment mandates, compliance requirements, and fiduciary responsibilities. Their decisions are often more systematic, data-driven, and risk-managed.
3. Scale and Capital
One of the most obvious differences between retail and institutional trading is the scale of capital:
Retail Traders: Typically trade with personal savings ranging from a few hundred to a few hundred thousand dollars. Capital limitations restrict their market influence and often their access to premium financial tools.
Institutional Traders: Operate with millions to billions of dollars in assets. This scale allows institutions to participate in large transactions without immediately affecting market prices, though their trades can still move markets in less liquid instruments.
The size of capital also affects strategies. Large orders from institutions are carefully planned and often executed in stages to avoid market disruption, whereas retail traders can often enter and exit positions more freely.
4. Access to Market Information and Tools
Access to information and tools is another critical distinction:
Retail Traders
Relatively limited access to proprietary market data.
Rely on public sources, online trading platforms, and subscription services for research.
Use simple charting tools, technical indicators, and news feeds.
Institutional Traders
Access to real-time market data feeds, professional analytics, and algorithmic trading tools.
Can employ high-frequency trading, quantitative strategies, and derivatives hedging.
Often have teams of analysts, economists, and data scientists to support trading decisions.
This access disparity often results in retail traders being reactive while institutional traders are proactive, enabling the latter to exploit market inefficiencies more efficiently.
5. Trading Strategies
Retail Trading Strategies
Retail traders typically employ a variety of strategies, including:
Day trading: Buying and selling within the same day to capitalize on small price movements.
Swing trading: Holding positions for days or weeks to benefit from intermediate-term trends.
Buy-and-hold investing: Long-term investment in stocks or ETFs based on fundamentals.
Options trading: Speculating on market movements with leveraged contracts.
Retail strategies often rely heavily on technical analysis and shorter-term trends due to smaller capital and less access to proprietary insights.
Institutional Trading Strategies
Institutional traders have a broader arsenal:
Algorithmic and high-frequency trading (HFT): Exploiting price discrepancies at millisecond speeds.
Arbitrage strategies: Taking advantage of price differences across markets or instruments.
Portfolio diversification and hedging: Balancing large positions across asset classes to manage risk.
Macro trading: Investing based on global economic trends and geopolitical developments.
Institutions combine fundamental analysis, quantitative models, and risk management frameworks, enabling them to navigate both volatile and stable markets effectively.
6. Risk Management Practices
Retail Traders
Risk management is often inconsistent and based on personal judgment.
Common tools include stop-loss orders, position sizing, and diversification, but adherence varies.
Emotional trading can exacerbate losses, especially during volatile markets.
Institutional Traders
Risk management is rigorous and regulated.
Use advanced techniques like Value at Risk (VaR), stress testing, and derivatives hedging.
Decisions are structured to meet fiduciary responsibilities, ensuring client funds are protected.
The disciplined risk management of institutions often gives them a competitive advantage over retail traders, who may rely on gut instinct rather than structured analysis.
7. Market Impact
Retail traders, due to their smaller scale, generally have minimal impact on market prices. They can, however, collectively influence trends, especially in heavily traded retail stocks or during speculative frenzies (e.g., “meme stocks”).
Institutional traders, on the other hand, can significantly move markets. Large orders can influence prices, liquidity, and volatility, especially in less liquid assets. This ability requires institutions to carefully manage order execution and market timing to avoid slippage and adverse price movement.
8. Behavioral Differences
Behavioral factors play a significant role in distinguishing retail and institutional traders:
Retail traders: More susceptible to emotional biases, such as fear, greed, overconfidence, and herd behavior. Social media and news often influence their decisions.
Institutional traders: Tend to follow disciplined processes, supported by data-driven models and compliance requirements. While human emotion exists, it is mitigated by institutional structures.
Behavioral finance studies show that retail investors often underperform compared to institutional investors due to these emotional and cognitive biases.
Conclusion
While retail and institutional traders share the same markets, their approaches, resources, and impacts are vastly different. Retail trading is more personal, flexible, and emotionally driven, whereas institutional trading is structured, capital-intensive, and data-driven. Recognizing these differences allows retail traders to make better strategic decisions, manage risk more effectively, and potentially learn from institutional practices.
For aspiring traders, the key takeaway is that knowledge, discipline, and adaptability matter more than capital size alone. By understanding institutional strategies, leveraging proper risk management, and mitigating behavioral biases, retail traders can significantly improve their odds of success.
Intraday Trading vs Swing Trading1. Introduction
The stock market is a dynamic ecosystem, attracting participants ranging from long-term investors to high-frequency traders. Among traders, Intraday and Swing Trading are common approaches, each with its unique characteristics:
Intraday Trading involves buying and selling financial instruments within the same trading day. Positions are not held overnight.
Swing Trading focuses on capturing short- to medium-term price movements, usually over several days to weeks.
Understanding the differences between these two methods is crucial because the strategies, risks, and potential rewards vary significantly. While one can offer quick profits, the other may provide more strategic opportunities with less stress.
2. Core Definitions
2.1 Intraday Trading
Intraday trading, also known as day trading, is the practice of executing multiple trades in a single day. The main objective is to profit from short-term price movements. Key features include:
Timeframe: Trades are opened and closed within the same day.
Frequency: High, often multiple trades per day.
Capital Utilization: Requires margin trading for higher leverage.
Risk Level: High, due to volatility and leverage.
Example: Buying 100 shares of a stock in the morning and selling them at a profit before the market closes.
2.2 Swing Trading
Swing trading is a style where traders aim to capture price swings over a short- to medium-term period. These swings can last from a few days to several weeks. Key features include:
Timeframe: Positions held from days to weeks.
Frequency: Lower than intraday trading, usually a few trades per week or month.
Capital Utilization: Less leverage is required; often uses actual capital.
Risk Level: Moderate, as overnight risks are present but smaller leverage reduces extreme losses.
Example: Buying a stock anticipating a 10% upward move over a week and selling it once the target is achieved.
3. Time Horizon and Trading Frequency
3.1 Time Horizon
Intraday Trading: Trades last minutes to hours. Traders focus on intra-day price movements and volatility.
Swing Trading: Trades last days to weeks. Traders focus on medium-term trends and market sentiment.
3.2 Trading Frequency
Intraday: Requires constant monitoring. Traders often execute 5–20 trades per day, depending on the strategy.
Swing: Requires less frequent monitoring. A trader might execute 2–5 trades per week or month, depending on market conditions.
Implication:
Time horizon affects risk exposure. Intraday traders avoid overnight risk but face rapid intraday volatility. Swing traders face overnight or weekend risk but can capitalize on larger moves.
4. Risk and Reward Profile
4.1 Intraday Trading Risk
High leverage amplifies both profits and losses.
Rapid price swings can lead to margin calls.
Emotional stress is significant due to fast decision-making.
Stop-losses are critical for risk management.
4.2 Swing Trading Risk
Exposure to overnight market gaps can cause unexpected losses.
Moderate leverage reduces extreme risk.
Slower pace allows for analytical decision-making.
4.3 Reward Potential
Intraday: Quick profits, but often smaller per trade. Requires high win rate.
Swing: Potentially larger profits per trade due to capturing entire price swings.
5. Capital and Leverage Requirements
5.1 Intraday Trading
Often uses leverage (margin trading) to maximize returns on small price movements.
Requires a significant understanding of risk management.
Minimum capital depends on exchange regulations; in India, traders can use 4–5x leverage in equities.
5.2 Swing Trading
Typically uses actual capital rather than heavy leverage.
Focuses on trend analysis and larger price movements.
Lower risk of forced liquidation compared to intraday trading.
6. Analytical Approach
6.1 Intraday Trading Analysis
Technical Analysis: Dominates decision-making, including:
Candlestick patterns
Moving averages
Momentum indicators (RSI, MACD)
Volume analysis
Market Sentiment: News and events can trigger short-term volatility.
Price Action: Key for identifying entry and exit points within the day.
6.2 Swing Trading Analysis
Technical Analysis: Similar tools but applied over daily or weekly charts.
Fundamental Analysis: May include earnings reports, economic data, or sectoral trends.
Trend Analysis: Swing traders identify upward or downward trends and ride the market momentum.
7. Strategies Used
7.1 Intraday Strategies
Scalping: Captures small price movements multiple times a day.
Momentum Trading: Follows strong trends driven by news or technical patterns.
Breakout Trading: Trades executed when price breaks key support/resistance levels.
Reversal Trading: Bets on short-term reversals at key levels.
7.2 Swing Trading Strategies
Trend Following: Enter trades in the direction of established trends.
Pullback/ Retracement Trading: Buy dips in an uptrend or sell rallies in a downtrend.
Breakout Trading: Focus on longer-term breakouts over days or weeks.
Fundamental Swing Trading: Use earnings, economic data, or corporate news to predict swings.
8. Tools and Technology
8.1 Intraday Tools
Real-time charts and data feeds.
Advanced order types like bracket orders, stop-loss, and take-profit.
Trading platforms with low latency execution.
News scanners and alerts for rapid decision-making.
8.2 Swing Trading Tools
Daily or weekly charts.
Technical indicators suitable for medium-term trends.
Fundamental analysis tools like financial reports, earnings calendars.
Trading journals for recording trades over days or weeks.
9. Psychological Considerations
9.1 Intraday Trading Psychology
High stress due to rapid decision-making.
Emotional discipline is critical; fear and greed can destroy profits.
Traders must avoid overtrading.
Instant gratification can be both a motivator and a trap.
9.2 Swing Trading Psychology
Patience is critical; trades take days or weeks.
Less stress than intraday trading but requires confidence in analysis.
Traders can better analyze positions and avoid impulsive trades.
Sleep-friendly approach as monitoring is less frequent.
10. Pros and Cons
10.1 Intraday Trading Pros
Quick profit potential.
No overnight risk.
High learning curve sharpens trading skills.
Can operate with smaller capital using leverage.
10.2 Intraday Trading Cons
High stress and emotional burden.
Requires constant market monitoring.
Small profits per trade need high consistency.
High transaction costs (brokerage, taxes) due to frequent trades.
10.3 Swing Trading Pros
Captures larger market moves.
Less stress compared to intraday trading.
Lower transaction costs.
Allows integration of both technical and fundamental analysis.
10.4 Swing Trading Cons
Exposure to overnight and weekend risks.
Slower profit realization.
Requires patience and discipline.
Market reversals can result in losses if trends fail.
Conclusion
Both intraday trading and swing trading are legitimate trading methods with unique advantages and challenges. Intraday trading offers rapid profits but demands constant attention, emotional control, and technical expertise. Swing trading offers more strategic opportunities with lower stress but exposes traders to overnight market risks.
The decision to pursue either depends on your risk tolerance, capital, personality, and time availability. Mastery of technical and fundamental analysis, risk management, and trading psychology is critical for success in either approach. By understanding these differences and aligning them with your personal trading style, you can develop a disciplined, profitable trading strategy.
Ethereum 1 Week View📊 Weekly Timeframe Technical Overview
On the weekly chart, ETH has recently achieved its highest weekly close in four years, signaling strong bullish momentum.
🔄 Key Support and Resistance Levels
Support Levels: The primary support zone lies between $4,150 and $4,200, with additional support around $4,000.
Resistance Levels: Immediate resistance is observed around $4,500, with stronger resistance near $4,700–$4,760 .
📈 Technical Indicators
Relative Strength Index (RSI): The 14-day RSI is approximately 51.58, indicating neutral momentum
Moving Averages: Short-term moving averages (5-day, 10-day) are above the current price, suggesting potential resistance, while longer-term averages (50-day, 100-day, 200-day) are below, indicating support
MACD: The MACD is positive, supporting a bullish outlook
🧭 Market Sentiment
Analysts are closely monitoring the Federal Open Market Committee (FOMC) meeting this week, as a dovish stance could bolster risk assets like ETH, potentially driving prices toward the $4,700–$4,800 range
📅 Price Forecast
Analytical forecasts suggest that ETH may reach approximately $4,311.84 within a week and $4,520.26 within four weeks.

Market Rotation and Its Types1. Introduction
Market rotation is a core concept in financial markets that refers to the movement of capital from one sector, asset class, or investment style to another. It is a natural outcome of the ever-changing economic, political, and financial environment. By understanding market rotations, investors and traders can anticipate trends, optimize portfolio performance, and manage risks effectively.
Market rotations are often influenced by macroeconomic conditions, monetary policy, investor sentiment, interest rate cycles, inflation trends, and geopolitical developments. They reflect the underlying shifts in investor risk appetite and the changing opportunities across different segments of the market.
Importance of Market Rotation
Enhances Investment Returns: By investing in sectors or styles that are in favor, investors can capitalize on trends before they peak.
Reduces Risk: Market rotation helps avoid sectors or assets that may underperform during certain economic phases.
Portfolio Optimization: Active investors and fund managers use rotation strategies to balance growth and defensive assets.
Economic Insight: Observing rotations provides insight into where the economy is headed, as different sectors react differently to economic cycles.
2. The Concept of Market Rotation
Market rotation can be understood as a strategic reallocation of capital across different market segments. Investors move their money based on perceived risk, expected returns, and economic cycles. These rotations are cyclical and often predictable to some extent, making them an essential tool for traders and portfolio managers.
Rotations can happen:
Between sectors (e.g., technology to energy)
Between investment styles (e.g., growth to value)
Across regions (e.g., emerging markets to developed markets)
Between asset classes (e.g., stocks to bonds or commodities)
Within market capitalizations (e.g., large-cap to small-cap)
Characteristics of Market Rotation
Cyclical: Rotations often follow the economic cycle: expansion, peak, contraction, and recovery.
Predictable to Some Extent: Historical data and economic indicators can provide clues.
Influenced by External Factors: Geopolitical events, monetary policy changes, inflation, and market sentiment play key roles.
Sector-Specific: Not all sectors respond similarly to economic changes; some outperform while others lag.
3. Types of Market Rotation
Market rotations can be broadly classified into several types. Understanding these types helps investors position themselves strategically in different market conditions.
3.1 Sector Rotation
Sector rotation occurs when capital shifts from one industry sector to another based on economic conditions or market cycles. Different sectors perform differently during different stages of the business cycle.
Economic Cycle and Sector Performance
Expansion Stage: Economic growth is strong, consumer demand is high.
Best Performing Sectors: Consumer discretionary, industrials, technology.
Why: Companies expand, invest, and consumer spending rises.
Peak Stage: Growth reaches its highest point, inflation may rise.
Best Performing Sectors: Energy, materials, financials.
Why: Rising interest rates favor financials; inflation benefits commodity-linked sectors.
Contraction Stage: Economic growth slows or falls, unemployment rises.
Best Performing Sectors: Utilities, consumer staples, healthcare.
Why: These sectors provide essential goods and services, acting as defensive investments.
Recovery Stage: Economy begins to grow after a downturn.
Best Performing Sectors: Industrials, technology, cyclicals.
Why: Increased capital expenditure and demand for goods and services spur growth.
Example of Sector Rotation:
During the 2008-2009 financial crisis, capital moved from financials and cyclicals to defensive sectors like utilities and consumer staples. Post-crisis, recovery saw a rotation back to technology, industrials, and consumer discretionary sectors.
3.2 Style Rotation
Style rotation refers to the movement of capital between different investment styles, most commonly growth and value investing.
Growth vs. Value
Growth Stocks: Companies with high expected earnings growth, often tech or emerging sectors.
Value Stocks: Companies trading at lower valuations relative to earnings, assets, or dividends.
Drivers of Style Rotation
Interest Rate Changes: Rising interest rates generally favor value over growth stocks because growth stocks have high future earnings discounted more heavily.
Economic Conditions: Economic recovery may favor growth stocks; recession may favor value stocks with stable earnings.
Investor Sentiment: Risk-on sentiment favors growth; risk-off sentiment favors value.
Example:
In 2022, inflation and interest rate hikes triggered a style rotation from growth tech stocks to value sectors like energy, financials, and industrials.
3.3 Geographic Rotation
Geographic rotation involves the movement of capital between countries or regions. Investors shift funds based on macroeconomic conditions, currency strength, and geopolitical stability.
Key Considerations
Developed vs. Emerging Markets: During risk-on periods, capital often flows into emerging markets for higher returns. In risk-off periods, funds move to safer developed markets.
Currency Movements: Strong domestic currencies can attract foreign investment; weak currencies may discourage inflows.
Political and Economic Stability: Investors prefer regions with stable governance and economic policies.
Example:
During periods of global uncertainty, investors may rotate capital from emerging markets like Brazil or India to safer markets like the US or Germany.
3.4 Asset Class Rotation
Asset class rotation is the shifting of capital between equities, bonds, commodities, and cash equivalents.
Drivers of Asset Rotation
Interest Rate Changes: Rising rates make bonds less attractive and equities more attractive in certain sectors like financials.
Inflation: Commodities often outperform during high inflation.
Risk Appetite: During uncertainty, investors rotate from equities to bonds or gold as safe havens.
Example:
In 2020, during the COVID-19 crisis, investors rotated heavily into bonds and gold, while equities suffered. As markets recovered, capital rotated back into equities, particularly tech and healthcare.
3.5 Market Capitalization Rotation
Market capitalization rotation refers to capital moving between large-cap, mid-cap, and small-cap stocks based on risk appetite and economic conditions.
Characteristics
Small-Cap Stocks: Higher growth potential but higher risk; perform well during economic expansion.
Mid-Cap Stocks: Balanced risk and growth; often outperform during early recovery.
Large-Cap Stocks: Stable and defensive; preferred during market uncertainty or downturns.
Example:
During the 2020 recovery, small-cap and mid-cap indices in India and the US outperformed large-cap indices as investors sought higher growth potential.
4. Drivers of Market Rotations
Market rotations are driven by several macroeconomic, financial, and behavioral factors:
Economic Cycles: Each stage of the business cycle favors different sectors or investment styles.
Interest Rates: Central bank policies affect discount rates and equity valuations.
Inflation Trends: Inflation favors commodities and value stocks, while low inflation favors growth stocks.
Monetary and Fiscal Policy: Quantitative easing, stimulus packages, or tightening measures shift capital allocation.
Geopolitical Events: Wars, sanctions, and political instability trigger risk-on/risk-off rotations.
Market Sentiment and Psychology: Investor optimism or fear often leads to defensive or aggressive rotations.
5. Indicators to Track Market Rotations
Sector Performance Charts: Monitor relative strength of sectors against indices.
ETF Fund Flows: Money inflows/outflows indicate where capital is rotating.
Interest Rate Spreads and Yield Curves: Signal upcoming rotation between growth and value.
Commodities and Currency Movements: Rising commodity prices may trigger rotation into energy and materials sectors.
Market Breadth Indicators: Identify which sectors or asset classes are leading or lagging.
6. Popular Rotation Patterns
Cyclical → Defensive: Seen during economic slowdowns; investors move to utilities, consumer staples, healthcare.
Growth → Value: Triggered by rising interest rates or market uncertainty.
Large-Cap → Small/Mid-Cap: Risk-on environments favor smaller, high-growth companies.
Equities → Bonds/Gold: Risk-off periods push investors into safer assets.
Commodity-Led Rotation: Inflationary trends favor metals, energy, and materials.
7. Tools and Strategies for Tracking Rotations
Relative Strength Analysis: Compare sector ETFs or indices to identify outperformers.
ETF Investing: Easy way to rotate capital across sectors without picking individual stocks.
Quantitative and AI Models: Predict sector rotation using economic indicators.
Momentum and Trend Following: Rotate into sectors with strong price momentum.
Fund Flow Analysis: Monitor institutional and retail investor activity.
8. Historical Examples of Market Rotations
2008-2009 Financial Crisis: Defensive sectors like utilities and staples outperformed; cyclicals and financials lagged.
2020 COVID-19 Crisis: Rotation from equities to bonds and gold. Post-crisis recovery saw rotation back into tech, healthcare, and consumer discretionary.
2022 Inflation and Rate Hikes: Growth stocks underperformed, value sectors and commodities led the market.
9. Advanced Topics in Market Rotation
Cross-Asset Rotations: Understanding correlations between stocks, bonds, commodities, and currencies.
Intermarket Analysis: Using bond yields, equity indices, and commodity prices to anticipate rotation.
Quantitative Models and AI Predictions: Using data-driven methods to predict rotation trends.
Behavioral Finance Insights: How fear, greed, and sentiment drive rotations.
Global Macro Rotations: Monitoring central bank policies, geopolitical events, and trade developments.
10. Conclusion
Market rotation is an essential concept in trading and investing. By understanding its types, drivers, and patterns, investors can make informed decisions, optimize portfolios, and capitalize on trends.
Sector Rotation: Aligns investments with economic cycles.
Style Rotation: Adjusts between growth and value stocks.
Geographic Rotation: Shifts capital based on regional opportunities and risks.
Asset Class Rotation: Moves funds across stocks, bonds, commodities, and cash.
Market Capitalization Rotation: Optimizes risk-reward by moving across large, mid, and small-cap stocks.
Incorporating market rotation strategies into investment planning can significantly enhance returns while managing risk, making it a vital tool for traders, fund managers, and individual investors alike.

Part 8 Trading Master Class1. Introduction to Option Trading
Financial markets are constantly evolving, offering traders and investors a wide variety of tools to manage risk, speculate on price movements, or generate income. One of the most fascinating and versatile financial instruments is the option.
Unlike buying a share of a company directly, which gives you ownership, an option gives you rights, not obligations. This small distinction makes options powerful. They can amplify profits, reduce risks, and allow traders to play multiple angles of the market.
Option trading might sound complicated at first, but once you understand the foundation, it’s like learning a new language – everything starts connecting.
2. The Basics: What Are Options?
An option is a contract between two parties – a buyer and a seller – that gives the buyer the right, but not the obligation, to buy or sell an underlying asset at a predetermined price within a set time frame.
The underlying asset could be a stock, an index, a commodity (like gold or crude oil), or even currencies.
The predetermined price is called the strike price.
The time frame is defined by the expiry date.
In simple words:
Options are like a reservation ticket. You pay a small amount now (premium) to lock in the ability to buy/sell later, but you don’t have to use it if you don’t want to.
3. Types of Options: Call and Put
There are two main types:
Call Option: Gives the buyer the right to buy the underlying asset at the strike price.
Example: You buy a call option for Reliance at ₹2500. If Reliance goes to ₹2700, you can still buy it at ₹2500, making profit.
Put Option: Gives the buyer the right to sell the underlying asset at the strike price.
Example: You buy a put option for Infosys at ₹1500. If Infosys falls to ₹1300, you can still sell it at ₹1500.
Think of calls as a bet on prices going up, and puts as a bet on prices going down.
4. Key Terminologies in Options
To understand option trading, you must master its unique vocabulary:
Strike Price: The pre-agreed price at which you can buy/sell the underlying.
Expiry Date: The date on which the option contract expires.
Premium: The price you pay to buy the option.
In-the-Money (ITM): Option has intrinsic value. (E.g., stock is above strike for calls, below strike for puts).
Out-of-the-Money (OTM): Option has no intrinsic value.
At-the-Money (ATM): Stock price and strike price are nearly the same.
Option Writer: The seller of the option, who takes the opposite side.
Lot Size: The minimum quantity you can trade in an option contract.

Part 2 Ride The Big MovesHow Options Work
Options trading works through a combination of buying and selling call and put contracts. Here's an example:
Suppose you buy a call option for a stock currently trading at ₹1,000, with a strike price of ₹1,050, expiring in one month. You pay a premium of ₹20. If the stock rises to ₹1,100:
You can exercise the option to buy the stock at ₹1,050 and sell it at ₹1,100, making a profit of ₹50 per share minus the ₹20 premium, resulting in a net gain of ₹30 per share.
If the stock price stays below ₹1,050, the option expires worthless, and your loss is limited to the premium paid (₹20).
Similarly, with a put option, if the stock falls below the strike price, you can sell it at the higher strike price, profiting from the difference.
Advantages of Options Trading
Leverage: Options allow traders to control a large position with a relatively small investment, magnifying potential profits.
Risk Management: Investors use options to hedge against unfavorable price movements in their portfolios. For instance, buying put options on a stock you own can protect against a decline in its price.
Flexibility: Options provide various strategies to profit from upward, downward, or even sideways movements in the market.
Income Generation: Writing options, especially covered calls, can generate additional income from an existing portfolio.
Risks of Options Trading
Despite their advantages, options come with risks:
Limited Time: Options expire, so timing is crucial. An option can lose all its value if the underlying asset doesn’t move as anticipated before expiration.
Complexity: Options strategies, especially involving multiple legs (like spreads, straddles, and butterflies), can be complex and require careful planning.
Leverage Risk: While leverage can amplify profits, it also magnifies losses. A wrong bet can lead to losing the entire premium or more if you’re selling options.
Popular Options Strategies
Options traders use various strategies depending on market outlook and risk tolerance:
Covered Call: Selling a call option on a stock you already own to earn premium income.
Protective Put: Buying a put option on a stock you own to guard against downside risk.
Straddle: Buying a call and put option with the same strike price and expiration to profit from volatility in either direction.
Spread Strategies: Combining multiple options to limit risk while maintaining profit potential, such as bull spreads or bear spreads.

AI Trading: Revolutionizing Financial Markets1. The Evolution of AI in Trading
Trading has evolved significantly over centuries. From the days of barter and physical stock exchanges to electronic trading and algorithmic trading, the financial markets have consistently embraced technology to improve efficiency. AI trading represents the latest stage in this evolution.
Manual Trading Era: Traders relied on intuition, experience, and basic technical analysis to make investment decisions. Decisions were slow and prone to human errors.
Electronic Trading Era: The introduction of computers allowed traders to place orders electronically, improving speed and accuracy.
Algorithmic Trading Era: Algorithms began executing pre-defined rules for buying and selling securities, such as moving average crossovers or mean-reversion strategies.
AI Trading Era: The incorporation of AI allows systems to learn from historical data, adapt to market changes, predict trends, and even understand unstructured data like news, social media sentiment, and macroeconomic reports.
AI trading represents a fundamental shift: moving from rule-based execution to intelligence-driven decision-making.
2. Core Technologies Behind AI Trading
AI trading relies on several advanced technologies. Understanding these technologies is crucial for grasping the mechanics and potential of AI-driven markets.
2.1 Machine Learning (ML)
Machine learning enables systems to learn patterns from historical data and make predictions without explicit programming. In trading, ML can identify relationships between variables like price, volume, and volatility. Key applications include:
Predicting price movements.
Forecasting market volatility.
Classifying stocks into buy/sell/hold categories.
Common ML algorithms in trading include linear regression, decision trees, support vector machines, and ensemble methods like random forests.
2.2 Deep Learning
Deep learning, a subset of ML, uses neural networks to model complex, non-linear relationships in data. Deep learning is particularly effective for:
High-frequency trading (HFT) where speed and precision are essential.
Analyzing large-scale unstructured data like images, news articles, and social media sentiment.
Detecting complex patterns in financial time series data.
Techniques like recurrent neural networks (RNNs) and long short-term memory (LSTM) networks are widely used for predicting stock prices and market trends.
2.3 Natural Language Processing (NLP)
Financial markets are influenced not just by numbers but by news, reports, tweets, and corporate statements. NLP allows AI systems to:
Interpret news headlines and articles.
Gauge market sentiment from social media.
Analyze earnings calls and financial reports.
By extracting sentiment and context from textual data, AI can anticipate market reactions before human traders even comprehend them.
2.4 Reinforcement Learning (RL)
Reinforcement learning trains AI to make decisions by rewarding profitable actions and penalizing losses. In trading, RL models simulate different market scenarios to optimize strategies over time. Applications include:
Dynamic portfolio management.
Trade execution optimization.
Strategy testing in simulated environments.
3. Types of AI Trading Strategies
AI trading strategies can be broadly categorized based on their objectives, data inputs, and execution speed.
3.1 Predictive Analytics Strategies
AI predicts future price movements using historical and real-time data. Strategies include:
Price Prediction Models: Forecasting asset prices using machine learning and time series analysis.
Volatility Forecasting: Identifying periods of high or low volatility to adjust risk exposure.
3.2 Sentiment Analysis Strategies
Using NLP, AI analyzes textual data to gauge market sentiment. For instance:
Positive news coverage of a company may trigger AI to buy its shares.
Negative tweets about economic conditions could prompt AI to reduce risk exposure.
3.3 High-Frequency Trading (HFT) Strategies
HFT involves executing thousands of trades in milliseconds. AI helps:
Identify micro-patterns in price fluctuations.
Exploit arbitrage opportunities.
Execute trades with minimal latency.
3.4 Portfolio Optimization
AI constructs and rebalances portfolios based on risk-return profiles. Using ML and RL, AI can:
Diversify across assets and sectors.
Adjust allocations in response to market shifts.
Minimize drawdowns and maximize returns.
3.5 Market Making and Arbitrage
AI can act as a market maker by continuously quoting buy and sell prices. In arbitrage, AI exploits price discrepancies across exchanges or assets, executing trades automatically to capture profits.
4. Data Sources in AI Trading
The success of AI trading depends heavily on data. AI systems analyze vast and diverse datasets, including:
Market Data: Historical and real-time price, volume, and order book data.
Economic Data: GDP, inflation, interest rates, and employment statistics.
Alternative Data: Satellite imagery, web traffic, geolocation data, and credit card transactions.
Sentiment Data: News articles, press releases, and social media posts.
Corporate Data: Financial statements, earnings reports, and insider transactions.
By integrating multiple data sources, AI creates a holistic view of the market environment.
5. Benefits of AI Trading
AI trading offers several advantages over traditional methods:
5.1 Speed and Efficiency
AI executes trades at lightning speed, far beyond human capabilities, reducing execution risk and capitalizing on fleeting opportunities.
5.2 Objectivity
Unlike human traders, AI operates without emotions. It strictly follows data-driven rules, reducing biases like fear, greed, or overconfidence.
5.3 Continuous Learning
AI systems continuously learn from market data, adapting strategies to changing conditions and improving over time.
5.4 Scalability
AI can monitor and trade thousands of assets simultaneously, which is impossible for human traders.
5.5 Predictive Power
By analyzing historical patterns, AI can forecast trends, anticipate market reactions, and enhance decision-making.
6. Challenges and Risks in AI Trading
Despite its advantages, AI trading is not without risks:
6.1 Model Overfitting
AI models trained on historical data may perform poorly in unforeseen market conditions, leading to losses.
6.2 Data Quality and Bias
AI relies on high-quality data. Inaccurate or biased data can produce flawed predictions.
6.3 Market Impact
Large AI-driven trades can unintentionally move the market, especially in illiquid securities.
6.4 Lack of Transparency
Complex AI models, particularly deep learning, can be “black boxes,” making it difficult to explain decisions to regulators or stakeholders.
6.5 Cybersecurity Risks
AI trading systems are vulnerable to hacking, manipulation, or technical failures.
7. The Future of AI Trading
The future of AI trading is promising, driven by advancements in computing power, data availability, and machine learning techniques. Emerging trends include:
Explainable AI (XAI): Enhancing transparency and trust by making AI decisions interpretable.
Integration with Blockchain: Using decentralized finance (DeFi) for faster and more secure AI-driven trades.
Quantum Computing: Potentially revolutionizing AI trading by solving complex optimization problems in seconds.
Adaptive Multi-Asset Trading: AI simultaneously managing diverse portfolios across stocks, bonds, derivatives, and digital assets.
Ethical AI Frameworks: Ensuring AI operates responsibly and aligns with human values.
As AI continues to mature, it will not just assist human traders but could redefine financial markets entirely.
8. Conclusion
AI trading marks a revolutionary shift in the world of finance. By leveraging machine learning, deep learning, NLP, and reinforcement learning, AI enables faster, more accurate, and adaptive trading strategies. While the benefits of AI trading—speed, scalability, objectivity, and predictive power—are immense, it also brings challenges related to model risk, data quality, transparency, and regulatory compliance.
The integration of AI into trading represents both an opportunity and a responsibility. Traders, institutions, and regulators must collaborate to ensure that AI-driven markets remain efficient, fair, and resilient. With proper oversight and innovation, AI trading promises to redefine the future of investing, making markets smarter, faster, and more interconnected than ever before.
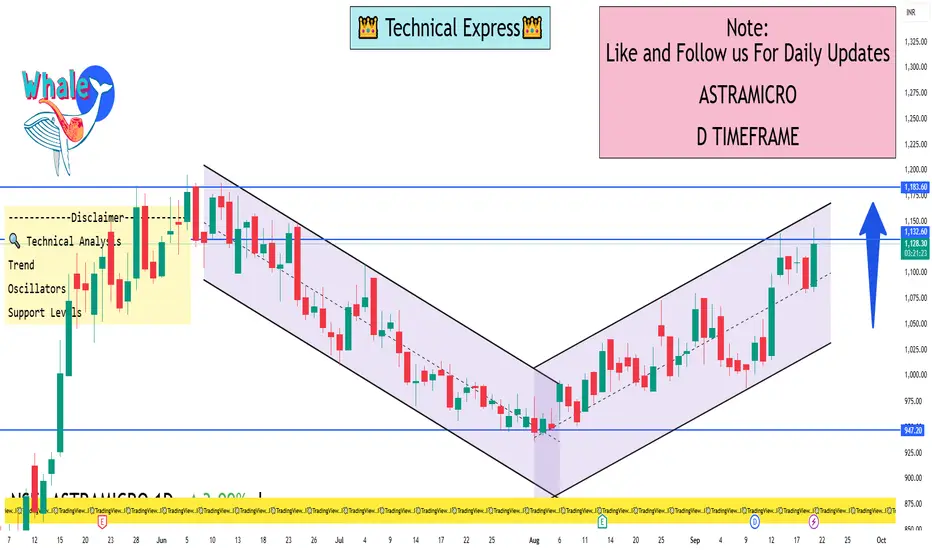
ASTRAMICRO 1 Day View📈 Current Market Overview
Current Price: ₹1,132.50
Day’s Range: ₹1,081.30 – ₹1,144.00
Previous Close: ₹1,085.00
Volume: 517,982 shares
VWAP: ₹1,123.74
52-Week Range: ₹584.20 – ₹1,195.90
The stock has gained approximately 4.77% today, outperforming the broader market indices, with the BSE Sensex down 0.50% and the Nifty 50 down 0.45%
🔍 Technical Analysis (1-Day Timeframe)
Trend: The stock is in a strong uptrend, forming higher highs and higher lows on the daily chart.
Oscillators: Indicators suggest a bullish momentum, with a "buy" signal prevailing.
Support Levels: The immediate support is around ₹1,081.30.
✅ Conclusion
Astra Microwave Products Ltd is currently in a bullish phase on the 1-day timeframe, supported by positive technical indicators and moving averages. However, given the stock's proximity to resistance levels and high volatility, it's advisable to monitor for a breakout above ₹1,144.00 for potential further gains. Traders should also consider setting a stop-loss around ₹1,034.16 to manage risk effectively.
Part 6 Institutional Trading Key Terms in Options Trading
Let’s break down the important jargon:
Call Option (CE):
Gives the right to buy an asset at a fixed price within a certain time.
Example: You buy a Reliance 2500 Call. It means you can buy Reliance shares at ₹2500 anytime before expiry, even if the market price rises to ₹2700.
Put Option (PE):
Gives the right to sell an asset at a fixed price within a certain time.
Example: You buy a Reliance 2500 Put. It means you can sell Reliance at ₹2500, even if the price falls to ₹2300.
Strike Price:
The price at which you agree to buy (call) or sell (put). Think of it as the “deal price.”
Premium:
The fee you pay to buy an option. Like a booking fee—it’s non-refundable.
Example: You buy Reliance 2500 Call for ₹50 premium. Your cost is ₹50 × 505 (lot size) = ₹25,250.
Expiry Date:
Every option has a limited life. After expiry, it becomes worthless.
In India, stock options usually expire on the last Thursday of every month. Weekly options for Nifty and Bank Nifty expire every Thursday.
In-the-Money (ITM), At-the-Money (ATM), Out-of-the-Money (OTM):
ITM Call: Strike price < current market price. (Option already profitable).
ATM Call: Strike price ≈ current price.
OTM Call: Strike price > current market price. (Not profitable yet).
How Options Work – Simple Examples
Example 1: Call Option
You expect Infosys to rise from ₹1500 to ₹1600 in the next month.
You buy a Call Option at ₹1500 strike for ₹40 premium.
Scenario 1: Infosys rises to ₹1600. You can buy at ₹1500 and sell at ₹1600 → profit ₹100 per share – ₹40 premium = ₹60 net.
Scenario 2: Infosys stays at ₹1500. No use. You lose only the premium (₹40).
Scenario 3: Infosys falls to ₹1400. You don’t exercise. Loss = only premium.
Example 2: Put Option
You expect Infosys to fall from ₹1500 to ₹1400.
You buy a Put Option at ₹1500 strike for ₹35 premium.
Scenario 1: Infosys falls to ₹1400. You sell at ₹1500 and buy back at ₹1400 → profit ₹100 – ₹35 = ₹65 net.
Scenario 2: Infosys stays at ₹1500. No use. Loss = ₹35 premium.
So, in options trading:
Maximum loss = premium paid.
Maximum profit = unlimited (for calls) or large (for puts).

Part 4 Institutional Trading Key Terms in Options Trading
Understanding options requires familiarity with several technical terms:
Strike Price: The predetermined price at which the underlying asset can be bought (call) or sold (put).
Expiration Date: The last date on which the option can be exercised. Options lose value after this date.
Premium: The price paid to purchase the option, influenced by intrinsic value and time value.
Intrinsic Value: The difference between the underlying asset’s price and the strike price if favorable to the option holder.
Time Value: The portion of the premium reflecting the probability of the option becoming profitable before expiration.
In-the-Money (ITM): A call is ITM if the underlying price > strike price; a put is ITM if the underlying price < strike price.
Out-of-the-Money (OTM): A call is OTM if the underlying price < strike price; a put is OTM if the underlying price > strike price.
At-the-Money (ATM): When the underlying price ≈ strike price.
How Options Trading Works
Options trading involves buying and selling contracts on exchanges like the National Stock Exchange (NSE) in India, or over-the-counter (OTC) markets globally. Each contract represents a fixed quantity of the underlying asset (e.g., 100 shares per contract in equity options).
The price of an option, called the option premium, is determined by multiple factors:
Underlying Price: Directly impacts call and put options differently. Calls gain value as the underlying price rises; puts gain as it falls.
Strike Price: The relationship of the strike to the current asset price defines intrinsic value.
Time to Expiration: More time increases the option’s potential to become profitable, adding to the premium.
Volatility: Higher expected price fluctuations increase the chance of profit, making options more expensive.
Interest Rates and Dividends: Slightly affect option pricing, especially for longer-term contracts.
Options traders use strategies to profit in various market conditions. They can combine calls and puts to create complex structures like spreads, straddles, strangles, and iron condors.
Popular Options Trading Strategies
Covered Call: Holding the underlying asset and selling a call option to earn premium. It generates income but limits upside potential.
Protective Put: Buying a put on a held asset to limit losses during downturns. Essentially an insurance policy.
Straddle: Buying a call and a put at the same strike price and expiry, betting on high volatility regardless of direction.
Strangle: Similar to a straddle but with different strike prices, cheaper but requires larger movements to profit.
Spreads: Simultaneously buying and selling options of the same type with different strikes or expiries to reduce risk or capitalize on specific movements. Examples include bull call spreads and bear put spreads.
These strategies allow traders to tailor risk/reward profiles, hedge portfolios, or speculate with leverage.

Part 3 Institutional Trading Role of Options in Hedging
Options are commonly used to hedge portfolios against adverse market movements:
Protective Put for Stocks: Investors holding equities can buy puts to protect against downside risks.
Portfolio Insurance: Institutions use options to safeguard large portfolios against market crashes.
Income Generation: Covered call writing allows long-term holders to earn additional income while maintaining exposure.
Hedging with options is especially popular in volatile markets where risk management is critical.
Pricing Models and Market Mechanics
Professional traders often rely on option pricing models, like the Black-Scholes model, to determine fair premiums. These models factor in:
Current price of the underlying asset
Strike price
Time to expiration
Volatility
Risk-free interest rate
Options markets operate through exchanges with standardized contracts. Market makers provide liquidity, and the bid-ask spread reflects supply-demand dynamics. In OTC markets, options can be customized to suit specific investor requirements.
Advantages of Options Trading
Leverage: Control a larger position for smaller capital.
Flexibility: Strategies for bullish, bearish, or neutral markets.
Hedging: Effective risk management tool.
Profit in Any Market: Can profit in rising, falling, or sideways markets with the right strategy.
Defined Risk (for Buyers): Limited to premium paid.
Challenges and Considerations
Complexity: Options require understanding of multiple factors affecting pricing.
Time Sensitivity: Options lose value as expiration nears.
Volatility Risk: Price swings can be unpredictable.
Liquidity Issues: Not all options have sufficient trading volume.
Psychological Pressure: Rapid movements and leverage can lead to emotional decisions.

Part 1 Ride The Big MovesIntroduction to Options Trading
Options trading is a sophisticated financial practice that allows investors to speculate on the future price movements of underlying assets or to hedge existing positions. Unlike direct stock trading, options provide the right—but not the obligation—to buy or sell an asset at a predetermined price within a specified time frame. This flexibility makes options a powerful tool in modern financial markets, used by retail traders, institutional investors, and hedge funds alike.
Options fall under the category of derivatives, financial instruments whose value is derived from an underlying asset, which can be stocks, indices, commodities, currencies, or ETFs. The two fundamental types of options are call options and put options.
1. Call and Put Options
Call Option: A call option gives the buyer the right to buy the underlying asset at a specific price (known as the strike price) before or on the option’s expiration date. Traders purchase calls when they expect the asset’s price to rise. For example, if a stock is trading at ₹100, and you buy a call option with a strike price of ₹105, you will profit if the stock price exceeds ₹105 plus the premium paid.
Put Option: A put option gives the buyer the right to sell the underlying asset at the strike price. Traders buy puts when they anticipate a decline in the asset’s price. For instance, if the same stock is at ₹100, a put option with a strike price of ₹95 becomes valuable if the stock price falls below ₹95 minus the premium paid.
The option seller (writer), on the other hand, assumes the obligation to fulfill the contract if the buyer exercises the option. Sellers earn the option premium upfront but take on potentially unlimited risk, especially in the case of uncovered calls.
2. Key Terms in Options Trading
Understanding options requires familiarity with several technical terms:
Strike Price: The predetermined price at which the underlying asset can be bought (call) or sold (put).
Expiration Date: The last date on which the option can be exercised. Options lose value after this date.
Premium: The price paid to purchase the option, influenced by intrinsic value and time value.
Intrinsic Value: The difference between the underlying asset’s price and the strike price if favorable to the option holder.
Time Value: The portion of the premium reflecting the probability of the option becoming profitable before expiration.
In-the-Money (ITM): A call is ITM if the underlying price > strike price; a put is ITM if the underlying price < strike price.
Out-of-the-Money (OTM): A call is OTM if the underlying price < strike price; a put is OTM if the underlying price > strike price.
At-the-Money (ATM): When the underlying price ≈ strike price.

Option Trading Introduction to Options Trading Strategies
Options trading is one of the most versatile areas of financial markets. Unlike buying and selling stocks directly, options allow traders to take advantage of different market conditions—whether bullish, bearish, neutral, or highly volatile. An option is essentially a financial contract that gives the buyer the right, but not the obligation, to buy (Call option) or sell (Put option) an underlying asset at a predetermined price (strike price) within a certain time (expiry).
While options can be used for speculation, hedging, or income generation, their real power lies in combining them into strategies. A strategy is nothing but a structured position involving one or more options (and sometimes the underlying asset) to create a favorable risk–reward setup.
Why are strategies important? Because trading options without a plan is risky—premiums decay, volatility shifts, and market direction can change suddenly. With the right strategy, a trader can limit losses, protect gains, and even profit when the market doesn’t move much.
This is why professional traders, institutions, and hedge funds rely on well-designed options strategies to manage risk and generate consistent returns.
Why Strategies Are Needed in Options
Options are unique compared to equities or futures. While buying a stock means unlimited upside and downside exposure, options introduce time decay (theta), volatility risk (vega), and sensitivity to price changes (delta). Without strategies, a trader might:
Lose money despite being directionally correct.
Face unlimited risk when shorting naked options.
Fail to take advantage of sideways or volatile markets.
For example: Suppose you are bullish on a stock trading at ₹100. You buy a Call at strike ₹105 for ₹5. If the stock moves to ₹110, you gain ₹5. But if it just stays at ₹100 till expiry, you lose the entire premium—even though your view wasn’t wrong about stability. This is why strategies like spreads, straddles, and condors exist—they help fine-tune payoffs.
Thus, option strategies allow you to customize risk and reward as per your market outlook.

10 Most Powerful Candlestick Patterns Every Trader Must Know1. Doji – The Candle of Indecision
A Doji looks like a cross (+). This happens when the open and close price are almost the same.
What it means: Neither buyers nor sellers are in full control. Market is confused.
When it matters:
After a strong uptrend → could mean trend reversal (bears may take control).
After a strong downtrend → could mean bulls are coming back.
Types of Doji:
Standard Doji – neutral, just indecision.
Dragonfly Doji – long bottom shadow → buyers may soon dominate.
Gravestone Doji – long upper shadow → sellers may soon dominate.
Example: Imagine a stock rises for 7 days. On the 8th day, a Doji appears. This tells traders: “The rally may be slowing. Watch carefully.”
Tip: Doji alone is not enough. Always confirm with the next candle.
2. Hammer – A Bullish Reversal Signal
A Hammer looks like a hammer: a small body at the top with a long bottom shadow (at least 2x body size).
What it means: Sellers pushed the price down, but buyers fought back strongly and closed near the top. Bulls are gaining strength.
When it matters: Appears at the bottom of a downtrend, hinting at reversal.
Example: A stock keeps falling for 5 days. On the 6th day, a hammer forms near a support level. Next day, price rises. This confirms reversal.
Tip: Best when confirmed with high trading volume.
3. Inverted Hammer – A Hidden Bullish Clue
The Inverted Hammer looks like an upside-down hammer (small body at bottom, long top shadow).
What it means: Buyers tried to push higher, sellers resisted, but buyers showed strength. Could mean downtrend is weakening.
When it matters: Appears at the end of a downtrend, often followed by bullish candles.
Example: After a long fall, an inverted hammer forms. Next day, a strong green candle appears. This often signals a reversal.
Tip: Always wait for the next candle confirmation.
4. Shooting Star – The Bearish Reversal
The Shooting Star is the opposite of the Inverted Hammer, but it appears after an uptrend.
What it means: Buyers tried to push higher, but sellers pushed the price back down. Bears are taking over.
When it matters: Appears at the top of an uptrend, often signaling reversal.
Example: A stock keeps rising. Then a shooting star forms. Next day, a red candle follows → bearish reversal confirmed.
Tip: Stronger if it forms near resistance levels.
5. Bullish Engulfing – Buyers Take Control
The Bullish Engulfing is a two-candle pattern. A small red candle is followed by a larger green candle that engulfs it completely.
What it means: Buyers are now stronger than sellers.
When it matters: Appears after a downtrend, signaling reversal to the upside.
Example: A stock keeps falling. Then a small red candle is followed by a big green one. Price often rises further.
Tip: The bigger the green candle, the stronger the signal.
6. Bearish Engulfing – Sellers Dominate
The Bearish Engulfing is the opposite of Bullish Engulfing. A small green candle is followed by a big red candle that engulfs it.
What it means: Sellers have taken control.
When it matters: Appears after an uptrend, signaling possible reversal.
Example: A stock rises for 10 days. Then a small green candle is swallowed by a big red candle. Often, this is the start of a decline.
Tip: Stronger near resistance zones.
7. Morning Star – A Strong Bullish Reversal
The Morning Star is a three-candle pattern:
Large red candle.
Small candle (red or green, showing indecision).
Large green candle closing above the midpoint of the first red candle.
What it means: Sellers are losing control, buyers are coming back strong.
When it matters: Appears at the bottom of a downtrend.
Example: A stock keeps falling. Then a red candle, a doji, and a strong green candle appear. Trend reverses upward.
Tip: Works best with high volume on the third candle.
8. Evening Star – The Bearish Counterpart
The Evening Star is the opposite of Morning Star:
Large green candle.
Small candle (indecision).
Large red candle closing below the midpoint of the first green candle.
What it means: Buyers are exhausted, sellers are taking control.
When it matters: Appears at the top of an uptrend.
Example: Stock rises for days, then a green candle, a doji, and a big red candle form. Often, this signals a bearish trend.
Tip: Stronger when seen near resistance.
9. Harami – The Subtle Warning
A Harami is when a small candle forms inside the body of the previous candle.
Bullish Harami: Small green inside large red → sellers weakening.
Bearish Harami: Small red inside large green → buyers weakening.
What it means: Trend may be slowing down. Could signal reversal or pause.
When it matters: Works best when combined with support/resistance zones.
Example: After a long rally, a large green candle appears. Next day, a small red candle forms inside it → bearish harami. Price may fall next.
Tip: Always wait for the next candle for confirmation.
10. Three White Soldiers & Three Black Crows
These are powerful multi-candle patterns.
Three White Soldiers: 3 strong green candles in a row, each closing higher.
Meaning: Strong bullish momentum.
Context: After a downtrend → reversal upward.
Three Black Crows: 3 strong red candles in a row, each closing lower.
Meaning: Strong bearish momentum.
Context: After an uptrend → reversal downward.
Example: After a fall, three green candles appear → bulls taking over.
Tip: Be cautious of overbought/oversold levels.
How to Use These Patterns in Real Trading
Candlestick patterns are powerful, but they are not magic. Here’s how to use them properly:
Combine with Support & Resistance – Patterns near key zones are stronger.
Check Volume – Higher volume makes signals more reliable.
Look at Bigger Timeframes – A pattern on daily charts is more powerful than on 5-minute charts.
Use Indicators Together – Combine with RSI, MACD, or Moving Averages.
Risk Management – Always use stop-loss. Patterns can fail.
Common Mistakes to Avoid
Trading only based on one pattern.
Ignoring overall market trend.
Not waiting for confirmation.
Forgetting volume analysis.
Overtrading every signal.
Conclusion
Candlestick patterns are the language of the market. If you learn to read them, you can understand what buyers and sellers are planning.
The 10 most powerful patterns — Doji, Hammer, Inverted Hammer, Shooting Star, Bullish Engulfing, Bearish Engulfing, Morning Star, Evening Star, Harami, and Three Soldiers/Three Crows — are essential for any trader.
They don’t guarantee profits, but when combined with support/resistance, volume, and indicators, they become a strong weapon in trading.
Remember: trading is about probabilities, not certainties. Candlesticks help tilt the odds in your favor.
Part 2 Trading Master ClassTypes of Options: Calls and Puts
There are only two fundamental types of options:
Call Option – Gives the right to buy the underlying asset at the strike price.
Example: Nifty is at 20,000. You buy a call option with a strike of 20,100. If Nifty rises to 20,400, you can buy at 20,100 and profit.
Put Option – Gives the right to sell the underlying asset at the strike price.
Example: Infosys is at ₹1,500. You buy a put option with a strike of ₹1,480. If Infosys falls to ₹1,400, you can sell at ₹1,480 and profit.
So, calls = bullish bets; puts = bearish bets.
Key Terminologies in Option Trading
To understand options, you must master the vocabulary:
Strike Price → Pre-decided price where option can be exercised.
Premium → Price paid by the option buyer to the seller.
Expiry Date → Last day the option can be exercised.
In-the-Money (ITM) → Option already has intrinsic value.
At-the-Money (ATM) → Strike price is equal to current market price.
Out-of-the-Money (OTM) → Option has no intrinsic value.
Lot Size → Options are traded in lots, not single shares. For example, Nifty lot = 50 units.

News Impact on Trading1. Why News Matters in Trading
At its core, trading is about anticipating price movements. Prices are not just numbers; they represent the collective expectations of millions of traders and investors. News acts as an input that reshapes those expectations.
For example:
If a company reports profits far above expectations, its stock price often jumps.
If a central bank hints at raising interest rates, currency and bond markets move instantly.
If political instability occurs in an oil-rich region, crude oil prices tend to rise.
Markets are forward-looking, so news influences not just the current price, but also the future outlook. This is why traders closely monitor economic calendars, press releases, and real-time news feeds.
2. The Psychology of News Reactions
The impact of news is not just about information, but also about how traders interpret and emotionally react to it.
Fear and Greed
Good news fuels greed → buying pressure.
Bad news triggers fear → selling pressure.
Herd Mentality
When big headlines break, traders often follow the crowd. This creates sharp price spikes (both up and down), even if the long-term fundamentals don’t change much.
Overreaction
Markets frequently overreact to news in the short term. Prices may rise or fall more than justified, creating opportunities for contrarian traders.
Confirmation Bias
Traders often interpret news in line with their existing positions. For example, a bullish trader may downplay negative news, while a bearish trader may exaggerate its significance.
3. Types of News That Impact Trading
Not all news is equal. Some headlines barely move markets, while others cause extreme volatility. Broadly, news can be classified into economic, corporate, political, and unexpected events.
3.1 Economic News
Economic indicators are among the most predictable yet impactful types of news.
Interest Rate Decisions (Central Banks):
When the Federal Reserve, ECB, RBI, or other central banks raise or cut rates, currencies and stocks react immediately.
Inflation Data (CPI, PPI):
High inflation often leads to tighter monetary policy → negative for stocks but positive for safe-haven assets.
Employment Reports (NFP in the US):
Strong job growth = economic strength, but too strong may signal future rate hikes.
GDP Growth Rates:
A growing economy supports equity markets; a slowdown can hurt investor sentiment.
3.2 Corporate News
Company-specific news has a direct impact on stock prices.
Earnings Announcements: Positive earnings surprises can drive rallies, while misses can cause sell-offs.
Mergers & Acquisitions: Acquisition news often boosts the target company’s stock, but the acquiring company may fall due to high costs.
Product Launches & Innovations: Tech companies often see big moves around new product releases.
Management Changes & Scandals: Leadership shifts or controversies can shake investor confidence.
3.3 Political & Geopolitical News
Elections: Market sentiment often shifts based on which party is expected to win.
Trade Wars & Tariffs: These directly affect international companies and commodity prices.
Wars or Terrorist Attacks: They trigger safe-haven buying (gold, USD, bonds) and hurt risky assets (stocks, emerging market currencies).
3.4 Natural Disasters & Unexpected Events
Pandemics (COVID-19): Triggered global market crashes in 2020.
Earthquakes, Floods, Hurricanes: Affect commodity supply chains and insurance stocks.
Cyberattacks: Impact technology and financial institutions.
3.5 Social Media & Rumors
In the digital era, tweets and online rumors also impact markets. A single tweet from Elon Musk has moved Bitcoin, Dogecoin, and Tesla’s stock price multiple times.
4. Short-Term vs Long-Term Impact
Not all news has the same duration of impact.
Short-term: Intraday volatility due to data releases (like NFP or CPI).
Medium-term: Quarterly earnings guiding the next few months.
Long-term: Geopolitical shifts, policy reforms, or technological breakthroughs.
For example, the 2008 Financial Crisis was triggered by news about subprime mortgages, but its impact lasted years. In contrast, a one-time oil inventory report may only affect crude prices for a few hours or days.
5. Market Reactions to News
5.1 Anticipation and Expectation
Often, markets price in news before it happens. For example, if traders expect a central bank to raise rates, bond yields may rise before the official announcement.
5.2 “Buy the Rumor, Sell the News”
This phenomenon describes when prices rise in anticipation of good news but fall once the news is confirmed, as traders take profits.
5.3 Volatility Spikes
During major announcements, bid-ask spreads widen, liquidity dries up, and prices can swing wildly. Day traders thrive on such volatility, while long-term investors often prefer to stay on the sidelines.
6. Case Studies of News Impact
6.1 Brexit Referendum (2016)
When the UK voted to leave the EU, the British pound crashed nearly 10% overnight — one of the biggest moves in currency history. Stocks also plunged, showing how political news reshapes global markets.
6.2 COVID-19 Pandemic (2020)
The outbreak triggered global stock market crashes, oil prices went negative for the first time, and gold surged as a safe-haven asset. This highlighted how health news can ripple across every asset class.
6.3 Elon Musk & Bitcoin
A single tweet from Musk in 2021 stating Tesla would accept Bitcoin payments pushed BTC above $60,000. Later, when he tweeted about environmental concerns, BTC dropped sharply.
6.4 US Inflation Data (2022–2023)
High US inflation numbers forced the Fed into aggressive rate hikes, causing stocks to drop while the dollar surged globally.
7. Strategies for Trading the News
Traders use several approaches to deal with news-driven markets.
7.1 News Trading (Direct Approach)
Traders enter positions immediately after a news release. Example: buying a stock right after strong earnings. Risk: prices may reverse quickly.
7.2 Event-Driven Trading
Focusing on predictable news events like Fed meetings, company earnings, or OPEC announcements. Traders prepare positions in advance based on expectations.
7.3 Sentiment Analysis
Using AI tools, Twitter feeds, or market surveys to gauge public sentiment before or after news breaks.
7.4 Hedging with Options
Options strategies (straddles, strangles) help traders profit from volatility, regardless of direction, during news events.
7.5 Avoiding the Noise
Some traders prefer to avoid trading during news events because volatility can lead to unpredictable outcomes.
8. Risks of News-Based Trading
While news creates opportunities, it also comes with risks.
Whipsaw Movements: Initial market reaction may reverse quickly.
Fake News & Rumors: Can cause false breakouts.
Information Lag: Retail traders often receive news later than institutions.
Emotional Trading: News can trigger panic buying/selling, leading to losses.
High Transaction Costs: Wide spreads during volatile moments increase costs.
9. Tools for News Trading
To trade effectively around news, traders use specialized tools:
Economic Calendars (Forex Factory, Investing.com): Show upcoming events.
Real-Time News Feeds (Bloomberg, Reuters, Dow Jones): Provide instant updates.
Social Media Trackers: Monitor sentiment shifts on Twitter, Reddit, etc.
Volatility Index (VIX): Measures expected market volatility.
Squawk Services: Audio streams of breaking news for traders.
10. News Impact Across Asset Classes
10.1 Equities
Corporate earnings, government policies, and sector-specific news drive stock prices.
10.2 Forex
Currencies react to macroeconomic data (interest rates, GDP, inflation). For example, USD strengthens on higher rates.
10.3 Commodities
Oil reacts to OPEC announcements and geopolitical news. Gold rises during crises as a safe haven.
10.4 Bonds
Highly sensitive to inflation data and central bank decisions.
10.5 Cryptocurrencies
Extremely reactive to regulatory news, tweets, and adoption announcements.
Conclusion
News is the heartbeat of financial markets. It acts as a powerful driver of price movement by influencing trader psychology, reshaping expectations, and altering fundamentals. From corporate earnings to geopolitical conflicts, news events create volatility that can be both a risk and an opportunity.
Successful traders are not just chart readers or data crunchers — they are also keen observers of global events. By understanding how news impacts markets, managing risks, and using the right strategies, traders can turn volatility into profit instead of panic.
In short, while news trading is challenging, it remains one of the most exciting and rewarding aspects of financial markets.
Divergence SecretsPsychology of an Options Trader
Trading is not just numbers, it’s emotions.
Fear and greed drive bad decisions.
Over-leverage leads to blowing up accounts.
Patience and discipline are more important than intelligence.
A successful trader has a trading plan, risk management, and psychological control.
Options in Different Markets
Options exist in many markets:
Equity Options (stocks like Reliance, TCS, Tesla, Apple).
Index Options (NIFTY, BANKNIFTY, S&P500).
Commodity Options (Gold, Crude, Agricultural products).
Forex Options (EUR/USD, USD/INR).
Crypto Options (Bitcoin, Ethereum).
Regulatory Aspects & Margin Requirements
In India, SEBI regulates options trading.
Margin requirements are high for sellers due to unlimited risk.
Exchanges like NSE and BSE provide liquidity in equity & index options.
Globally, SEC (USA) and ESMA (Europe) govern options.

Part 9 Trading Master Class With ExpertsOption Greeks in Depth
To truly master options, one must understand the Greeks. These mathematical tools describe how options react to different market factors.
Delta (Δ) – Price Sensitivity
Measures how much an option price changes if stock moves ₹1.
Call options: Delta between 0 and +1.
Put options: Delta between 0 and -1.
Example: If a call has delta = 0.5, and stock rises ₹10, option rises ₹5.
Gamma (Γ) – Acceleration of Delta
Delta itself changes as stock moves. Gamma measures this.
High gamma = higher sensitivity, riskier.
Near expiry, gamma becomes extreme.
Theta (Θ) – Time Decay
Options lose value as time passes (all else equal).
Theta tells how much an option loses daily.
Example: If theta = -5, option loses ₹5/day.
Sellers love theta (they earn decay). Buyers fear it.
Vega (ν) – Volatility Sensitivity
Measures how option reacts to 1% change in volatility.
High volatility = high premium.
Example: If Vega = 10, and implied volatility rises 1%, option price rises ₹10.
Rho (ρ) – Interest Rate Sensitivity
Measures impact of interest rate changes.
Less important in short-term trading.
📌 Takeaway: Greeks are like the dashboard of a car. Without them, you’re driving blind.

Nykaa 4 Hour View 1. TradingView Analyst Highlight
Suggests a key support zone between ₹190–₹195, forming the base of an ascending broadening wedge. If this holds, a potential upward breakout could be expected.
2. MarketScreener Technical Overview
Short-term (4-hour) trend: Bullish
Support: ~₹213.84
Resistance: ~₹226.83
3. MunafaSutra (Intraday Levels)
Short-term resistance: ₹207.84
Support: ₹200.77
Interpretation & Strategy
Intraday/Very Short-Term: Monitor support at ₹200–₹201 and resistance near ₹208. Breakout/breakdown from these lines may trigger short-term moves.
Medium-Term (4-Hour Setups): A move above ₹214 could signal continuation toward ₹227, while a break below ₹214 may draw price toward the ₹190–₹195 zone.
Key Area to Watch:
Lower Support: ₹190–₹195 — critical for longer-term setup.
Major Resistance: Around ₹227 — validated by MarketScreener resistance.

Part 6 Learn Institutional TradingPopular Option Strategies
Options can be combined to design strategies:
Beginner Strategies:
Covered Call: Hold stock + sell call option.
Protective Put: Hold stock + buy put to protect downside.
Intermediate:
Straddle: Buy call + buy put (same strike) → profit in big moves.
Strangle: Buy OTM call + OTM put → cheaper than straddle.
Spread: Buy one option, sell another to reduce cost (Bull Call Spread, Bear Put Spread).
Advanced:
Iron Condor: Sell OTM call + put, buy further OTM call + put → profit in sideways market.
Butterfly: Buy 1 ITM, sell 2 ATM, buy 1 OTM → limited risk, limited reward.
Calendar Spread: Sell near-term option, buy long-term option.
Options Trading in India
Options are traded mainly on NSE.
Index Options (Nifty, Bank Nifty, FinNifty, Sensex) dominate volume.
Weekly expiry (Thursday) has made option trading highly popular.
SEBI Rules: Margin requirements apply for writers, buyers only pay premium.
Retail boom: 90%+ of daily market volume comes from options now.
