Micro Events, Macro Impact: Trading the Small SignalsUnderstanding Micro Events
At its core, a micro event is a seemingly minor incident or signal that, while small in isolation, carries the potential to trigger broader market reactions. Examples include:
Minor corporate announcements: Small changes in guidance, product launches, or leadership shifts.
Order flow imbalances: Subtle surges in buy or sell orders within a short timeframe.
News snippets: A brief comment by an industry expert or a regulator’s minor statement.
Technical micro-signals: Price patterns like a micro double bottom, micro breakouts, or brief volume spikes.
These events might appear insignificant to the casual observer. However, when a skilled trader recognizes the context and potential ripple effects, these micro signals become invaluable for crafting trading strategies.
The Science Behind Micro Events
The efficacy of micro-event trading is grounded in market psychology and structure. Financial markets are a network of participants—retail traders, institutional investors, hedge funds, and algorithmic traders—reacting in real-time to information. Small events often act as catalysts, triggering larger market reactions because they interact with existing positions, expectations, or technical structures.
For example, consider a minor supply chain disruption reported by a mid-tier company. While the headline might not grab media attention, it could foreshadow a ripple in the entire sector if institutional traders recognize the potential impact. Markets, in essence, amplify micro events because participants react collectively, creating macro-level price movements.
Categories of Micro Events
Micro events can be classified into several categories:
Corporate Micro Events:
Insider trades, subtle guidance changes, or small earnings beats/misses.
Example: A tech company slightly upgrades its quarterly guidance due to increased orders. This could lead to sector-wide optimism and a short-term surge in related stocks.
Technical Micro Signals:
Minute chart patterns, support/resistance tests, or tiny volume surges.
Example: A stock repeatedly bouncing at a micro support level could indicate accumulation, foreshadowing a breakout.
Market Microstructure Events:
Order book imbalances, unusual options activity, or flash trades.
Example: A sudden spike in call option volume may signal bullish sentiment before broader market recognition.
News Micro Events:
Subtle statements from regulators, small policy shifts, or low-profile analyst upgrades/downgrades.
Example: A brief comment on interest rate policy may cause immediate, small-scale currency movements, which can be leveraged by nimble forex traders.
Why Micro Events Matter
Most traders chase macro events, such as inflation data, central bank decisions, or corporate earnings. These events are widely covered, highly anticipated, and often priced in by the time they occur. Micro events, on the other hand, offer early insights and first-mover advantage:
Preemptive Trading Opportunities: Spotting a micro signal allows traders to position themselves before larger market participants react.
Lower Competition: Fewer traders monitor these small signals, reducing crowded trades and potential slippage.
Precision Entry and Exit: Micro events often provide tighter risk/reward ratios since they generate localized price movements.
In short, trading micro events is about turning subtle observations into actionable strategies, capturing profits that others might miss.
Identifying Micro Events
Identifying micro events requires a combination of market awareness, technical expertise, and psychological insight. Here are the key steps:
1. Monitor Market Flow
Pay attention to order books, trade volumes, and market depth. Unusual spikes in activity, even if minor, can hint at upcoming price shifts. Algorithmic and institutional traders often act on these micro signals, creating patterns that observant traders can exploit.
2. Track Minor News and Announcements
Not all news is created equal. Small updates—like a management reshuffle, patent approval, or minor regulation—may seem inconsequential. However, if they alter future growth expectations or competitive dynamics, they can trigger a ripple effect.
3. Analyze Technical Micro Patterns
Micro-level chart patterns—visible on 1-minute, 5-minute, or intraday charts—can be critical. Examples include:
Micro double tops/bottoms
Small-scale trendline breaks
Tiny consolidation zones before breakout
These patterns often precede larger movements and can guide entry and exit points.
4. Observe Sentiment Shifts
Even minor changes in sentiment can create micro events. Social media chatter, analyst micro-reports, or investor forum discussions can signal underlying momentum. Traders with real-time sentiment analysis tools often capitalize on these subtle shifts.
Trading Strategies Based on Micro Events
Once identified, micro events can be leveraged through specialized trading strategies. Here’s a breakdown:
1. Scalping Micro-Moves
Scalping involves capturing tiny price movements within a short time frame, often minutes. Micro events, such as sudden volume surges or small technical breakouts, are ideal triggers.
Example: A sudden uptick in buying activity for a stock forming a micro support level. A scalper enters a long position, targeting a 0.5–1% price gain.
Key considerations: Tight stop losses, fast execution, and real-time monitoring are essential. Scalpers thrive on speed and precision.
2. Event-Driven Swing Trading
Swing traders can use micro events to predict short-term price swings, usually lasting days to weeks.
Example: A minor product launch by a pharmaceutical company sparks optimism in its peers. Swing traders may buy the stock in anticipation of broader sector gains.
Key considerations: Context matters. Not all micro events generate follow-through; understanding the sector and broader market sentiment is crucial.
3. Micro Arbitrage
Micro events can create temporary pricing inefficiencies between related instruments, such as stocks and options, ETFs, or derivatives.
Example: A minor earnings beat leads to an immediate but small undervaluation in options pricing. Traders can exploit the difference before markets adjust.
Key considerations: Requires quick execution and precise calculation of risk/reward ratios.
4. Sentiment-Based Micro Trading
Using micro events to gauge shifts in sentiment can be powerful. Traders track subtle cues, such as minor regulatory comments or analyst chatter, to anticipate short-term moves.
Example: A small downgrade in an energy stock triggers fear in the sector. Traders short the stock, benefiting from the immediate reaction before the broader market recalibrates.
Key considerations: Accurate sentiment measurement tools and a disciplined approach to avoid overreacting to noise.
Risk Management in Micro Event Trading
While micro events offer opportunities, they also carry risks:
False Signals: Not every minor signal leads to a significant movement. Traders must filter noise.
High Volatility: Small events can cause sharp, unpredictable spikes, especially in low-liquidity instruments.
Execution Risk: Timing is critical. Delayed execution can turn potential profits into losses.
Best Practices:
Use tight stop-losses and position sizing appropriate for the volatility.
Combine micro signals with broader trend confirmation.
Maintain discipline; not all signals are worth trading.
Keep track of historical micro event outcomes to identify patterns and improve predictive accuracy.
Case Studies: Micro Events Driving Macro Impact
Case Study 1: Technical Micro Breakout
A mid-cap technology stock repeatedly tests a micro resistance level of ₹1,500. A surge in intraday volume on a minor news update triggers a breakout. Traders who recognized the micro event early capture a 5–7% gain within a week.
Insight: Monitoring intraday technical signals alongside minor news can identify profitable trades before mainstream media reacts.
Case Study 2: Minor Corporate Announcement
A leading pharmaceutical company reports a slight improvement in production efficiency. Although the news is minor, traders anticipate better margins and sector optimism. The stock gains 10% over the next month.
Insight: Even minor guidance updates can drive sector-wide movement if they signal broader implications.
Case Study 3: Market Microstructure Imbalance
An unusual surge in call options for a retail stock indicates bullish sentiment. Within hours, the stock rises 3%, suggesting institutional traders were positioning for a minor positive catalyst.
Insight: Tracking options flow and order book imbalances can reveal hidden opportunities invisible to traditional analysis.
Tools for Micro Event Trading
Successful micro event trading relies on technology and analysis tools:
Real-Time News Aggregators: Capture minor updates instantly.
Order Book & Market Depth Tools: Identify subtle shifts in supply-demand dynamics.
Sentiment Analysis Platforms: Track investor mood from social media, news, and forums.
Intraday Technical Indicators: Use 1-minute to 15-minute charts to spot micro patterns.
Algorithmic Alerts: Custom algorithms can detect unusual volume spikes or price anomalies.
Psychological Edge
Trading micro events requires mental agility. Unlike macro trading, where moves unfold over weeks or months, micro-event trading demands fast decision-making. Traders must cultivate:
Observation Skills: Ability to spot tiny shifts before others.
Patience: Avoid overtrading on insignificant events.
Discipline: Stick to pre-defined entry/exit rules.
Adaptability: Recognize when a signal fails and exit gracefully.
Integrating Micro Event Analysis with Macro Strategy
While micro events are powerful, they are most effective when combined with macro-level awareness. For instance:
Micro events provide early warning signals for larger trends.
Macro events validate micro signals, reducing false positives.
Micro event insights allow precise entries and exits within a macro trading framework.
By combining both levels of analysis, traders can optimize risk-reward, improve timing, and enhance overall performance.
Conclusion: The Power of the Small
The mantra “Micro Events, Macro Impact” embodies a transformative approach to trading. In a market dominated by noise, the ability to discern subtle signals offers first-mover advantage, tighter risk management, and superior returns. Micro events may be small, but their impact, when understood and acted upon correctly, is magnified across the market landscape.
Successful micro-event trading is not about guessing—it’s about structured observation, disciplined execution, and strategic integration. Traders who master the art of spotting and acting on these small signals gain a competitive edge, capturing profits that many larger, slower participants overlook.
In the end, financial markets reward those who see what others don’t, act where others hesitate, and transform small sparks into macro gains. Micro events are not just minor incidents—they are the hidden engines driving major market movements.
Tradingidea
AI Trading: Revolutionizing Financial Markets1. The Evolution of AI in Trading
Trading has evolved significantly over centuries. From the days of barter and physical stock exchanges to electronic trading and algorithmic trading, the financial markets have consistently embraced technology to improve efficiency. AI trading represents the latest stage in this evolution.
Manual Trading Era: Traders relied on intuition, experience, and basic technical analysis to make investment decisions. Decisions were slow and prone to human errors.
Electronic Trading Era: The introduction of computers allowed traders to place orders electronically, improving speed and accuracy.
Algorithmic Trading Era: Algorithms began executing pre-defined rules for buying and selling securities, such as moving average crossovers or mean-reversion strategies.
AI Trading Era: The incorporation of AI allows systems to learn from historical data, adapt to market changes, predict trends, and even understand unstructured data like news, social media sentiment, and macroeconomic reports.
AI trading represents a fundamental shift: moving from rule-based execution to intelligence-driven decision-making.
2. Core Technologies Behind AI Trading
AI trading relies on several advanced technologies. Understanding these technologies is crucial for grasping the mechanics and potential of AI-driven markets.
2.1 Machine Learning (ML)
Machine learning enables systems to learn patterns from historical data and make predictions without explicit programming. In trading, ML can identify relationships between variables like price, volume, and volatility. Key applications include:
Predicting price movements.
Forecasting market volatility.
Classifying stocks into buy/sell/hold categories.
Common ML algorithms in trading include linear regression, decision trees, support vector machines, and ensemble methods like random forests.
2.2 Deep Learning
Deep learning, a subset of ML, uses neural networks to model complex, non-linear relationships in data. Deep learning is particularly effective for:
High-frequency trading (HFT) where speed and precision are essential.
Analyzing large-scale unstructured data like images, news articles, and social media sentiment.
Detecting complex patterns in financial time series data.
Techniques like recurrent neural networks (RNNs) and long short-term memory (LSTM) networks are widely used for predicting stock prices and market trends.
2.3 Natural Language Processing (NLP)
Financial markets are influenced not just by numbers but by news, reports, tweets, and corporate statements. NLP allows AI systems to:
Interpret news headlines and articles.
Gauge market sentiment from social media.
Analyze earnings calls and financial reports.
By extracting sentiment and context from textual data, AI can anticipate market reactions before human traders even comprehend them.
2.4 Reinforcement Learning (RL)
Reinforcement learning trains AI to make decisions by rewarding profitable actions and penalizing losses. In trading, RL models simulate different market scenarios to optimize strategies over time. Applications include:
Dynamic portfolio management.
Trade execution optimization.
Strategy testing in simulated environments.
3. Types of AI Trading Strategies
AI trading strategies can be broadly categorized based on their objectives, data inputs, and execution speed.
3.1 Predictive Analytics Strategies
AI predicts future price movements using historical and real-time data. Strategies include:
Price Prediction Models: Forecasting asset prices using machine learning and time series analysis.
Volatility Forecasting: Identifying periods of high or low volatility to adjust risk exposure.
3.2 Sentiment Analysis Strategies
Using NLP, AI analyzes textual data to gauge market sentiment. For instance:
Positive news coverage of a company may trigger AI to buy its shares.
Negative tweets about economic conditions could prompt AI to reduce risk exposure.
3.3 High-Frequency Trading (HFT) Strategies
HFT involves executing thousands of trades in milliseconds. AI helps:
Identify micro-patterns in price fluctuations.
Exploit arbitrage opportunities.
Execute trades with minimal latency.
3.4 Portfolio Optimization
AI constructs and rebalances portfolios based on risk-return profiles. Using ML and RL, AI can:
Diversify across assets and sectors.
Adjust allocations in response to market shifts.
Minimize drawdowns and maximize returns.
3.5 Market Making and Arbitrage
AI can act as a market maker by continuously quoting buy and sell prices. In arbitrage, AI exploits price discrepancies across exchanges or assets, executing trades automatically to capture profits.
4. Data Sources in AI Trading
The success of AI trading depends heavily on data. AI systems analyze vast and diverse datasets, including:
Market Data: Historical and real-time price, volume, and order book data.
Economic Data: GDP, inflation, interest rates, and employment statistics.
Alternative Data: Satellite imagery, web traffic, geolocation data, and credit card transactions.
Sentiment Data: News articles, press releases, and social media posts.
Corporate Data: Financial statements, earnings reports, and insider transactions.
By integrating multiple data sources, AI creates a holistic view of the market environment.
5. Benefits of AI Trading
AI trading offers several advantages over traditional methods:
5.1 Speed and Efficiency
AI executes trades at lightning speed, far beyond human capabilities, reducing execution risk and capitalizing on fleeting opportunities.
5.2 Objectivity
Unlike human traders, AI operates without emotions. It strictly follows data-driven rules, reducing biases like fear, greed, or overconfidence.
5.3 Continuous Learning
AI systems continuously learn from market data, adapting strategies to changing conditions and improving over time.
5.4 Scalability
AI can monitor and trade thousands of assets simultaneously, which is impossible for human traders.
5.5 Predictive Power
By analyzing historical patterns, AI can forecast trends, anticipate market reactions, and enhance decision-making.
6. Challenges and Risks in AI Trading
Despite its advantages, AI trading is not without risks:
6.1 Model Overfitting
AI models trained on historical data may perform poorly in unforeseen market conditions, leading to losses.
6.2 Data Quality and Bias
AI relies on high-quality data. Inaccurate or biased data can produce flawed predictions.
6.3 Market Impact
Large AI-driven trades can unintentionally move the market, especially in illiquid securities.
6.4 Lack of Transparency
Complex AI models, particularly deep learning, can be “black boxes,” making it difficult to explain decisions to regulators or stakeholders.
6.5 Cybersecurity Risks
AI trading systems are vulnerable to hacking, manipulation, or technical failures.
7. The Future of AI Trading
The future of AI trading is promising, driven by advancements in computing power, data availability, and machine learning techniques. Emerging trends include:
Explainable AI (XAI): Enhancing transparency and trust by making AI decisions interpretable.
Integration with Blockchain: Using decentralized finance (DeFi) for faster and more secure AI-driven trades.
Quantum Computing: Potentially revolutionizing AI trading by solving complex optimization problems in seconds.
Adaptive Multi-Asset Trading: AI simultaneously managing diverse portfolios across stocks, bonds, derivatives, and digital assets.
Ethical AI Frameworks: Ensuring AI operates responsibly and aligns with human values.
As AI continues to mature, it will not just assist human traders but could redefine financial markets entirely.
8. Conclusion
AI trading marks a revolutionary shift in the world of finance. By leveraging machine learning, deep learning, NLP, and reinforcement learning, AI enables faster, more accurate, and adaptive trading strategies. While the benefits of AI trading—speed, scalability, objectivity, and predictive power—are immense, it also brings challenges related to model risk, data quality, transparency, and regulatory compliance.
The integration of AI into trading represents both an opportunity and a responsibility. Traders, institutions, and regulators must collaborate to ensure that AI-driven markets remain efficient, fair, and resilient. With proper oversight and innovation, AI trading promises to redefine the future of investing, making markets smarter, faster, and more interconnected than ever before.
Smart Money Secrets: Unlocking the Strategies of Market Insiders1. Understanding Smart Money
Smart money refers to capital controlled by institutional investors, hedge funds, central banks, high-net-worth individuals, or other financial entities that have access to superior information, resources, and analytical tools. Unlike retail traders, who often react emotionally to market events, smart money acts strategically, often positioning itself ahead of major market moves.
Key Characteristics of Smart Money
Informed Decision-Making: Smart money is guided by deep research, access to non-public or early public information, and advanced analytics.
Long-Term Strategy: While retail traders may chase short-term gains, smart money focuses on sustainable trends and risk-adjusted returns.
Market Influence: Large trades by institutional investors can move entire markets, influencing liquidity, price trends, and volatility.
Contrarian Behavior: Often, smart money goes against public sentiment, buying when retail panic sells and selling when retail greed drives prices up.
The essence of smart money is that it is strategically positioned, informed, and patient, making it a crucial concept for anyone seeking to understand market dynamics.
2. How Smart Money Moves
Smart money doesn’t just jump in randomly; its movements are deliberate, carefully calculated, and often hidden until the right moment.
a. Accumulation Phase
This is when smart money quietly starts buying a stock or asset without attracting attention. Retail traders may not notice, and prices may remain relatively flat. The goal is to accumulate a significant position at favorable prices.
Indicators of accumulation:
Increasing volume without major price movement.
Gradual upward trend after a prolonged downtrend.
Strong institutional buying reported in filings (e.g., 13F filings in the U.S.).
b. Markup Phase
Once enough positions are accumulated, smart money begins to push prices higher. This phase attracts retail traders and media attention. Prices may accelerate as momentum builds.
Indicators of markup:
Rising volume coinciding with price increase.
Breakouts above previous resistance levels.
Positive news and analyst upgrades (sometimes intentionally leaked).
c. Distribution Phase
Smart money slowly exits its positions, often selling to late-coming retail traders who are driven by hype. Despite the selling, the market may still appear bullish.
Indicators of distribution:
Volume spikes with minimal price change (selling into demand).
Repeated price rejection at key resistance levels.
Contradictory market sentiment (euphoria among retail investors).
d. Markdown Phase
Finally, the market corrects sharply as smart money has exited, leaving retail traders exposed. This phase often follows peaks in media coverage and public attention.
Indicators of markdown:
Price declines with increasing volume.
Negative news amplifying fear and panic selling.
Technical breakdowns through key support levels.
3. Tools to Track Smart Money
Identifying smart money movements requires using both technical and fundamental tools. Here are some widely used methods:
a. Volume Analysis
Volume spikes often indicate institutional activity. Unlike retail traders who trade in smaller sizes, large trades by institutions create noticeable volume patterns.
On-Balance Volume (OBV) and Volume Weighted Average Price (VWAP) can reveal buying or selling pressure not immediately visible in price charts.
b. Commitment of Traders (COT) Reports
COT reports, available for commodities and futures markets, show the positions of commercial and non-commercial traders. Sharp increases in commercial positions often signal smart money entering the market.
c. Options Market Activity
Unusual activity in call and put options may indicate that insiders or institutions are hedging large trades or anticipating significant moves.
Open interest changes and implied volatility spikes are useful signals.
d. Insider Trading Filings
In publicly traded companies, insider buying or selling can offer clues about smart money sentiment. While insiders may trade for personal reasons, consistent buying from executives can be a strong bullish signal.
e. Dark Pools
Large institutional trades are sometimes executed in private exchanges called dark pools to avoid affecting public prices. Tracking dark pool activity can give insights into hidden accumulation or distribution.
4. Psychology Behind Smart Money
Understanding smart money isn’t just about charts or filings—it’s also about human behavior and market psychology.
Fear and Greed: Retail traders often act on emotional impulses. Smart money exploits these emotions, buying when others fear and selling when others greed.
Patience and Discipline: Smart money waits for the right setup, unlike retail traders who chase immediate profits.
Contrarian Thinking: Going against the crowd is often a hallmark of smart money. Identifying overbought or oversold conditions allows them to capitalize on market sentiment extremes.
5. Strategies to Follow Smart Money
While replicating institutional strategies directly can be challenging due to scale and access, retail traders can learn and adapt techniques inspired by smart money principles.
a. Trend Following
Identify accumulation zones through volume and price analysis.
Ride trends in the markup phase while managing risk.
Avoid panic during minor corrections, focusing on broader smart money-driven trends.
b. Contrarian Investing
Look for areas where retail sentiment is extremely bullish (potential distribution) or extremely bearish (potential accumulation).
Use indicators like Fear & Greed Index, social media sentiment, and retail positioning metrics.
c. Risk Management
Smart money is always risk-aware. Proper position sizing, stop-loss strategies, and portfolio diversification help protect against unexpected moves.
Using tools like options for hedging can replicate professional risk management approaches.
d. Multi-Timeframe Analysis
Smart money operates across multiple timeframes—from intraday moves to multi-year positions.
Combining short-term and long-term charts can reveal where institutional positions are being built and unwound.
6. Common Smart Money Indicators
Several technical and market indicators are considered proxies for smart money activity:
Volume-Price Trend (VPT): Combines volume and price movement to indicate accumulation or distribution.
Accumulation/Distribution Line: Highlights whether a stock is being accumulated (bought) or distributed (sold).
Money Flow Index (MFI): A volume-weighted RSI that can reveal hidden buying/selling pressure.
VWAP (Volume Weighted Average Price): Tracks the average price weighted by volume—smart money often buys below VWAP and sells above it.
Conclusion
The secrets of smart money are not about mystical insider knowledge—they are about observation, discipline, and strategy. By studying market behavior, volume patterns, institutional filings, and psychological trends, retail traders can gain insights into the movements of the largest and most informed market players. While mimicking smart money directly is impossible for most individuals, understanding their methods, motives, and timing can provide a strategic edge, helping you make more informed and confident investment decisions.
Smart money strategies emphasize preparation, patience, and precision. By applying these principles consistently, retail traders can shift from reactive decision-making to proactive, informed, and strategic market engagement.
Managing Market Volatility Through Smart Trade ExecutionUnderstanding Market Volatility
Before delving into trade execution, it is essential to understand what drives market volatility. Volatility refers to the degree of variation in the price of a security or market index over a given period. High volatility indicates large price swings, while low volatility suggests stability.
Key Drivers of Volatility
Macroeconomic Factors: Interest rate changes, inflation data, GDP growth, and employment figures can cause sharp market reactions. For example, an unexpected hike in interest rates by a central bank can trigger sudden sell-offs in equities.
Geopolitical Events: Political instability, trade disputes, and conflicts often lead to market uncertainty. These events may not directly affect fundamentals but can create panic-driven price movements.
Earnings Announcements: Quarterly earnings reports can lead to significant stock-specific volatility, particularly when results deviate from analyst expectations.
Liquidity Conditions: Thinly traded securities or markets with low liquidity are more prone to extreme price swings.
Market Sentiment and Psychology: Fear and greed are powerful forces. Herd behavior and panic selling amplify volatility, creating both risk and opportunity.
Volatility is not inherently negative. Traders often thrive in volatile markets because price swings can create opportunities for profit—but only if executed with precision.
The Importance of Smart Trade Execution
Trade execution refers to the process of placing and completing buy or sell orders in the market. Smart execution is more than just entering an order; it involves strategically planning when, how, and at what price the trade is executed to minimize risk and maximize efficiency.
Key benefits of smart trade execution include:
Reduced Market Impact: Large orders executed without strategy can move the market against the trader. Smart execution breaks orders into smaller chunks or uses algorithms to minimize price disruption.
Lower Transaction Costs: Strategic execution can reduce costs like bid-ask spreads, slippage, and commissions.
Enhanced Risk Management: By using techniques like limit orders or conditional orders, traders can control exposure and avoid being caught on the wrong side of sudden volatility.
Improved Profitability: Capturing favorable entry and exit points allows traders to take advantage of volatility instead of being hurt by it.
Core Strategies for Managing Volatility Through Trade Execution
Effective trade execution during volatile periods involves a combination of planning, technology, and disciplined decision-making. Here are the core strategies:
1. Algorithmic Trading
Algorithmic trading involves using computer programs to execute orders based on pre-defined rules. These rules may include timing, price, volume, or other market conditions.
Benefits in Volatile Markets:
Precision and Speed: Algorithms can react to market changes faster than humans, executing trades in milliseconds.
Reduced Emotional Bias: Volatile markets often trigger fear or greed, but algorithms stick to the plan.
Customizable Execution Strategies: Traders can use algorithms for Volume Weighted Average Price (VWAP), Time Weighted Average Price (TWAP), or other execution tactics that minimize market impact.
2. Use of Limit Orders
Limit orders allow traders to set a maximum buying price or minimum selling price, providing control over execution.
Advantages:
Protects against unexpected price swings.
Ensures that trades are executed at desired levels.
Reduces the risk of slippage in volatile conditions.
Example: A trader wants to buy shares of a volatile stock priced around ₹500. Instead of placing a market order, they set a limit order at ₹495. If the market dips, the order executes at or below ₹495, preventing overpaying.
3. Risk-Based Position Sizing
Position sizing involves determining the amount of capital allocated to each trade based on risk tolerance and market conditions.
In Volatile Markets:
Reduce position size to manage exposure.
Increase diversification to avoid concentrated risk.
Use risk/reward ratios to guide entry and exit points.
Practical Tip: Traders often risk only 1-2% of their total capital per trade in highly volatile conditions to preserve capital.
4. Stop-Loss and Conditional Orders
Stop-loss orders automatically exit positions when a security reaches a predetermined price. Conditional orders, like stop-limit or trailing stops, provide more sophisticated control.
Benefits:
Prevents catastrophic losses during sudden market swings.
Allows traders to lock in profits automatically.
Reduces the need for constant market monitoring.
Example: In a volatile market, a stock trading at ₹1,000 could quickly drop to ₹900. A stop-loss order at ₹950 automatically exits the position, protecting the trader from larger losses.
5. Diversification Across Assets and Instruments
Diversification is a traditional risk management tool that works well in volatile markets. By spreading exposure across multiple assets—equities, commodities, currencies, or derivatives—traders reduce the impact of adverse moves in any single instrument.
Advanced Approach:
Use hedging strategies such as options or futures to protect positions.
Implement pairs trading, where gains in one asset offset losses in another.
Rotate positions between low-volatility and high-volatility assets based on market cycles.
6. Real-Time Market Data and Analytics
Having access to high-quality, real-time data is critical for smart execution. Price feeds, order book data, and market depth provide insights into liquidity, momentum, and potential price swings.
Advantages:
Identify support and resistance levels in volatile conditions.
Anticipate liquidity gaps that could affect execution.
Adjust trade strategies dynamically based on live market information.
Example: A trader notices that a sudden spike in volume is concentrated in a few price levels. Using this information, they can place limit orders at levels that maximize execution probability while minimizing slippage.
7. Dynamic Hedging
Hedging involves taking positions that offset potential losses in an existing portfolio. In volatile markets, dynamic hedging adjusts hedge positions continuously based on changing market conditions.
Common Techniques:
Options hedging to limit downside risk.
Futures contracts to lock in prices.
Cross-asset hedging, such as balancing equity exposure with commodity or currency positions.
8. Psychological Discipline and Execution Routine
Volatility tests a trader’s mental discipline. Even the best execution strategies fail if emotions dominate decision-making.
Key Practices:
Stick to pre-defined execution rules and risk parameters.
Avoid impulsive trades during sharp market moves.
Review trades post-execution to refine strategies and improve performance.
Technology and Tools for Smart Execution
Modern trading is heavily technology-driven. Smart execution relies on tools that optimize order placement, monitor market conditions, and automate risk management.
1. Trading Platforms
Advanced trading platforms offer features like algorithmic trading, conditional orders, market scanning, and portfolio management.
2. Execution Management Systems (EMS)
EMS are designed for professional traders to manage high-volume orders across multiple markets and venues efficiently. They optimize order routing and reduce execution costs.
3. Market Analytics and AI
Artificial intelligence and machine learning algorithms analyze historical and real-time market data to identify patterns and predict short-term volatility. This information can be integrated into execution strategies.
4. Low-Latency Infrastructure
Speed is critical in volatile markets. Low-latency connections to exchanges and co-located servers enable faster order execution, reducing slippage and improving profitability.
Best Practices for Managing Volatility Through Execution
Plan Before You Trade: Define entry, exit, and risk parameters before market opens.
Use Technology Wisely: Integrate algorithmic strategies and analytics tools.
Control Position Size: Adjust exposure based on market conditions.
Diversify: Spread risk across instruments and asset classes.
Stay Disciplined: Avoid emotional trading; stick to pre-defined rules.
Continuously Monitor: Track execution performance and adjust strategies dynamically.
Conclusion
Managing market volatility is both an art and a science. While volatility introduces uncertainty, it also creates opportunities for informed traders and investors. Smart trade execution—leveraging technology, disciplined strategies, and risk management—serves as the bridge between potential risk and profitable outcomes.
By understanding market drivers, using advanced execution techniques, and maintaining psychological discipline, traders can navigate volatile markets with confidence, protect capital, and achieve long-term success. In today’s fast-moving financial landscape, mastering smart trade execution is not just advantageous; it is essential.
Volatility may never disappear from financial markets, but with intelligent execution, it becomes a tool for growth rather than a source of fear.
VodafoneIDEA (Opportunity during consolidation)Hi everyone
Welcome to intelligent investor, we provide market insights by synchronising and combining all the price action waves from different time frames and gives you single trend.
Degree Information

Option Trading 1. Introduction to Options
In the world of financial markets, investors and traders are always looking for instruments that allow them flexibility, leverage, and opportunities to manage risks. One of the most popular derivatives that provide such opportunities is options trading.
An option is a financial contract between two parties: a buyer and a seller. The buyer of the option gets the right, but not the obligation, to buy or sell an underlying asset (like stocks, indices, or commodities) at a predetermined price within a specified time. The seller (also called the option writer) has the obligation to fulfill the contract if the buyer decides to exercise it.
This feature—right without obligation—is what makes options unique compared to other financial instruments.
2. Basic Terminology
Before diving deeper, let’s clarify some key terms:
Call Option: Gives the buyer the right to buy the underlying asset at a fixed price (strike price).
Put Option: Gives the buyer the right to sell the underlying asset at a fixed price.
Strike Price: The pre-agreed price at which the buyer can buy or sell the underlying.
Premium: The cost paid by the option buyer to the seller for the right.
Expiration Date: The last date the option is valid.
In the Money (ITM): When exercising the option is profitable (e.g., stock price above strike for calls, below strike for puts).
Out of the Money (OTM): When exercising leads to a loss, so the buyer won’t exercise.
At the Money (ATM): When the stock price is very close to the strike price.
3. How Options Work – An Example
Suppose stock ABC Ltd. is trading at ₹100.
You expect the stock to rise.
You buy a Call Option with a strike price of ₹105 for a premium of ₹3, expiring in one month.
Scenario 1: Stock rises to ₹115
You exercise your right to buy at ₹105 and immediately sell at ₹115.
Profit = (115 – 105) – 3 = ₹7 per share.
Scenario 2: Stock stays at ₹100
Buying at ₹105 makes no sense, so you let the option expire.
Loss = premium paid = ₹3.
This shows the limited loss (premium only) but unlimited profit potential for an option buyer.
4. Types of Options Trading Participants
There are broadly four categories:
Call Buyers – bullish traders expecting price rise.
Put Buyers – bearish traders expecting price fall.
Call Sellers – take opposite side of call buyers, hoping price stays flat or falls.
Put Sellers – take opposite side of put buyers, hoping price stays flat or rises.
Buyers take on risk by paying premiums, while sellers assume obligations but earn premiums upfront.

Divergence Secrets1. Basic Option Trading Strategies
These are simple, beginner-friendly strategies where risks are limited and easy to understand.
1.1 Covered Call
How it Works: You own 100 shares of a stock and sell a call option against it.
Goal: Earn income (premium) while holding stock.
Best When: You expect the stock to stay flat or slightly rise.
Risk: If stock rises too much, you must sell at the strike price.
Example: You own Infosys at ₹1,500. You sell a call at strike ₹1,600 for premium ₹20. If Infosys stays below ₹1,600, you keep the premium.
1.2 Protective Put
How it Works: You buy a put option to protect a stock you own.
Goal: Hedge downside risk.
Best When: You fear a market drop but don’t want to sell.
Example: You own TCS at ₹3,500. You buy a put with strike ₹3,400. If TCS falls to ₹3,200, your stock loses ₹300, but the put gains.
1.3 Cash-Secured Put
How it Works: You sell a put option while holding enough cash to buy the stock if assigned.
Goal: Earn premium and possibly buy stock at a discount.
Best When: You’re okay owning the stock at a lower price.
2. Intermediate Strategies
Now we step into strategies combining multiple options.
2.1 Vertical Spreads
These involve buying one option and selling another of the same type (call/put) with different strikes but same expiry.
(a) Bull Call Spread
Buy lower strike call, sell higher strike call.
Limited risk, limited profit.
Best when moderately bullish.
(b) Bear Put Spread
Buy higher strike put, sell lower strike put.
Best when moderately bearish.
2.2 Calendar Spread
Buy a long-term option and sell a short-term option at the same strike.
Profits if stock stays near strike as short-term option loses value faster.
2.3 Diagonal Spread
Like a calendar, but strikes are different.
Offers flexibility in adjusting for trend + time.
3. Advanced Option Trading Strategies
These are for experienced traders who understand volatility and time decay deeply.
3.1 Straddle
Buy one call and one put at same strike, same expiry.
Profits if the stock makes a big move in either direction.
Best before major events (earnings, policy announcements).
Risk: If stock stays flat, you lose premium.
3.2 Strangle
Similar to straddle, but strike prices are different.
Cheaper, but requires larger move.
3.3 Iron Condor
Sell an out-of-the-money call spread and put spread.
Profits if stock stays within a range.
Great for low-volatility environments.
3.4 Butterfly Spread
Combination of calls (or puts) where profit peaks at a middle strike.
Limited risk, limited reward.
Best when expecting very little movement.
3.5 Ratio Spreads
Sell more options than you buy (like 2 short calls, 1 long call).
Higher potential reward, but can be risky if stock trends too far.

PCR Trading StrategiesIntroduction
Options are among the most fascinating tools in the financial markets. Unlike regular stock trading, where you simply buy or sell shares, options allow you to control risk, leverage your money, and design strategies that profit in multiple market conditions—whether the market goes up, down, or even stays flat.
But here’s the catch: options can be confusing at first. Many beginners look at terms like strike price, premium, Greeks, spreads, and quickly feel overwhelmed. That’s why the key to mastering options is not memorizing definitions but understanding how strategies work in different situations.
This guide takes you step by step, from the basics to advanced strategies, with real-world logic and human-friendly explanations. By the end, you’ll not only know the common option strategies but also when and why traders use them.
1. The Foundations of Options Trading
1.1 What is an Option?
An option is a contract that gives the buyer the right, but not the obligation, to buy or sell an asset at a certain price within a certain time frame.
Call Option: Right to buy an asset at a set price (strike price).
Put Option: Right to sell an asset at a set price.
Example: Suppose Reliance stock is at ₹2,500. You buy a call option with strike price ₹2,600 expiring in one month. If Reliance goes to ₹2,700, your option becomes valuable, because you can buy at ₹2,600 when the market price is ₹2,700.
1.2 Key Terms
Strike Price: The price at which you can buy/sell.
Premium: The cost of the option.
Expiration Date: The last date the option is valid.
In the Money (ITM): Option already has value.
Out of the Money (OTM): Option has no intrinsic value yet.
1.3 Why Use Options?
Hedging: Protect your portfolio from risk.
Speculation: Bet on market direction with less money.
Income: Earn regular premiums by selling options.
2. The Core Building Blocks
Before strategies, let’s understand what influences an option’s price:
2.1 Intrinsic vs. Extrinsic Value
Intrinsic Value: The real value if exercised now.
Extrinsic Value: The time and volatility premium.
Example: Nifty at 20,000. A call with strike 19,800 has intrinsic value = 200. If premium is 250, then 200 is intrinsic, 50 is extrinsic.
2.2 Time Decay (Theta)
Options lose value as they approach expiry. This is why sellers often make money if the stock doesn’t move much.
2.3 Volatility (Vega)
Higher volatility increases option premiums. Ahead of big events like earnings, option prices rise. After the event, prices usually drop (called volatility crush).

Part 2 Candle Stick Pattern 1. Types of Options
Options are classified based on the right they provide and the market they trade in.
1. Based on Rights
Call Option: Right to buy.
Put Option: Right to sell.
2. Based on Market
American Options: Can be exercised anytime before expiry.
European Options: Can only be exercised on the expiry date.
3. Based on Underlying Asset
Equity Options: Based on individual stocks.
Index Options: Based on stock indices like Nifty 50.
Commodity Options: Based on commodities like gold, oil, or wheat.
Currency Options: Based on forex pairs.
2. Options Pricing
Option prices (premium) are determined using complex models like the Black-Scholes model, but in simple terms, two main components matter:
Intrinsic Value: Profit potential if exercised now.
Time Value: Extra cost reflecting time until expiry and market volatility.
Example:
If a stock trades at ₹120 and a call option strike is ₹100, intrinsic value = ₹20. Premium may be ₹25, meaning time value = ₹5.
3. Options Trading Strategies
Options allow traders to adopt different strategies depending on market outlook:
A. Basic Strategies
Long Call: Buy call, bet on rising prices.
Long Put: Buy put, bet on falling prices.
Covered Call: Own the stock and sell call to earn premium.
Protective Put: Own the stock and buy a put for protection.
B. Advanced Strategies
Straddle: Buy call and put at the same strike price—profit from high volatility.
Strangle: Buy call and put with different strike prices—cheaper than straddle.
Spread: Combine buying and selling options to reduce risk.
Bull Call Spread
Bear Put Spread
Iron Condor: Sell OTM call and put, buy further OTM options—profit in sideways markets.
4. Risks in Options Trading
Options can be profitable, but they carry risks:
Time Decay (Theta): Options lose value as expiry approaches.
Volatility Risk (Vega): Lower volatility can reduce option premiums.
Unlimited Losses: Writing naked calls can be very risky.
Complexity Risk: Advanced strategies require careful understanding.
Liquidity Risk: Some options may be hard to sell before expiry.
5. Tips for Beginners
Start Small: Trade with a small portion of capital.
Understand the Greeks: Learn Delta, Theta, Vega, and Gamma for managing risk.
Paper Trading: Practice in simulation before using real money.
Stick to Simple Strategies: Start with basic calls and puts.
Manage Risk: Always define maximum loss and use stop-loss if needed.
Focus on Education: Read, attend webinars, and follow market news.

Part 1 Candle Stick Pattern 1. What Are Options?
An option is a financial contract that gives the buyer the right—but not the obligation—to buy or sell an asset at a predetermined price on or before a specific date.
Think of it as a ticket to make a transaction in the future. You can choose to use the ticket if it benefits you, or ignore it if it doesn’t.
Call Option: Gives the right to buy an asset.
Put Option: Gives the right to sell an asset.
Example:
Imagine a stock of ABC Ltd. is trading at ₹100. You buy a call option with a strike price of ₹110, expiring in one month. If the stock rises to ₹120, you can exercise your option and buy at ₹110, making a profit. If it doesn’t rise above ₹110, you simply let the option expire.
2. Key Terms in Options Trading
Understanding the terminology is crucial in options trading. Here are the main terms:
Strike Price (Exercise Price): The price at which the underlying asset can be bought (call) or sold (put).
Premium: The price paid to buy the option. Think of it as the cost of the “ticket.”
Expiry Date: The last day the option can be exercised.
In the Money (ITM): When exercising the option would be profitable.
Out of the Money (OTM): When exercising the option would not be profitable.
At the Money (ATM): When the strike price is equal to the current market price.
Underlying Asset: The stock, index, commodity, or currency the option is based on.
Example:
If you buy a call option for XYZ stock at a strike price of ₹50, and the stock rises to ₹60, the option is ITM. If the stock stays at ₹45, the option is OTM.
3. How Options Work
Options can be exercised, sold, or allowed to expire, giving traders flexibility:
Buying a Call Option: You expect the asset’s price to rise. Profit is theoretically unlimited; loss is limited to the premium paid.
Buying a Put Option: You expect the asset’s price to fall. Profit increases as the asset price decreases; loss is limited to the premium paid.
Selling (Writing) Options: You collect the premium but take on greater risk. For example, selling a naked call has unlimited potential loss.
Options trading is derivative-based, meaning its value is derived from an underlying asset. The price of an option depends on several factors:
Intrinsic Value: Difference between current price and strike price.
Time Value: Value based on time left to expiry.
Volatility: How much the underlying asset moves affects the premium.
Interest Rates & Dividends: Can slightly impact options pricing.
4. Why Trade Options?
Options are popular for several reasons:
1. Leverage
Options allow you to control a large number of shares with a small investment (premium). This magnifies potential gains—but also potential losses.
Example:
You pay ₹5 per option for the right to buy 100 shares. If the stock moves favorably by ₹10, your profit is much higher than if you bought the shares directly.
2. Hedging
Options act as insurance. Investors use options to protect portfolios from market declines.
Example:
You own 100 shares of a stock at ₹200. Buying a put option at ₹190 ensures you can sell at ₹190, limiting potential loss.
3. Flexibility
Options allow you to profit in any market condition—up, down, or sideways. Various strategies can capture gains depending on market movements.
4. Speculation
Traders use options to bet on short-term price movements. Small changes in the underlying asset can generate significant returns due to leverage.

Part 2 Support and ResistanceHow Options Work
Options allow traders to speculate or hedge in different market conditions. For example:
Buying a Call Option: If an investor expects a stock’s price to rise, they can buy a call option. If the stock price exceeds the strike price, the option holder can either sell the option at a profit or exercise it to buy the stock at a lower price.
Buying a Put Option: If an investor anticipates a decline in the stock price, they can buy a put option. If the stock price falls below the strike price, the option holder can sell the stock at a higher-than-market price or sell the option for a profit.
Options can also be sold/written, allowing traders to earn the premium as income. However, selling options carries significant risk because the seller may have unlimited loss potential if the market moves against them.
Options Pricing and Valuation
The value of an option is influenced by intrinsic value and time value:
Intrinsic Value: The difference between the underlying asset’s current price and the strike price. For example:
Call Option: Intrinsic Value = Max(0, Current Price – Strike Price)
Put Option: Intrinsic Value = Max(0, Strike Price – Current Price)
Time Value: The portion of the premium that accounts for the time remaining until expiry and the expected volatility of the underlying asset. Options with more time until expiration generally have higher premiums because there’s a greater chance for the underlying asset to move favorably.
Additionally, models such as the Black-Scholes model are used by traders and institutions to estimate theoretical option prices, considering factors like the underlying price, strike price, time to expiration, volatility, and interest rates.
Benefits of Options Trading
Options trading offers several advantages compared to traditional stock trading:
Leverage: Options allow investors to control a large number of shares with a relatively small investment. This amplifies potential gains (and losses).
Flexibility: Traders can use options to speculate, hedge, or generate income, offering multiple strategic possibilities.
Risk Management: Options can act as insurance for existing positions. For instance, buying a put option can protect a stock holding from a sharp decline.
Profit in Any Market Condition: Options strategies can be designed to profit in bullish, bearish, or even neutral markets.

Part 1 Support and ResistanceIntroduction to Options Trading
Options trading is a sophisticated segment of the financial markets that allows investors to speculate on the future price movement of an underlying asset without actually owning it. Unlike traditional stocks, where you buy and sell shares directly, options are derivative instruments — their value is derived from an underlying security, such as a stock, index, commodity, or currency. Options can provide unique advantages, including leverage, flexibility, and hedging opportunities, making them popular among traders and investors looking for strategic ways to manage risk and potentially enhance returns.
Basic Concepts of Options
At its core, an option is a contract that gives the holder the right, but not the obligation, to buy or sell an underlying asset at a predetermined price on or before a specific date. The two main types of options are:
Call Option: Grants the holder the right to buy an asset at a specific price, known as the strike price, within a defined period.
Put Option: Grants the holder the right to sell an asset at the strike price within a defined period.
The price paid to purchase an option is called the premium, and it represents the cost of acquiring the rights that the option provides. Sellers (or writers) of options receive this premium and are obligated to fulfill the contract if the buyer exercises the option.
Key Components of Options
Understanding options requires familiarity with their core components:
Underlying Asset: The financial instrument (stock, index, commodity, or currency) on which the option is based.
Strike Price (Exercise Price): The predetermined price at which the option can be exercised.
Expiry Date: The date on which the option contract expires. After this date, the option becomes worthless if not exercised.
Premium: The cost of purchasing the option. It is influenced by factors such as the underlying asset’s price, volatility, time to expiry, and interest rates.
Option Style: There are two primary styles:
American Option: Can be exercised any time before expiry.
European Option: Can only be exercised on the expiry date.

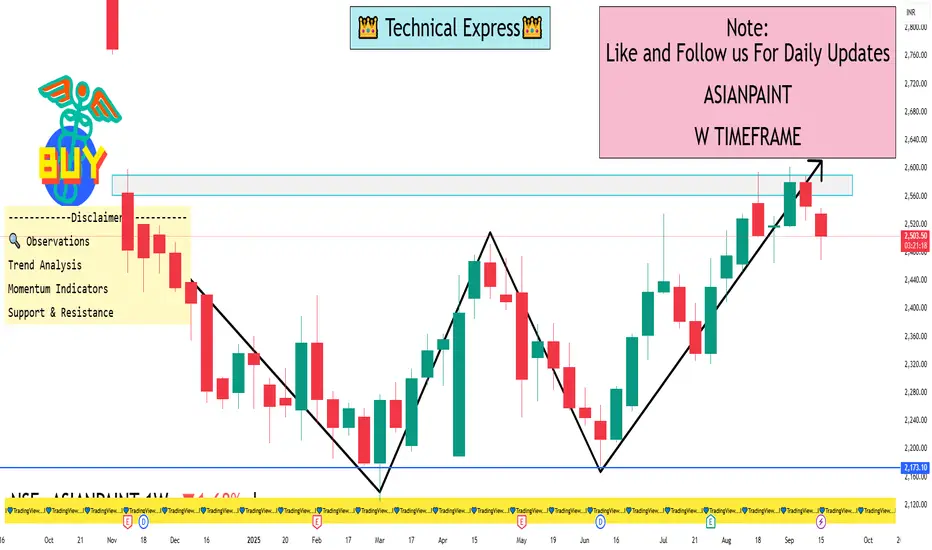
ASIANPAINT 1 Week View📊 Weekly Support & Resistance Levels
Support Levels:
S1: ₹2,524.63
S2: ₹2,502.97
S3: ₹2,481.13
S4: ₹2,452.73
Central Pivot: ₹2,553.57
Resistance Levels:
R1: ₹2,568.13
R2: ₹2,589.97
R3: ₹2,611.63
R4: ₹2,647.13
Central Pivot: ₹2,553.57
📈 Technical Indicators (Weekly Timeframe)
Relative Strength Index (RSI): Indicates a bullish trend.
Moving Average Convergence Divergence (MACD): Shows a bullish crossover, supporting upward momentum.
Moving Averages: Both 50-day and 200-day moving averages are trending upwards, confirming a positive short-term outlook.
Pivot Points: Trading above the central pivot suggests a bullish bias.
🔍 Observations
Asian Paints has been trading within a parallel channel since May 2021. A significant gap-down breakdown occurred in November 2024, followed by a series of bearish candles. If the current momentum persists, further downward movement is possible. However, the stock is approaching key support levels, which may act as a cushion against further declines.
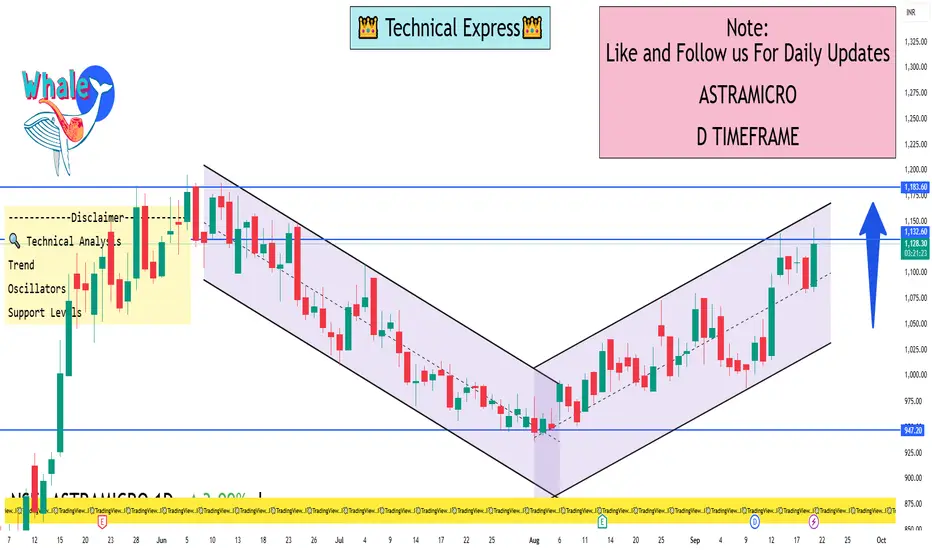
ASTRAMICRO 1 Day View📈 Current Market Overview
Current Price: ₹1,132.50
Day’s Range: ₹1,081.30 – ₹1,144.00
Previous Close: ₹1,085.00
Volume: 517,982 shares
VWAP: ₹1,123.74
52-Week Range: ₹584.20 – ₹1,195.90
The stock has gained approximately 4.77% today, outperforming the broader market indices, with the BSE Sensex down 0.50% and the Nifty 50 down 0.45%
🔍 Technical Analysis (1-Day Timeframe)
Trend: The stock is in a strong uptrend, forming higher highs and higher lows on the daily chart.
Oscillators: Indicators suggest a bullish momentum, with a "buy" signal prevailing.
Support Levels: The immediate support is around ₹1,081.30.
✅ Conclusion
Astra Microwave Products Ltd is currently in a bullish phase on the 1-day timeframe, supported by positive technical indicators and moving averages. However, given the stock's proximity to resistance levels and high volatility, it's advisable to monitor for a breakout above ₹1,144.00 for potential further gains. Traders should also consider setting a stop-loss around ₹1,034.16 to manage risk effectively.
Sentiment-Driven Surges: Understanding Modern Market Explosions1. Market Sentiment: Definition and Importance
1.1 What is Market Sentiment?
Market sentiment refers to the overall attitude of investors toward a particular security or financial market. It represents the collective feelings, perceptions, and expectations of market participants about future price movements. Unlike fundamental analysis, which evaluates intrinsic value based on financial metrics, sentiment analysis focuses on how participants feel and act.
Market sentiment can be bullish (positive, expecting price increases) or bearish (negative, expecting price declines). It often drives momentum trades—buying when others buy, selling when others sell—creating self-reinforcing feedback loops.
1.2 Why Sentiment Matters
While fundamentals provide the baseline value, sentiment often dictates short-term market dynamics. Stocks with strong earnings may stagnate if investor sentiment is negative, while speculative assets can skyrocket without fundamental support, as seen in numerous “meme stock” rallies.
Key points:
Sentiment amplifies price volatility.
It can override fundamental signals in the short term.
It often creates market bubbles and flash crashes.
2. Drivers of Sentiment-Driven Surges
Several factors can trigger sentiment-driven market explosions. Understanding these drivers is essential for anticipating sudden price movements.
2.1 Social Media and Retail Trading Communities
In the digital era, platforms like Twitter, Reddit, Telegram, and Discord allow retail investors to coordinate actions rapidly. The 2021 GameStop saga is a prime example:
Retail traders organized online to push the stock price upward.
Short sellers were forced to cover positions, creating a short squeeze.
Price movement was largely independent of fundamentals.
Impact: Social media has transformed market psychology into a highly visible, amplifiable force. Viral narratives can trigger mass buying or selling within hours.
2.2 Algorithmic and High-Frequency Trading (HFT)
Algorithms react to market sentiment indicators, news, and price trends faster than humans can. Sentiment-based trading algorithms scan news feeds, tweets, and financial forums to predict market direction.
Positive sentiment triggers buying algorithms, increasing upward momentum.
Negative sentiment triggers selling algorithms, exacerbating declines.
Impact: HFT accelerates sentiment-driven surges, making them more extreme and less predictable.
2.3 Economic Data and Policy Announcements
Macroeconomic events, central bank policy changes, or earnings announcements can shape sentiment quickly.
Rate hikes: Markets may panic or rally based on perceived economic impact.
Inflation data: Surprising figures can trigger bullish or bearish sentiment.
Earnings surprises: Positive surprises can ignite rapid buying in stocks, sometimes overshooting intrinsic values.
2.4 Herding Behavior
Humans have an innate tendency to follow the crowd. Once a price starts moving, others often join in, creating momentum:
Fear of missing out (FOMO) amplifies upward surges.
Panic selling accelerates downward crashes.
Impact: Herding behavior often turns small sentiment shifts into large market movements.
3. Mechanisms Behind Market Explosions
Market surges do not occur in isolation. They are the result of interconnected feedback loops that magnify sentiment.
3.1 Momentum and Feedback Loops
When investors see prices rising, they buy more, driving prices higher—a self-reinforcing loop. Conversely, negative sentiment triggers rapid sell-offs. Feedback loops are amplified by:
Social media chatter
Trading algorithms
News coverage emphasizing price movements
3.2 Short Squeezes and Gamma Squeezes
Short positions are vulnerable during sentiment surges:
Short squeeze: Short sellers must buy back shares as prices rise, pushing prices further upward.
Gamma squeeze: Options market hedging by institutions forces more buying as underlying stock prices rise.
These mechanisms can make sentiment-driven surges explosive, often detached from fundamentals.
3.3 Liquidity and Market Depth
In low-liquidity conditions, small buy or sell orders can cause large price swings. Market sentiment can exploit these situations, leading to sharp, short-term surges.
Retail-driven markets often exhibit low liquidity, enhancing volatility.
Institutional players can manipulate perception to induce sentiment-driven movements.
4. Case Studies: Modern Market Explosions
4.1 GameStop (GME) – 2021
Coordinated retail buying triggered a massive short squeeze.
Price rose from $20 to over $400 in weeks.
Media coverage further fueled sentiment, creating global awareness.
Lesson: Social media combined with short vulnerabilities can cause extreme surges.
4.2 AMC Entertainment – 2021
Retail investors used sentiment-driven strategies to push stock prices up.
Options trading amplified the impact via gamma squeezes.
Fundamental financial health was largely irrelevant during the surge.
Lesson: Sentiment can dominate fundamentals, especially in low-liquidity assets.
4.3 Cryptocurrencies
Bitcoin and altcoins frequently experience sentiment-driven surges.
Tweets from influential figures (e.g., Elon Musk) can trigger massive price swings.
Speculative trading, FOMO, and global access make crypto highly sentiment-sensitive.
Lesson: Digital assets are extremely prone to narrative-driven price explosions.
5. Measuring Market Sentiment
To understand and anticipate surges, traders need reliable sentiment metrics.
5.1 Technical Indicators
Relative Strength Index (RSI): Measures overbought or oversold conditions.
Moving averages: Trends combined with sentiment data can indicate momentum.
Volume spikes: Often signal emerging sentiment-driven activity.
5.2 Social Media Analytics
Tweet volume and sentiment analysis: High positive mention frequency can indicate bullish momentum.
Reddit/Discord monitoring: Large posts and discussions can foreshadow retail-driven surges.
5.3 News and Media Sentiment
AI-powered sentiment analysis scans headlines and financial news.
Positive coverage often triggers short-term buying, negative coverage triggers selling.
5.4 Options Market Sentiment
High open interest and unusual options activity often precede price surges.
Call/put ratios indicate market expectations.
6. Trading Strategies Around Sentiment Surges
Traders can leverage sentiment-driven dynamics, but risk management is crucial.
6.1 Momentum Trading
Buy when sentiment is strongly bullish and prices are rising.
Use technical indicators for entry and exit points.
Watch volume and volatility for confirmation.
6.2 Contrarian Trading
Identify overextended sentiment-driven rallies.
Sell into extreme optimism or buy during panic.
Requires careful risk management and timing.
6.3 Event-Driven Sentiment Trades
Track scheduled events like earnings releases, policy announcements, or influencer posts.
Anticipate sentiment reactions and position accordingly.
6.4 Risk Management
Set stop-loss and take-profit levels to manage volatility.
Avoid over-leveraging during explosive surges.
Diversify exposure to minimize emotional decision-making.
7. Risks and Challenges
While sentiment-driven surges offer opportunities, they carry significant risks:
Volatility: Prices can reverse sharply, leading to losses.
Speculation vs. fundamentals: Trading purely on sentiment ignores intrinsic value.
Market manipulation: Pump-and-dump schemes exploit sentiment.
Psychological pressure: FOMO and panic can cloud judgment.
Traders must balance the allure of explosive gains with the discipline of risk control.
Conclusion
Sentiment-driven surges represent a paradigm shift in modern financial markets. While traditional fundamentals remain important, the rapid dissemination of information, social media influence, algorithmic trading, and psychological behaviors have created conditions where sentiment alone can trigger explosive market moves.
Understanding these surges requires a multi-dimensional approach—blending behavioral finance, technical analysis, social media monitoring, and risk management. For traders, recognizing sentiment signals, anticipating herding behavior, and using disciplined strategies can turn volatility into opportunity.
Ultimately, modern markets are no longer just about what a company is worth—they are about what investors feel it is worth, and sometimes, those feelings can move the market faster than any earnings report ever could.
Event-Driven Trading: Strategies Around Quarterly Earnings1. Understanding Event-Driven Trading
Event-driven trading refers to strategies that seek to exploit short-term price movements caused by corporate or macroeconomic events. These events can include mergers and acquisitions (M&A), regulatory announcements, dividend announcements, product launches, and, most notably, quarterly earnings reports. Event-driven traders operate on the principle that markets do not always price in the full implications of upcoming news, creating opportunities for alpha generation.
Earnings announcements are particularly potent because they provide concrete, quantifiable data on a company’s financial health, guiding investor expectations for revenue, profit margins, cash flow, and future outlook. Given the structured release schedule of quarterly earnings, traders can plan their strategies in advance, combining statistical, fundamental, and technical analyses.
2. Anatomy of Quarterly Earnings Reports
Quarterly earnings reports typically contain several key components:
Revenue and Earnings Per Share (EPS): Core indicators of company performance. Earnings surprises—positive or negative—often trigger substantial stock price moves.
Guidance: Management projections for future performance can influence market sentiment.
Margins: Gross, operating, and net margins indicate operational efficiency.
Cash Flow and Balance Sheet Metrics: Provide insight into liquidity, debt levels, and overall financial health.
Management Commentary: Offers qualitative insights into business strategy, risks, and opportunities.
Understanding these elements is critical for traders seeking to anticipate market reactions. Historically, stocks tend to exhibit heightened volatility during earnings releases, creating both opportunities and risks for traders.
3. Market Reaction to Earnings
The stock market often reacts swiftly to earnings announcements, with price movements reflecting the degree to which actual results differ from expectations. The reaction is influenced by several factors:
Earnings Surprise: The difference between actual earnings and analyst consensus. Positive surprises often lead to price spikes, while negative surprises can trigger sharp declines.
Guidance Changes: Upward or downward revisions to guidance significantly impact investor sentiment.
Sector Trends: A company’s performance relative to industry peers can amplify market reactions.
Market Conditions: Broader economic indicators and market sentiment affect the magnitude of earnings-driven price movements.
Traders must understand that markets may overreact or underreact initially, presenting opportunities for both short-term and medium-term trades.
4. Event-Driven Trading Strategies Around Earnings
4.1 Pre-Earnings Strategies
Objective: Position the portfolio ahead of anticipated earnings to profit from expected price movements.
Straddle/Strangle Options Strategy
Buy both call and put options with the same expiration (straddle) or different strike prices (strangle).
Profitable when stock exhibits significant volatility regardless of direction.
Works well when implied volatility is lower than expected post-earnings movement.
Directional Bets
Traders with conviction about earnings outcomes may take long or short positions in anticipation of the report.
Requires robust fundamental analysis and sector insights.
Pairs Trading
Involves taking offsetting positions in correlated stocks within the same sector.
Reduces market risk while exploiting relative performance during earnings season.
4.2 Post-Earnings Strategies
Objective: React to market inefficiencies created by unexpected earnings results.
Earnings Drift Strategy
Stocks that beat earnings expectations often continue to trend upward in the days following the announcement, known as the “post-earnings announcement drift.”
Conversely, negative surprises may lead to sustained declines.
Traders can exploit these trends using momentum-based techniques.
Volatility Arbitrage
Earnings reports increase implied volatility in options pricing.
Traders can exploit discrepancies between expected and actual volatility post-announcement.
Fade the Initial Reaction
Sometimes markets overreact to earnings news.
Traders take contrarian positions against extreme initial moves, anticipating a correction.
5. Analytical Tools and Techniques
Successful event-driven trading relies heavily on data, models, and analytical frameworks.
5.1 Fundamental Analysis
Study revenue, EPS, margins, guidance, and sector performance.
Compare against historical data and analyst consensus.
Evaluate macroeconomic factors affecting the company.
5.2 Technical Analysis
Identify key support and resistance levels.
Use indicators like Bollinger Bands, RSI, and moving averages to gauge price momentum pre- and post-earnings.
5.3 Sentiment Analysis
Monitor social media, news releases, and analyst reports for market sentiment.
Positive sentiment can amplify price moves, while negative sentiment can exacerbate declines.
5.4 Quantitative Models
Statistical models can predict probability of earnings surprises and subsequent price movements.
Machine learning algorithms are increasingly used to forecast earnings-driven volatility and trade outcomes.
6. Risk Management in Earnings Trading
Event-driven trading carries elevated risk due to volatility and uncertainty. Effective risk management strategies include:
Position Sizing
Limit exposure per trade to manage potential losses from unexpected moves.
Stop-Loss Orders
Predefined exit points prevent catastrophic losses.
Diversification
Spread trades across sectors or asset classes to reduce idiosyncratic risk.
Hedging
Use options or futures contracts to offset directional risk.
Liquidity Assessment
Ensure sufficient market liquidity to enter and exit positions without excessive slippage.
Conclusion
Event-driven trading around quarterly earnings offers substantial opportunities for informed traders. By combining fundamental analysis, technical tools, options strategies, and disciplined risk management, traders can capitalize on the predictable yet volatile nature of earnings season. While challenges exist, a structured and strategic approach allows market participants to profit from both anticipated and unexpected outcomes.
The key to success lies in preparation, flexibility, and understanding market psychology. Traders who master earnings-driven strategies can achieve consistent performance, turning periodic corporate disclosures into actionable investment opportunities.
Market Reform Fallout: Opportunities Hidden in UncertaintyIntroduction
In the ever-evolving landscape of global finance, market reforms—whether initiated by governments, central banks, or supranational entities—often usher in periods of heightened uncertainty. While such reforms aim to enhance economic stability, competitiveness, and growth, they can also lead to market volatility and investor apprehension. However, history has shown that amidst this uncertainty lie opportunities for those with the acumen to identify and capitalize on them.
This article delves into the multifaceted impacts of market reforms, exploring both the challenges they present and the avenues they open for astute investors and policymakers.
The Nature of Market Reforms
Market reforms encompass a broad spectrum of policy changes, including:
Deregulation: Reducing government intervention in markets to foster competition.
Privatization: Transferring state-owned enterprises to private ownership.
Trade Liberalization: Lowering tariffs and non-tariff barriers to encourage international trade.
Monetary and Fiscal Adjustments: Altering interest rates, taxation, and government spending to influence economic activity.
While these reforms are designed to stimulate economic growth and efficiency, their implementation can lead to short-term disruptions as markets adjust to new realities.
Fallout from Market Reforms
The immediate aftermath of market reforms often includes:
Market Volatility: Sudden policy shifts can lead to sharp market reactions, affecting asset prices and investor sentiment.
Sectoral Disruptions: Industries that were previously protected may face increased competition, leading to restructuring or closures.
Regulatory Uncertainty: Ambiguities in new policies can create a challenging environment for businesses and investors.
For instance, the European Union's ongoing review of merger policies has created uncertainty in the corporate sector, as companies await clearer guidelines before pursuing consolidation strategies
Identifying Opportunities Amidst Uncertainty
Despite the challenges, periods of uncertainty following market reforms can present unique opportunities:
Emerging Market Investments: Countries undergoing reforms often experience growth in sectors like infrastructure, technology, and consumer goods. For example, South Africa's financial markets have soared despite weak economic data and slow reforms, indicating potential in emerging markets
Strategic Mergers and Acquisitions: Regulatory changes can lead to consolidation in certain industries, presenting opportunities for mergers and acquisitions. BNP Paribas anticipates future opportunities in European investment banking driven by expected restructuring and refinancing
Policy-Driven Sectors: Reforms in areas like renewable energy, healthcare, and education can create investment opportunities in companies aligned with new policy directions.
Diversification Strategies: Investors can mitigate risks by diversifying portfolios across regions and sectors that are less affected by the reforms.
Case Studies of Reform-Induced Opportunities
South Africa: Despite slow economic growth and high unemployment, South Africa's financial markets have performed strongly, with the Johannesburg Stock Exchange reaching record highs. Analysts attribute this optimism to strong commodity prices and perceived political stability
European Union: The EU's review of merger policies has created uncertainty, but also potential for consolidation in industries like technology and manufacturing. Companies that can navigate the regulatory landscape may find opportunities for growth.
United States: The Federal Reserve's balancing act in a politically volatile landscape presents both risks and opportunities. Sectors sensitive to interest rates, such as real estate and high-yield bonds, remain vulnerable, while defensive assets like Treasury securities and gold may gain allure as hedging tools
Strategies for Navigating Reform-Induced Uncertainty
Investors and policymakers can adopt several strategies to navigate the uncertainties arising from market reforms:
Scenario Planning: Developing multiple scenarios to anticipate potential outcomes and prepare accordingly.
Stakeholder Engagement: Engaging with policymakers to influence the design and implementation of reforms.
Risk Management: Employing hedging techniques and diversifying investments to mitigate potential losses.
Monitoring Indicators: Keeping an eye on key economic and political indicators that signal changes in the reform trajectory.
Conclusion
While market reforms can lead to periods of uncertainty, they also create avenues for growth and innovation. By adopting a proactive and informed approach, investors and policymakers can turn potential challenges into opportunities, driving progress and prosperity in the evolving global market landscape.
Part 2 Trading Master Class With ExpertsHow Option Trading Works
Let’s walk through a simple example.
Suppose NIFTY is trading at 20,000. You expect it to rise.
You buy a NIFTY 20,100 Call Option by paying a premium of ₹100.
If NIFTY goes up to 20,500, your call is worth 400 (20,500 – 20,100). Profit = 400 – 100 = 300 points.
If NIFTY stays below 20,100, your option expires worthless. Loss = Premium (₹100).
Here’s the beauty: as a buyer, your loss is limited to the premium paid, but profit potential is theoretically unlimited. For sellers (writers), it’s the reverse—limited profit (premium received) but unlimited risk.
Why People Trade Options
Options are not just for speculation. They serve multiple purposes:
Hedging: Investors use options to protect their portfolio against losses. For example, buying puts on NIFTY acts as insurance during market crashes.
Speculation: Traders take directional bets on stocks or indices with limited capital.
Income Generation: Sellers of options earn premium income regularly.
Arbitrage: Exploiting price differences in related instruments.
This versatility is what makes options attractive to both professionals and retail traders.
Risks in Option Trading
While options are powerful, they are also risky:
Time Decay (Theta): Options lose value as expiry approaches, especially if they are OTM.
Leverage Risk: Small market moves can lead to large percentage losses.
Complexity: Beginners may struggle with pricing models, strategies, and margin requirements.
Unlimited Loss for Sellers: Writing naked options can lead to huge losses if the market moves strongly against the position.
Thus, understanding risk management is critical before trading options seriously.
Option Pricing & The Greeks
Option prices are influenced by several factors. To understand them, traders use Option Greeks:
Delta: Measures how much the option price moves with a ₹1 move in the underlying asset.
Gamma: Measures how Delta changes with the underlying’s price.
Theta: Measures time decay. Shows how much value an option loses daily as expiry nears.
Vega: Measures sensitivity of option price to volatility changes.
Rho: Measures sensitivity to interest rate changes (less important in short-term trading).
The Greeks help traders design strategies, manage risks, and predict option price movements.

Part 1 Trading Master Class With Experts1. Introduction to Options
Financial markets give investors multiple tools to manage money, speculate on price movements, or hedge risks. Among these tools, options stand out as one of the most powerful instruments. Options are a type of derivative contract, which means their value is derived from an underlying asset—such as stocks, indices, commodities, or currencies.
Think of an option like a ticket. A movie ticket gives you the right to enter a cinema hall at a fixed time, but you don’t have to go if you don’t want to. Similarly, an option contract gives you the right, but not the obligation, to buy or sell an asset at a pre-decided price before or on a fixed date.
This flexibility is what makes options both exciting and risky. For beginners, it can feel confusing, but once you grasp the basics, option trading becomes a fascinating world of opportunities.
2. Basic Concepts of Option Trading
At its core, option trading revolves around three elements:
The Buyer (Holder): Pays money (premium) to buy the option contract. They have rights but no obligations.
The Seller (Writer): Receives the premium for selling the option but must fulfill the obligation if the buyer exercises it.
The Contract: Specifies the underlying asset, strike price, expiry date, and type of option (Call or Put).
Unlike stocks, where you directly buy shares of a company, in options you are buying a right to trade shares at a fixed price. This difference is what gives options their unique power.
3. Types of Options
There are mainly two types of options:
3.1 Call Option
A Call Option gives the buyer the right (but not obligation) to buy an underlying asset at a fixed price before expiry.
👉 Example: You buy a call option on Reliance at ₹2,500 strike price. If Reliance rises to ₹2,700, you can buy it at ₹2,500 and immediately gain profit.
3.2 Put Option
A Put Option gives the buyer the right (but not obligation) to sell an asset at a fixed price before expiry.
👉 Example: You buy a put option on Infosys at ₹1,500. If Infosys falls to ₹1,300, you can sell it at ₹1,500, making profit.
These two simple instruments form the foundation of all option strategies.
4. Key Option Terminology
Before trading, you must understand the language of options.
Strike Price: The fixed price at which the option can be exercised.
Premium: The cost of buying an option. Paid upfront by the buyer.
Expiry Date: The last date until the option is valid. In India, stock options usually expire monthly, while index options may expire weekly.
In-the-Money (ITM): Option that already has intrinsic value (profitable if exercised).
Out-of-the-Money (OTM): Option that currently has no intrinsic value (not profitable if exercised).
At-the-Money (ATM): Strike price is very close to the market price.
Option Chain: A list of all available call and put options for a given asset, strike, and expiry.
Knowing these terms is like learning alphabets before writing sentences.

Part 3 Institutional Trading Role of Options in Hedging
Options are commonly used to hedge portfolios against adverse market movements:
Protective Put for Stocks: Investors holding equities can buy puts to protect against downside risks.
Portfolio Insurance: Institutions use options to safeguard large portfolios against market crashes.
Income Generation: Covered call writing allows long-term holders to earn additional income while maintaining exposure.
Hedging with options is especially popular in volatile markets where risk management is critical.
Pricing Models and Market Mechanics
Professional traders often rely on option pricing models, like the Black-Scholes model, to determine fair premiums. These models factor in:
Current price of the underlying asset
Strike price
Time to expiration
Volatility
Risk-free interest rate
Options markets operate through exchanges with standardized contracts. Market makers provide liquidity, and the bid-ask spread reflects supply-demand dynamics. In OTC markets, options can be customized to suit specific investor requirements.
Advantages of Options Trading
Leverage: Control a larger position for smaller capital.
Flexibility: Strategies for bullish, bearish, or neutral markets.
Hedging: Effective risk management tool.
Profit in Any Market: Can profit in rising, falling, or sideways markets with the right strategy.
Defined Risk (for Buyers): Limited to premium paid.
Challenges and Considerations
Complexity: Options require understanding of multiple factors affecting pricing.
Time Sensitivity: Options lose value as expiration nears.
Volatility Risk: Price swings can be unpredictable.
Liquidity Issues: Not all options have sufficient trading volume.
Psychological Pressure: Rapid movements and leverage can lead to emotional decisions.

Part 2 Ride The Big MovesHow Options Trading Works
Options trading involves buying and selling contracts on exchanges like the National Stock Exchange (NSE) in India, or over-the-counter (OTC) markets globally. Each contract represents a fixed quantity of the underlying asset (e.g., 100 shares per contract in equity options).
The price of an option, called the option premium, is determined by multiple factors:
Underlying Price: Directly impacts call and put options differently. Calls gain value as the underlying price rises; puts gain as it falls.
Strike Price: The relationship of the strike to the current asset price defines intrinsic value.
Time to Expiration: More time increases the option’s potential to become profitable, adding to the premium.
Volatility: Higher expected price fluctuations increase the chance of profit, making options more expensive.
Interest Rates and Dividends: Slightly affect option pricing, especially for longer-term contracts.
Options traders use strategies to profit in various market conditions. They can combine calls and puts to create complex structures like spreads, straddles, strangles, and iron condors.
Popular Options Trading Strategies
Covered Call: Holding the underlying asset and selling a call option to earn premium. It generates income but limits upside potential.
Protective Put: Buying a put on a held asset to limit losses during downturns. Essentially an insurance policy.
Straddle: Buying a call and a put at the same strike price and expiry, betting on high volatility regardless of direction.
Strangle: Similar to a straddle but with different strike prices, cheaper but requires larger movements to profit.
Spreads: Simultaneously buying and selling options of the same type with different strikes or expiries to reduce risk or capitalize on specific movements. Examples include bull call spreads and bear put spreads.
These strategies allow traders to tailor risk/reward profiles, hedge portfolios, or speculate with leverage.
Risk and Reward in Options
Options can offer leverage, allowing traders to control large positions with relatively small capital. However, this comes with significant risks:
Buyers risk only the premium paid. If the option expires worthless, the entire premium is lost.
Sellers can face unlimited loss (for uncovered calls) if the market moves sharply against them.
Time decay (theta) erodes the value of options as expiration approaches, which works against buyers of options but favors sellers.
Volatility changes can impact options pricing (vega risk).
Because of these dynamics, options require careful planning, risk management, and market understanding.

Part 1 Ride The Big MovesIntroduction to Options Trading
Options trading is a sophisticated financial practice that allows investors to speculate on the future price movements of underlying assets or to hedge existing positions. Unlike direct stock trading, options provide the right—but not the obligation—to buy or sell an asset at a predetermined price within a specified time frame. This flexibility makes options a powerful tool in modern financial markets, used by retail traders, institutional investors, and hedge funds alike.
Options fall under the category of derivatives, financial instruments whose value is derived from an underlying asset, which can be stocks, indices, commodities, currencies, or ETFs. The two fundamental types of options are call options and put options.
1. Call and Put Options
Call Option: A call option gives the buyer the right to buy the underlying asset at a specific price (known as the strike price) before or on the option’s expiration date. Traders purchase calls when they expect the asset’s price to rise. For example, if a stock is trading at ₹100, and you buy a call option with a strike price of ₹105, you will profit if the stock price exceeds ₹105 plus the premium paid.
Put Option: A put option gives the buyer the right to sell the underlying asset at the strike price. Traders buy puts when they anticipate a decline in the asset’s price. For instance, if the same stock is at ₹100, a put option with a strike price of ₹95 becomes valuable if the stock price falls below ₹95 minus the premium paid.
The option seller (writer), on the other hand, assumes the obligation to fulfill the contract if the buyer exercises the option. Sellers earn the option premium upfront but take on potentially unlimited risk, especially in the case of uncovered calls.
2. Key Terms in Options Trading
Understanding options requires familiarity with several technical terms:
Strike Price: The predetermined price at which the underlying asset can be bought (call) or sold (put).
Expiration Date: The last date on which the option can be exercised. Options lose value after this date.
Premium: The price paid to purchase the option, influenced by intrinsic value and time value.
Intrinsic Value: The difference between the underlying asset’s price and the strike price if favorable to the option holder.
Time Value: The portion of the premium reflecting the probability of the option becoming profitable before expiration.
In-the-Money (ITM): A call is ITM if the underlying price > strike price; a put is ITM if the underlying price < strike price.
Out-of-the-Money (OTM): A call is OTM if the underlying price < strike price; a put is OTM if the underlying price > strike price.
At-the-Money (ATM): When the underlying price ≈ strike price.

Pair Trading & Statistical Arbitrage1. Introduction
Financial markets are inherently volatile, influenced by macroeconomic trends, geopolitical events, corporate performance, and investor sentiment. Traders and quantitative analysts have developed sophisticated strategies to profit from these market movements while minimizing risk. Among these strategies, Pair Trading and Statistical Arbitrage have gained prominence due to their market-neutral nature, making them less dependent on overall market direction.
Pair trading is a type of market-neutral strategy that exploits the relative pricing of two correlated assets, typically stocks, to profit from temporary divergences. Statistical arbitrage, or Stat Arb, extends this concept to a broader portfolio of securities and uses advanced statistical and mathematical models to identify mispricings.
These strategies are widely used by hedge funds, quantitative trading firms, and institutional investors because they can generate consistent returns with controlled risk. In this essay, we will explore the conceptual framework, methodology, statistical underpinnings, practical applications, challenges, and real-world examples of pair trading and statistical arbitrage.
2. Understanding Pair Trading
2.1 Definition
Pair trading is a relative-value trading strategy where a trader identifies two historically correlated securities. When the price relationship deviates beyond a predetermined threshold, the trader simultaneously takes a long position in the undervalued asset and a short position in the overvalued asset. The expectation is that the price divergence will eventually converge, allowing the trader to profit from the relative movement rather than market direction.
2.2 Market Neutrality
The key advantage of pair trading is its market-neutral approach. Since the strategy relies on the relative pricing between two securities rather than the overall market trend, it is less exposed to systemic risk. For example, if the broader market declines, a pair trade may still be profitable as long as the relative relationship between the two securities converges.
2.3 Selection of Pairs
Successful pair trading depends on selecting the right pair of securities. The two primary methods of selection are:
Correlation-Based Approach: Identify securities with high historical correlation (e.g., 0.8 or higher). Highly correlated stocks are more likely to maintain their relative price behavior over time.
Example: Coca-Cola (KO) and PepsiCo (PEP), which often move in tandem due to similar business models and market factors.
Cointegration-Based Approach: While correlation measures the linear relationship between two assets, cointegration assesses whether a stable long-term equilibrium relationship exists. Cointegrated assets are statistically bound such that their price spread tends to revert to a mean over time, making them ideal candidates for pair trading.
2.4 Entry and Exit Rules
Entry Rule: Open a trade when the spread between the two securities deviates significantly from the historical mean, typically measured in standard deviations (z-score).
Example: If the spread between Stock A and Stock B is 2 standard deviations above the mean, short the overperforming stock and go long on the underperforming stock.
Exit Rule: Close the trade when the spread reverts to its historical mean, capturing the profit from convergence. Stop-loss rules are often applied to manage risk if the divergence widens further instead of converging.
2.5 Example of a Pair Trade
Suppose Stock X and Stock Y historically move together, but Stock X rises faster than Stock Y. A trader could:
Short Stock X (overvalued)
Long Stock Y (undervalued)
If the prices revert to their historical spread, the trader profits from the convergence. The market's overall direction is irrelevant; the trade relies solely on the relative movement.
3. Statistical Arbitrage: Expanding Pair Trading
3.1 Definition
Statistical Arbitrage refers to a class of trading strategies that use statistical and mathematical models to identify mispricings across a portfolio of securities. Unlike pair trading, which focuses on two assets, statistical arbitrage can involve dozens or hundreds of securities and uses algorithms to detect temporary pricing anomalies.
Statistical arbitrage aims to exploit mean-reverting behavior, co-movements, or price inefficiencies while keeping market exposure minimal.
3.2 Core Concepts
Mean Reversion: Many statistical arbitrage strategies assume that asset prices or spreads revert to a historical average. The idea is similar to pair trading but applied to larger groups of assets.
Market Neutrality: Like pair trading, statistical arbitrage attempts to remain neutral with respect to market direction. Traders hedge exposure to indices or sectors to isolate the alpha generated from relative mispricing.
Diversification: By analyzing multiple assets simultaneously, statistical arbitrage spreads risk and reduces dependence on any single asset, increasing the probability of consistent returns.
3.3 Methodology
Data Collection and Cleaning: High-quality historical price data is critical. This includes closing prices, intraday prices, volumes, and corporate actions like splits and dividends.
Model Selection:
Linear Regression Models: Estimate relationships between multiple securities.
Cointegration Models: Identify groups of assets that share long-term equilibrium relationships.
Principal Component Analysis (PCA): Reduce dimensionality and identify dominant market factors affecting securities.
Spread Construction: For a set of assets, construct linear combinations (spreads) expected to revert to the mean.
Trade Signal Generation:
Compute z-scores of spreads.
Enter trades when spreads exceed a predefined threshold.
Exit trades when spreads revert to mean or hit stop-loss levels.
Risk Management:
Limit exposure to any single stock or sector.
Monitor residual market beta to maintain neutrality.
Use dynamic hedging and stop-loss rules.
3.4 Examples of Statistical Arbitrage Strategies
Equity Market Neutral: Long undervalued stocks and short overvalued stocks based on statistical models.
Index Arbitrage: Exploit price differences between a stock index and its constituent stocks.
High-Frequency Stat Arb: Uses intraday price movements and algorithms to capture small, short-lived mispricings.
ETF Arbitrage: Exploit deviations between ETFs and the net asset value (NAV) of underlying assets.
4. Challenges and Limitations
Model Risk: Incorrect assumptions about mean reversion or correlations can lead to significant losses.
Changing Market Dynamics: Relationships between securities may break down due to macroeconomic events, mergers, or structural market changes.
Execution Risk: High-frequency stat arb requires fast execution; delays can erode profitability.
Capital and Transaction Costs: Frequent trades and leverage increase transaction costs, which can offset profits.
Overfitting: Overly complex models may perform well historically but fail in live markets.
5. Conclusion
Pair trading and statistical arbitrage represent a sophisticated intersection of finance, mathematics, and technology. Both strategies exploit mispricings in a market-neutral way, offering opportunities for consistent returns with reduced exposure to market direction. Pair trading focuses on two correlated securities, while statistical arbitrage extends the concept to multi-asset portfolios using statistical models. Despite challenges such as model risk and execution hurdles, these strategies remain fundamental tools for modern quantitative trading, especially in highly efficient markets where traditional directional strategies may struggle.
The future of these strategies is closely tied to technological advancements, from high-frequency trading to artificial intelligence, ensuring that quantitative finance continues to evolve toward more data-driven and precise market insights.