Part 2 Ride The Big Moves Key Components of Option Contracts
Every option has specific terms that determine its value and use:
Underlying Asset: The stock, index, or commodity the option is based on.
Strike Price: The pre-decided price at which the buyer can buy or sell the asset.
Premium: The price paid to purchase the option.
Expiry Date: The date when the option contract ends.
Lot Size: The number of shares per contract (e.g., 50 shares for NIFTY options).
The value of an option depends on factors such as the market price of the asset, time left to expiry, and volatility. These factors influence whether the option is in-the-money (ITM), at-the-money (ATM), or out-of-the-money (OTM).
Tradingidea

Part 1 Ride The Big Moves What is Option Trading?
Option trading is a type of derivatives trading where the value of the contract is based on an underlying asset, such as a stock, index, or commodity. An option gives the trader the right, but not the obligation, to buy or sell the underlying asset at a fixed price (called the strike price) before or on a specific date (called the expiry date). There are two main types of options — Call Options and Put Options.
A Call Option gives the right to buy the asset.
A Put Option gives the right to sell the asset.
Traders use options for hedging risks, speculating on price movements, or earning income through premiums.

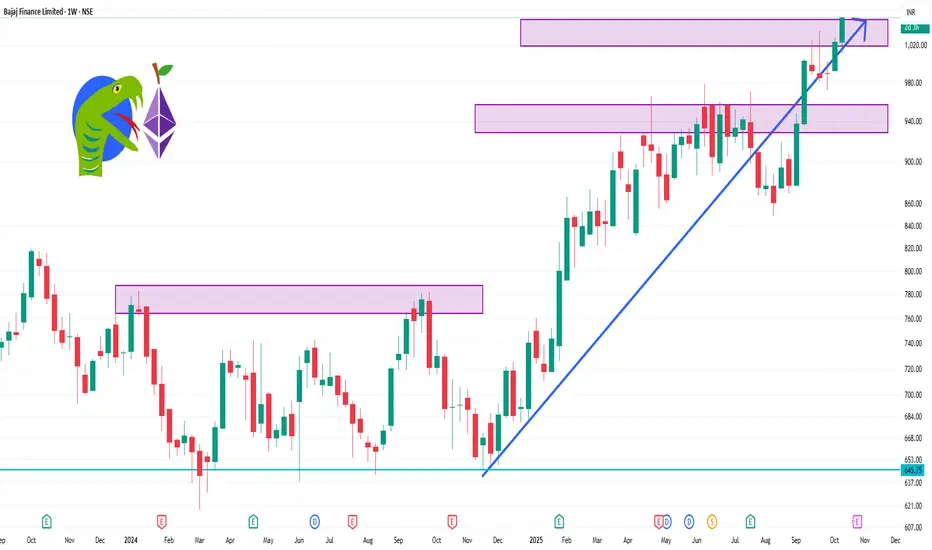
BAJFINANCE 1 Week Time Frame 📈 Weekly Technical Levels
Resistance Levels: ₹1,036.75 (short-term), ₹1,023.85 (mid-term)
Support Levels: ₹1,009.85 (short-term), ₹938 (mid-term), ₹816.86 (long-term)
These levels suggest that the stock is trading above its key support zones, indicating a potential continuation of the uptrend.
🔧 Key Technical Indicators
RSI (14): 66.57 — approaching overbought territory, but still room for upward movement.
MACD: 20.92 — indicates bullish momentum.
ADX (14): 31.50 — suggests a strong trend.
Supertrend: ₹973.61 — currently bullish.
Parabolic SAR: ₹982.79 — supports the bullish trend.
Stochastic Oscillator: 84.34 — near overbought levels, indicating potential for a pullback.
Commodity Channel Index (CCI): +131.56 — suggests the stock is overbought.
These indicators collectively point towards a strong bullish trend, though caution is advised as some indicators approach overbought conditions.
COALINDIA 1 Day Time Frame 📊 Intraday Support & Resistance Levels
Immediate Support: ₹383.05 – ₹383.35
Immediate Resistance: ₹384.03 – ₹387.12
Pivot Point: ₹384.03
📈 Technical Indicators
Relative Strength Index (RSI): Approximately 45–55, indicating a neutral to slightly bullish trend.
Moving Average Convergence Divergence (MACD): Currently showing a bearish crossover, suggesting a potential downward momentum.
50-Day Simple Moving Average (SMA): ₹385.10
200-Day SMA: ₹385.70
🔍 Market Context
The Indian stock market opened higher on Wednesday, October 15, 2025, snapping a two-day losing streak. The Sensex and Nifty tracked gains in global markets, with PSU banks and realty stocks leading the rally.

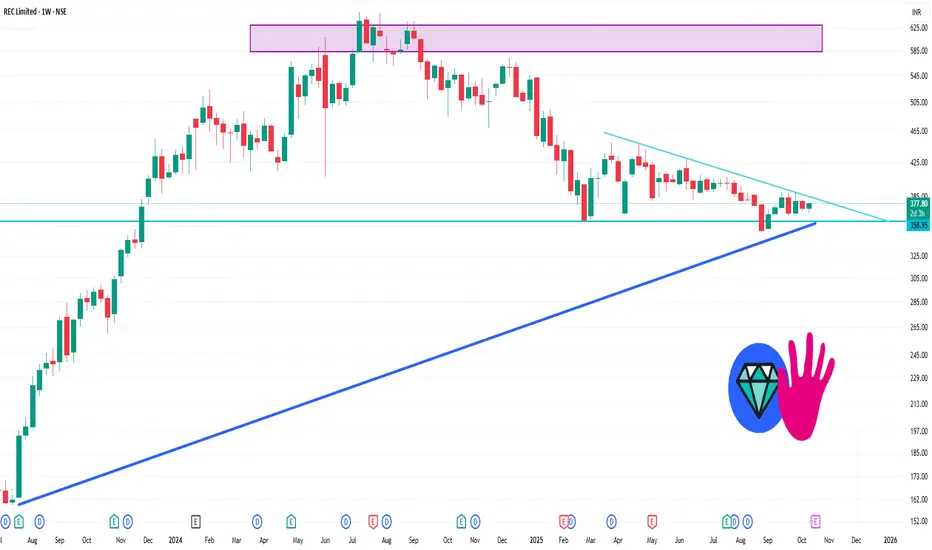
RECLTD 1 Week Time Frame 📊 Weekly Support & Resistance Levels
Immediate Support: ₹367.92
Key Support: ₹362.88
Immediate Resistance: ₹379.97
Key Resistance: ₹386.98
Weekly Trading Range: ₹355.87 – ₹392.02
🔍 Technical Indicators
RSI (14-day): 50.58 — Indicates a neutral momentum
MACD: -1.16 — Suggests a bearish trend
ADX: 15.79 — Indicates a weak trend
Stochastic RSI: 27.40 — Indicates an oversold condition
Moving Averages: Both short-term and long-term moving averages are neutral, with no clear buy or sell signals.
📈 Trend Analysis
Short-Term Trend: Neutral
Mid-Term Trend: Bearish
Long-Term Trend: Bearish
Resistance Levels: ₹386.7 (short-term), ₹391.55 (mid-term), ₹446.25 (long-term)
Support Levels: ₹364.3 (short-term), ₹350 (mid-term), ₹350 (long-term)
LT 1 Day Time Frame 📈 Current Price Snapshot
Current Price: ₹3,827.25
Day's Range: ₹3,744.30 – ₹3,841.40
52-Week Range: ₹2,965.30 – ₹3,963.00
Market Cap: ₹5.27 lakh crore
Volume: 1,160,071 shares
The stock is trading near its 52-week high, reflecting strong bullish momentum.
📊 Technical Indicators
Relative Strength Index (RSI): Approximately 70, indicating the stock is in overbought territory.
Moving Averages:
50-Day MA: ₹3,650
200-Day MA: ₹3,500
MACD: The MACD line is above the signal line, confirming upward momentum.
Pivot Points:
Support: ₹3,744
Resistance: ₹3,841
The stock is trading above its moving averages, indicating a strong bullish trend.

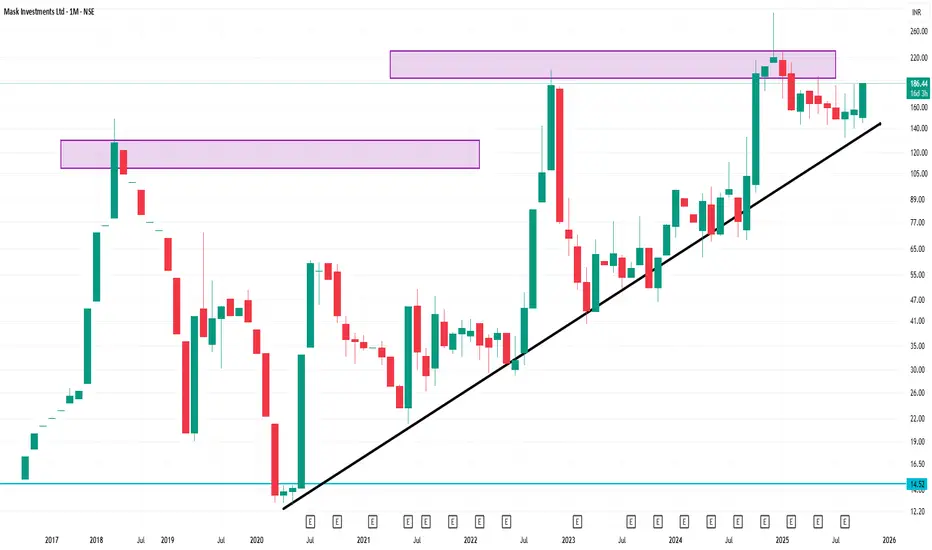
MASKINVEST 1 Month Time Frame 📈 1-Month Performance Overview
Closing Price (Sept 15, 2025): Approximately ₹151.64
Closing Price (Oct 15, 2025): ₹186.44
Price Change: +₹34.80
Percentage Gain: +22.9%
📊 Technical Insights
TradingView's technical analysis indicates a Buy signal for Mask Investments Ltd over a 1-month timeframe.
🔍 Additional Metrics
52-Week High: ₹292.46
52-Week Low: ₹103.14
Market Capitalization: Approximately ₹56.89 crore
P/E Ratio: 21,071.17
P/B Ratio: 0.48
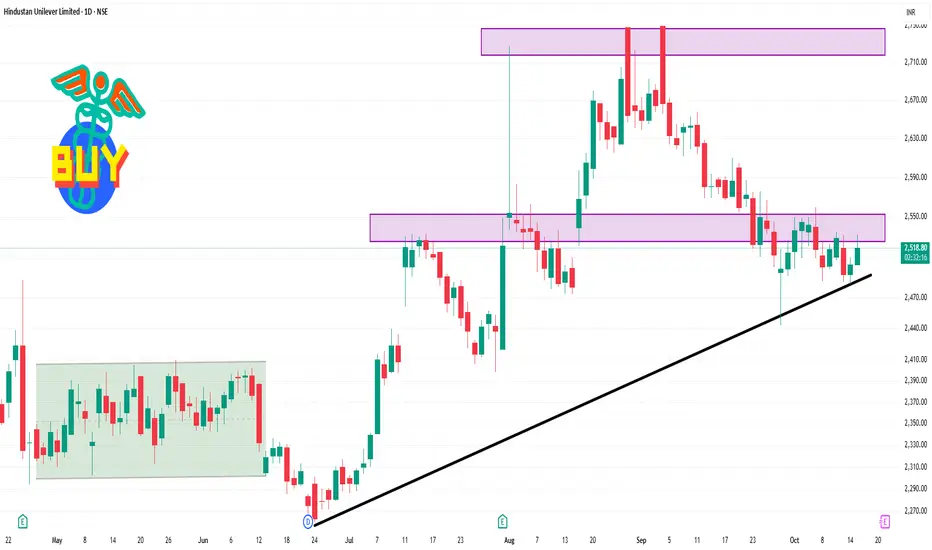
HINDUNILVR 1 Day Time Frame 📊 Intraday Price Range
Day Range: ₹2,502.60 – ₹2,531.80
VWAP (Volume-Weighted Average Price): ₹2,521.48
🔰 Pivot & Support/Resistance Levels
Standard Pivot: ₹2,513.57
Resistance (R1): ₹2,524.83
Resistance (R2): ₹2,540.47
Support (S1): ₹2,497.93
Support (S2): ₹2,486.67
🔁 Technical Outlook
Technical Summary: Neutral
Moving Averages: Neutral
Oscillators: Neutral
Overall Rating: Neutral
🔍 Analysis & Strategy
Support Zone: ₹2,400–₹2,500
Resistance Zone: ₹2,650–₹2,700
Breakout Target: ₹2,850+
Stop Loss: ₹2,395 (closing basis)
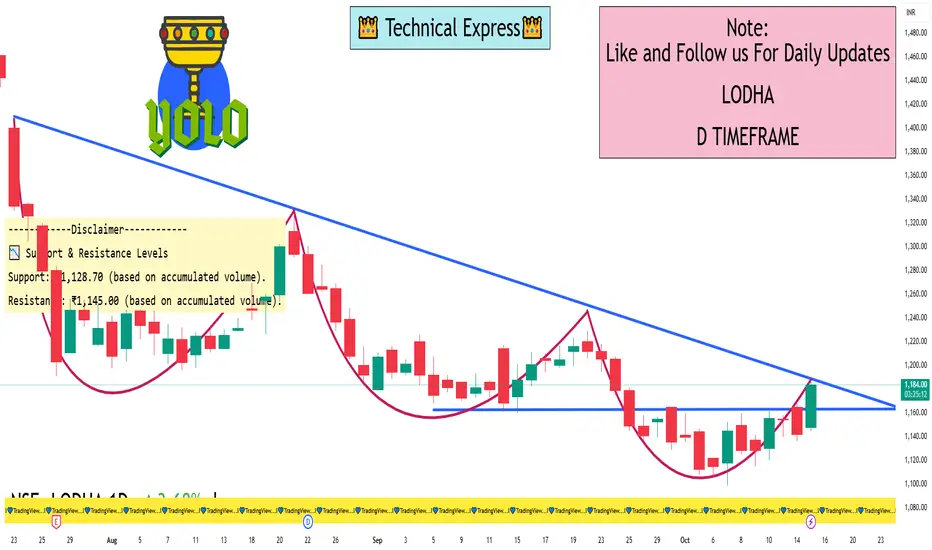
LODHA 1 Day View 📈 Current Price & Trend
Current Price: ₹1,184.90
Day's Range: ₹1,136.50 – ₹1,168.00
Previous Close: ₹1,142.00
Price Change: +₹42.90 (+3.77%)
The stock has shown a positive movement today, indicating a potential short-term bullish trend.
🔍 Technical Indicators
RSI (14-day): Approximately 51, suggesting a neutral momentum with no immediate overbought or oversold conditions.
MACD: Currently below the signal line, indicating a bearish short-term momentum.
Moving Averages:
Short-term (14-day): Currently above the long-term (200-day) moving average, suggesting a bullish short-term trend.
Long-term (200-day): The price is trading below the long-term moving average, indicating a bearish long-term trend.
Stochastic Oscillator: Reading between 45 and 55, suggesting a neutral market condition.
📌 Support & Resistance Levels
Support: ₹1,128.70 (based on accumulated volume)
Resistance: ₹1,145.00 (based on accumulated volume)
📊 Trading Outlook
The stock is expected to trade within a range of ₹1,126.95 to ₹1,157.05, with a potential move of ±2.67% from the last closing price.
⚠️ Risk & Outlook
Risk: Medium, with average daily volatility of approximately 2.77%.
Outlook: The stock is showing a neutral to slightly bullish short-term outlook, with mixed signals from various indicators. Traders should monitor key support and resistance levels around ₹1,128.70 and ₹1,145.00, respectively.
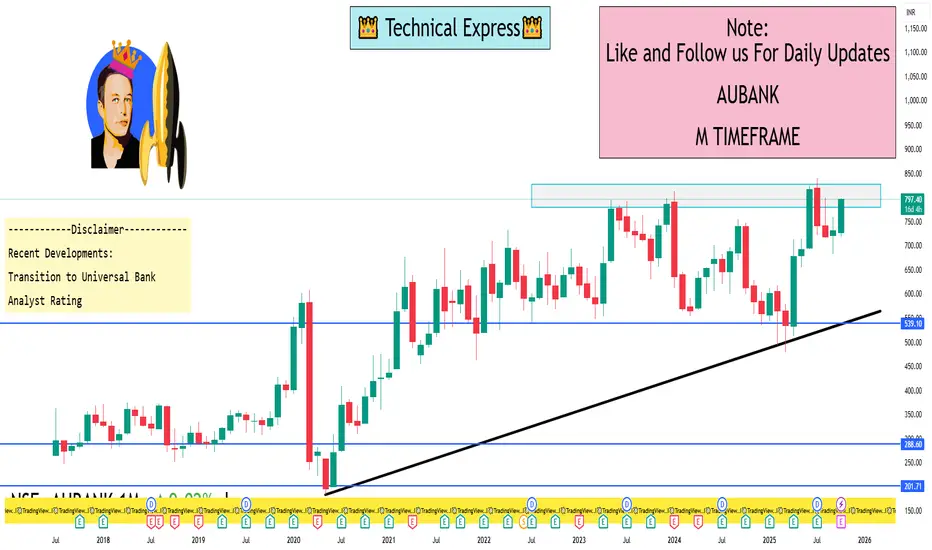
AUBANK 1 Month View 1-Month Price Range (Sep 15 – Oct 15, 2025):
High: ₹798.75
Low: ₹694.85
Closing Price on Oct 15: ₹791.90
Over the past month, the stock has gained approximately 8.55%.
Recent Developments:
Transition to Universal Bank: AU Small Finance Bank has received in-principle approval from the Reserve Bank of India to transition into a universal bank, allowing it to expand its services and operations under a broader regulatory framework.
Analyst Rating: Jefferies has initiated coverage with a "Buy" rating and a target price of ₹910, suggesting a potential upside of 19%.
Position Sizing for Different Trading Strategies1. Why Position Sizing Matters
Position sizing directly affects risk management. Even a profitable strategy can lead to account depletion if positions are too large relative to your capital. Conversely, if positions are too small, your returns will be suboptimal. Proper position sizing ensures that no single trade can jeopardize your entire trading account.
Key reasons position sizing matters:
Risk Control: Limits losses on any single trade.
Consistency: Ensures uniform risk exposure across trades.
Psychological Comfort: Helps traders manage emotions and stick to their strategy.
Maximizing Returns: Optimizes capital usage without taking excessive risk.
2. Core Concepts in Position Sizing
Before diving into strategy-specific sizing, understanding core concepts is essential:
2.1 Risk per Trade
This is the percentage of your total capital you are willing to risk on a single trade. Commonly, traders risk 1–3% per trade, depending on their risk tolerance.
2.2 Stop Loss
Stop loss defines the price at which you will exit a trade to prevent further losses. It directly influences position size: the closer the stop, the larger the position you can take, and vice versa.
2.3 Volatility
More volatile assets require smaller positions, as they are prone to larger price swings. Measures like Average True Range (ATR) help determine an appropriate position size relative to market volatility.
2.4 Account Size
Your total trading capital determines the absolute value of positions. Traders with smaller accounts may use tighter risk management rules to avoid blow-ups.
2.5 Reward-to-Risk Ratio
The potential reward compared to the risk taken affects sizing decisions. Higher reward-to-risk ratios may justify larger position sizes.
3. Position Sizing Methods
Several mathematical methods help determine the ideal position size:
3.1 Fixed Dollar Risk
You risk a fixed amount of money per trade regardless of the asset. For example, a trader risking $100 per trade will always limit losses to $100, whether trading a volatile stock or a low-volatility ETF.
3.2 Fixed Fractional
This method risks a fixed percentage of capital on each trade, which adjusts with account growth or decline. It is widely used due to its simplicity and adaptability.
Example:
With $50,000 capital and a 2% risk, the maximum loss per trade is $1,000. If the risk per share is $5, the position size is $1,000 ÷ $5 = 200 shares.
3.3 Volatility-Based Position Sizing
Adjusts position size according to market volatility. Higher volatility → smaller position size, lower volatility → larger position size. Tools like ATR are commonly used.
4. Position Sizing for Day Trading
Day traders enter and exit positions within the same day, often making multiple trades daily. Because trades are short-term and volatility can be high, risk management is crucial.
Typical Risk per Trade: 0.5–1% of account
Stop Loss: Tight, often based on intraday support/resistance or ATR
Position Size Method: Fixed fractional or volatility-based
Example:
If a trader has $100,000 and risks 1% ($1,000) per trade, with a $2 intraday stop, the position size is $1,000 ÷ $2 = 500 shares.
Key Tips for Day Traders:
Avoid over-leveraging during volatile sessions
Use intraday ATR for adjusting position size dynamically
Focus on liquidity to ensure smooth entry and exit
5. Position Sizing for Swing Trading
Swing traders hold positions from a few days to weeks to capture medium-term price moves. Risk is usually higher than day trading because positions are exposed to overnight and weekend gaps.
Typical Risk per Trade: 1–2% of account
Stop Loss: Wider than day trading, set based on technical levels
Position Size Method: Fixed fractional with ATR adjustment
Example:
A swing trader with $50,000 account risks 2% ($1,000). If the stop loss is $5 per share, the position size is 200 shares. For a stock with higher volatility (stop loss $10), the position size reduces to 100 shares.
Key Tips for Swing Traders:
Factor in overnight risk and earnings events
Adjust positions for volatility spikes
Diversify positions across sectors to reduce correlated risk
6. Position Sizing for Trend Following
Trend followers aim to ride long-term trends, often holding positions for weeks or months. These traders are willing to tolerate larger drawdowns in exchange for higher profits.
Typical Risk per Trade: 1–3%
Stop Loss: Wide, based on trend-defining support/resistance
Position Size Method: Volatility-based or fixed fractional with trailing stops
Example:
For a $100,000 account, a trend follower might risk 2% ($2,000) per trade. Using ATR for volatility measurement, a higher ATR reduces position size to prevent excessive risk during volatile trends.
Key Tips for Trend Followers:
Use volatility-adjusted stops to avoid getting stopped out prematurely
Scale into positions as trend strength confirms
Monitor correlation to avoid overexposure in the same market
7. Position Sizing for Scalping
Scalping involves making dozens or hundreds of trades per day to exploit small price movements. Risk per trade is tiny, but leverage and trade frequency increase overall risk.
Typical Risk per Trade: 0.1–0.25%
Stop Loss: Very tight, often a few ticks or cents
Position Size Method: Fixed fractional with tight risk controls
Example:
A scalper with $50,000 may risk 0.2% ($100) per trade. If stop loss is $0.10, the position size is $100 ÷ $0.10 = 1,000 shares/contracts.
Key Tips for Scalpers:
Execution speed and tight spreads are crucial
Monitor cumulative risk across multiple trades
Avoid trading during illiquid or volatile news events
8. Position Sizing for Options Trading
Options offer leverage, which makes position sizing critical. Option traders often risk a percentage of the premium or account rather than the underlying stock price.
Typical Risk per Trade: 1–3%
Stop Loss: Based on option premium or underlying price movement
Position Size Method: Fixed fractional or risk-defined based on delta
Example:
If a trader has $50,000 and risks 2% ($1,000) per trade on call options costing $5 each, they could buy 200 contracts.
Key Tips for Options Traders:
Factor in implied volatility changes
Avoid allocating too much capital to high-risk out-of-the-money options
Consider position delta to manage exposure to the underlying asset
9. Adjusting Position Size Based on Market Conditions
Market conditions influence position sizing significantly:
High Volatility: Reduce position size to limit risk
Low Volatility: Increase position size cautiously
Correlated Assets: Adjust sizes to prevent overexposure
Economic Events: Reduce exposure during major announcements
Dynamic position sizing is a hallmark of professional traders, allowing them to adapt to changing market environments without compromising risk control.
10. Common Mistakes in Position Sizing
Even experienced traders make mistakes with position sizing:
Ignoring Risk: Taking trades without defining risk can lead to catastrophic losses.
Overleveraging: Using excessive leverage magnifies small losses.
Inconsistent Sizing: Risking different percentages randomly undermines risk management.
Neglecting Volatility: Treating volatile assets the same as stable ones leads to oversized positions.
Not Scaling: Failing to adjust position size as account grows or shrinks.
Avoiding these mistakes is essential for long-term success.
11. Tools and Software for Position Sizing
Modern traders often rely on tools to calculate position size automatically:
Trading Platforms: MetaTrader, ThinkorSwim, NinjaTrader
Risk Calculators: Many online calculators allow inputs for account size, stop loss, and risk per trade
Excel Sheets: Customizable for advanced traders using multiple strategies
These tools save time and prevent errors in manual calculation.
12. Psychological Benefits of Proper Position Sizing
Position sizing is not only about numbers; it also affects trader psychology:
Confidence: Knowing risk is controlled reduces stress.
Discipline: Helps traders stick to strategy without emotional interference.
Consistency: Prevents revenge trading after losses.
A trader who masters position sizing often experiences steadier account growth and lower emotional volatility.
13. Summary and Best Practices
Position sizing is a cornerstone of risk management and long-term trading success. Key takeaways:
Determine your risk per trade relative to account size.
Adjust size based on stop loss, volatility, and trading strategy.
Use fixed fractional, volatility-based, or Kelly criterion methods.
Day traders use tight stops and small risks, swing traders use moderate risk and wider stops, trend followers rely on volatility-based sizing, and scalpers use very small per-trade risk.
Avoid common mistakes like ignoring volatility, overleveraging, or inconsistent sizing.
Employ tools and calculators to ensure accuracy.
Remember that position sizing protects both capital and mental composure.
By combining the right strategy with disciplined position sizing, traders can survive losses, ride profits, and grow their accounts consistently over time.
Conclusion:
Position sizing is the unsung hero of successful trading. It is what separates consistent traders from those who rely solely on prediction and luck. Whether you are a day trader, swing trader, trend follower, scalper, or options trader, understanding and applying proper position sizing can dramatically improve your risk-adjusted returns. Mastering this skill is not optional—it is essential for long-term profitability and trading survival.
Understanding ‘Trade the Headline’: What It Really Means1. The Basics: What is ‘Trade the Headline’?
At its core, trading the headline means making market decisions based on breaking news or scheduled economic announcements. These headlines can range from interest rate decisions by central banks to employment reports, geopolitical events, corporate earnings, or even unexpected crises.
Traders aim to capitalize on the market reaction to these events rather than relying solely on charts or technical indicators. Essentially, the strategy assumes that the headline will trigger volatility, which can then be exploited for profit.
For example, if a central bank announces an unexpected interest rate cut, traders might buy the currency to take advantage of its immediate appreciation. Conversely, bad earnings news might prompt a trader to short a stock.
2. Why Headlines Move Markets
Financial markets are fundamentally influenced by information. Price is a reflection of what participants collectively believe about the future value of an asset. A headline can shift that belief instantly.
Some key reasons headlines move markets:
New Information: Markets react to information that changes expectations. A positive jobs report can boost a currency because it signals economic strength.
Surprise Factor: It’s not just the news itself but how it differs from expectations. A forecasted GDP growth of 3% vs. an actual 4% can cause a surge in market activity.
Liquidity and Herd Behavior: Headlines often trigger stop orders, algorithmic trading, and herd behavior, amplifying price movements.
Emotional Response: Traders’ sentiment—fear, greed, and uncertainty—can exaggerate reactions to news.
3. Types of Headlines That Matter
Not all headlines have equal impact. Traders focus on those that are market-moving:
Economic Data: Inflation reports, unemployment numbers, retail sales, PMI, and GDP announcements.
Central Bank Decisions: Interest rates, monetary policy statements, and quantitative easing programs.
Corporate Earnings: Quarterly earnings surprises, guidance updates, and mergers/acquisitions.
Geopolitical Events: Wars, elections, trade agreements, sanctions, or political instability.
Unexpected Shocks: Natural disasters, pandemics, or major cyberattacks.
The significance often depends on timing, market expectations, and the affected asset class. For instance, forex traders are highly sensitive to interest rate decisions, whereas equity traders may focus more on earnings reports.
4. The Mechanics of Trading the Headline
Trading the headline involves several steps:
Step 1: Preparation
Traders identify the news events that are likely to influence their markets.
Economic calendars and news feeds are essential tools.
They also note the consensus expectations, because market reactions often hinge on surprises rather than the raw data.
Step 2: Anticipation
Traders decide whether to enter before the news or wait for confirmation after the market reacts.
Pre-news positioning is riskier because if the headline differs from expectations, positions can move against the trader sharply.
Waiting for confirmation reduces risk but might limit profit opportunities.
Step 3: Execution
Traders enter positions based on expected or confirmed reactions.
Rapid execution is crucial as news-driven moves can occur within seconds.
Techniques often include stop orders, limit orders, or algorithmic trading.
Step 4: Risk Management
Volatility around headlines is unpredictable; stops can be triggered by temporary spikes.
Traders often reduce position size and use tight stop-losses to manage risk.
Some even avoid trading headlines altogether due to extreme unpredictability.
5. Strategies for Trading the Headline
Several strategies exist:
a. Pre-Announcement Positioning
Traders take positions before the news based on predictions.
Advantage: High potential profits if the market moves as anticipated.
Disadvantage: High risk if the news surprises in the opposite direction.
b. Reactionary Trading
Traders wait for the market to react to the headline before entering.
Advantage: Reduced risk of being caught on the wrong side of a surprise.
Disadvantage: Smaller profits as initial moves may be captured by faster traders or algorithms.
c. Fade the Move
Traders go against the initial market reaction, anticipating that the move will reverse.
Often used when headlines produce overreactions.
Requires experience and discipline.
d. Volatility-Based Options Trading
In options markets, traders might buy straddles or strangles to profit from expected volatility, regardless of direction.
This approach is common around central bank announcements or earnings reports.
6. The Psychology Behind Trading the Headline
The ability to trade headlines successfully is not just technical—it’s psychological:
Fear and Greed: Breaking news can trigger panic buying or selling, creating rapid price swings.
Herd Mentality: Traders often mimic the crowd, amplifying volatility.
Decision-Making Under Pressure: News trading requires split-second decisions, which can be stressful and emotionally taxing.
Confirmation Bias: Traders may interpret headlines to fit pre-existing beliefs, leading to mistakes.
Managing these psychological factors is crucial for consistent success.
7. Risks of Trading the Headline
While the potential for quick profits is high, so is the risk:
Whipsaw Movements: Prices may spike and reverse quickly, hitting stops and causing losses.
Low Liquidity Spikes: Some events can create temporary illiquidity, widening spreads and increasing slippage.
Algorithmic Dominance: High-frequency trading algorithms often react faster than human traders.
Unexpected Surprises: Even well-predicted news can cause moves in the opposite direction if the market interprets it differently.
Emotional Stress: Constant monitoring of news and fast execution can lead to burnout.
8. Tools and Techniques for Trading Headlines
Successful news traders rely on several tools:
Economic Calendars: Sites like Forex Factory, Investing.com, and Bloomberg provide upcoming event schedules and consensus forecasts.
News Feeds: Real-time feeds from Reuters, Bloomberg, or Dow Jones allow immediate access to breaking headlines.
Charting Platforms: Help track reactions in real-time and place quick orders.
Algorithmic Tools: Many traders use bots or scripts to automate reactions to specific news events.
Volatility Indicators: Metrics like ATR (Average True Range) can help adjust position sizing during high-volatility periods.
9. Real-World Examples
Central Bank Interest Rate Decisions
When the Federal Reserve announces unexpected rate hikes, the USD can spike within seconds.
Traders who anticipated the move may profit, while those caught off-guard can suffer losses.
Employment Reports
U.S. Non-Farm Payroll (NFP) data often triggers large forex moves.
Traders watch the actual number versus expectations, with discrepancies causing volatility.
Corporate Earnings Surprises
A tech company exceeding revenue expectations can see its stock soar, while a miss can trigger a sell-off.
Short-term traders capitalize on these price swings.
10. Best Practices for Trading the Headline
Do Your Homework: Know the key events and consensus expectations.
Use Risk Management: Set stop-losses and manage position sizes carefully.
Avoid Emotional Trading: Stick to a plan and avoid chasing the market.
Focus on Major Moves: Not every headline is worth trading; focus on high-impact events.
Have a Contingency Plan: Be prepared for unexpected spikes, illiquidity, or slippage.
11. Conclusion
“Trade the headline” is more than just reacting to news. It is a strategic approach that requires preparation, timing, and discipline. While the potential for rapid profits exists, so do substantial risks. Success depends on understanding market expectations, human psychology, and volatility dynamics, as well as employing strict risk management.
For traders, trading the headline can be exciting and profitable, but it is not a casual endeavor. It demands a blend of analytical skill, quick decision-making, and emotional resilience. Those who master it can harness the power of information-driven market moves to gain an edge, while those who underestimate it risk being swept away by the very volatility they seek to exploit.
The Challenge of Growing a Small Trading Account1. Understanding the Limitations of a Small Account
The first challenge of growing a small trading account is understanding its inherent limitations. A small account, often ranging from a few hundred to a few thousand dollars, restricts the trader's ability to diversify and take large positions. Limited capital means that even minor mistakes can significantly affect overall performance.
Position Sizing: Small accounts require smaller trade sizes to avoid devastating losses. However, this also limits profit potential because even successful trades generate modest returns.
Diversification Constraints: With limited funds, traders cannot spread capital across multiple assets or markets, increasing vulnerability to single trade losses.
Leverage Risks: Many traders turn to leverage to amplify gains, but higher leverage dramatically increases the risk of margin calls and complete account wipeouts.
2. Psychological Pressures of Small Account Trading
Trading with a small account exerts intense psychological pressure. The fear of losing even a small percentage of capital can lead to hesitation or impulsive decision-making. Traders often experience emotional swings that impact their judgment:
Overtrading: Small accounts may push traders to take excessive trades to achieve significant returns, often leading to mistakes.
Fear and Anxiety: Losing a small portion of a tiny account feels proportionally larger, which can magnify fear and trigger panic selling.
Greed: The desire to quickly grow a small account may tempt traders to take risky, high-reward trades that exceed their risk tolerance.
Psychology plays a larger role in small account trading because each trade’s impact is magnified. Successful small account growth requires strict emotional discipline and the ability to detach psychologically from individual trades.
3. The Problem of Compounding Small Gains
A critical challenge in small account trading is generating meaningful growth through compounding. Unlike larger accounts where gains can be substantial with modest percentages, small accounts require higher percentage returns to make a significant impact. For example, turning $500 into $1000 requires a 100% gain, whereas turning $50,000 into $51,000 requires just a 2% gain.
Patience: Traders must accept that growth will be slow if they employ safe, consistent strategies.
Discipline: Consistently capturing small, high-probability trades is essential for gradual compounding.
Strategic Planning: Overly aggressive strategies to achieve fast growth often result in catastrophic losses.
Small account growth is a marathon, not a sprint. Traders must cultivate a mindset focused on consistent performance rather than instant gratification.
4. Risk Management is Paramount
Risk management is the cornerstone of small account trading. Due to limited capital, traders cannot afford large losses. Implementing proper risk controls is critical to survive and thrive:
Setting Stop-Loss Orders: Every trade must have a defined risk limit to prevent disproportionate losses.
Position Sizing: Trades should never risk more than a small percentage (typically 1-2%) of the total account balance.
Risk-Reward Ratio: Traders should aim for trades with a favorable risk-to-reward ratio to ensure long-term profitability.
Neglecting risk management can turn a small account into a zero account very quickly. Therefore, discipline and strict adherence to risk rules are non-negotiable.
5. Strategy Selection for Small Accounts
Choosing the right trading strategy is another major challenge. Aggressive strategies may promise high returns but can devastate small accounts. Conversely, overly conservative strategies may result in negligible growth. Successful small account traders often use:
Scalping and Day Trading: Capturing small price movements multiple times a day allows gradual account growth.
Swing Trading: Identifying medium-term trends can provide higher rewards per trade while controlling risk.
Low-Leverage, High-Probability Trades: Focusing on trades with strong probability setups preserves capital while allowing steady growth.
The key is to find a strategy that balances profitability and risk, tailored to the limitations of a small account.
6. Market Knowledge and Experience
Small account traders cannot afford to learn through trial and error with large losses. Market knowledge and experience are critical:
Technical Analysis Skills: Understanding chart patterns, indicators, and price action helps identify high-probability trades.
Fundamental Awareness: Knowledge of macroeconomic factors, news events, and earnings reports can prevent unexpected losses.
Continuous Learning: Markets evolve, and traders must constantly update their knowledge and adapt strategies.
Experienced traders can navigate the challenges of small account trading more effectively, as they minimize mistakes and capitalize on opportunities.
7. Psychological Pitfalls: Greed vs. Fear
A recurring theme in small account trading is the struggle between greed and fear. Traders often face two conflicting emotions:
Greed: The desire for rapid account growth may lead to oversized trades or chasing high-risk opportunities.
Fear: Fear of losing even a small amount may prevent traders from taking profitable trades or cutting losses promptly.
Balancing these emotions is crucial. Successful traders maintain emotional neutrality, executing trades according to strategy rather than emotion.
8. The Role of Leverage
Leverage can be both a blessing and a curse for small account traders. It magnifies gains, allowing small accounts to potentially grow faster, but it also increases the risk of total account loss:
Controlled Leverage: Using moderate leverage can enhance returns without exposing the account to excessive risk.
Understanding Margin: Traders must understand margin requirements and avoid over-leveraging positions.
Leverage Discipline: The temptation to “go big” with leverage can lead to catastrophic losses if not carefully managed.
Leverage is a tool, not a crutch. Small account traders must respect it and use it strategically.
9. Managing Expectations
Many traders underestimate the time and effort required to grow a small account. Unrealistic expectations often lead to frustration and poor decision-making:
Setting Realistic Goals: A small account should focus on consistent percentage gains rather than absolute dollar amounts.
Accepting Slow Growth: Sustainable growth often means accepting small profits over time rather than chasing large, risky wins.
Evaluating Performance Objectively: Traders should assess performance based on consistency, risk management, and strategy adherence.
Managing expectations helps small account traders avoid burnout and maintain long-term focus.
10. Practical Tips for Growing a Small Trading Account
Despite the challenges, small accounts can grow steadily with discipline and strategy. Here are practical tips:
Prioritize Risk Management: Limit risk per trade to protect capital.
Start Small, Grow Slowly: Focus on consistent, small wins rather than aggressive trades.
Develop a Trading Plan: Define strategy, risk parameters, and performance metrics.
Keep Emotions in Check: Avoid impulsive decisions driven by fear or greed.
Leverage Wisely: Use leverage conservatively to enhance growth without jeopardizing the account.
Track and Analyze Trades: Review successes and failures to improve strategy.
Continuous Learning: Stay informed about markets, trading tools, and evolving strategies.
Conclusion
Growing a small trading account is a journey that demands discipline, patience, and strategic thinking. The challenges range from financial limitations and risk management constraints to intense psychological pressures. However, traders who master these aspects can gradually build capital while developing skills that will serve them throughout their trading careers. Small account trading is less about instant wealth and more about cultivating the mindset, discipline, and strategy needed for long-term success. With careful planning, patience, and persistence, a small account can indeed become a foundation for significant trading growth.
Part 12 Trading Master Class With Experts Common Option Trading Strategies
Options can be combined in different ways to create strategies with defined risk and reward profiles.
Some popular strategies include:
Covered Call – Holding a stock and selling a call option on it (income strategy).
Protective Put – Holding a stock and buying a put to protect downside risk.
Straddle – Buying both call and put at the same strike to profit from big moves.
Strangle – Similar to a straddle, but strikes are different.
Iron Condor – Selling both a call and a put spread to profit from a sideways market.

Part 11 Trading Master Class With Experts Option Greeks
Option prices are influenced by several factors, measured through the Greeks:
Delta: Measures how much the option price changes with a ₹1 move in the underlying.
Gamma: Measures how Delta changes as the underlying price changes.
Theta: Measures time decay (how the option loses value daily).
Vega: Measures sensitivity to volatility changes.
Rho: Measures sensitivity to interest rate changes.
Traders use these Greeks to manage risk and plan strategies.

Divergence Secrets Option Premium Components
The option premium (price) has two parts:
Intrinsic Value: The actual value if exercised now (difference between stock price and strike price).
Time Value: The extra amount traders pay for the potential of future movement before expiry.
As expiry approaches, time value decreases, a phenomenon known as time decay (Theta).

Part 2 Support and Resistance Why Traders Use Options
Options are versatile instruments. Traders use them for:
Speculation – Betting on price movement to earn profits.
Hedging – Protecting existing investments from adverse price moves.
Income Generation – Selling options (writing) to earn the premium.
For example:
A trader may buy a call option expecting prices to rise.
A portfolio manager may buy put options to protect their stocks from falling prices.
An experienced investor may sell covered calls to earn regular income.

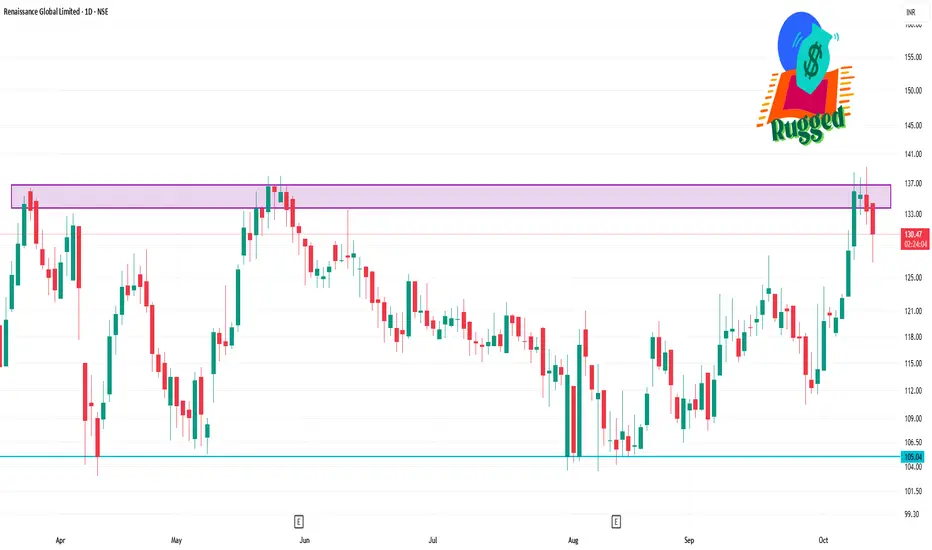
RGL 1 Day Time Frame📊 Intraday Price Movement
Opening Price: ₹135.00
Day's Range: ₹131.60 – ₹139.21
Previous Close: ₹135.46
Volume Traded: Approximately 711,000 shares
Market Cap: ₹1,453.32 crore
🔧 Technical Indicators
Relative Strength Index (RSI): 72.25, indicating potential overbought conditions
Moving Average Convergence Divergence (MACD): 0.82, suggesting a bullish trend.
Support Levels: ₹130.00 and ₹131.60
Resistance Levels: ₹135.46 and ₹139.21
📈 52-Week Range
High: ₹207.40
Low: ₹103.01
ITC 1 Day Time Frame📊 Key Support & Resistance Levels
Support Levels: ₹398.30, ₹399.25, ₹397
Resistance Levels: ₹401, ₹402, ₹403
The stock is currently near the support zone, indicating potential for a short-term rebound if buying pressure increases.
📈 Pivot Points (Classic Method)
Pivot Point: ₹399.58
Resistance Levels: R1: ₹400.62, R2: ₹401.98, R3: ₹403.02
Support Levels: S1: ₹398.22, S2: ₹397.18, S3: ₹395.82
Trading below the pivot point suggests a bearish bias.

CROMPTON 1 Week Time Frame 📉 1-Week Technical Outlook
Trend: The stock is currently in a "Strong Sell" position based on moving averages and other technical indicators, with 0 buy signals and 12 sell signals.
Relative Strength Index (RSI): The 14-day RSI stands at 28.72, indicating that the stock is in oversold territory.
Moving Averages:
5-day: ₹282.01
50-day: ₹287.02
200-day: ₹305.51
All moving averages suggest a bearish trend.
🔧 Key Support and Resistance Levels
Immediate Support: ₹281.32
Major Support: ₹274.88
Immediate Resistance: ₹296.02
Major Resistance: ₹304.28
A breakdown below ₹281.32 could lead to further declines, while a breakout above ₹296.02 may signal a reversal.

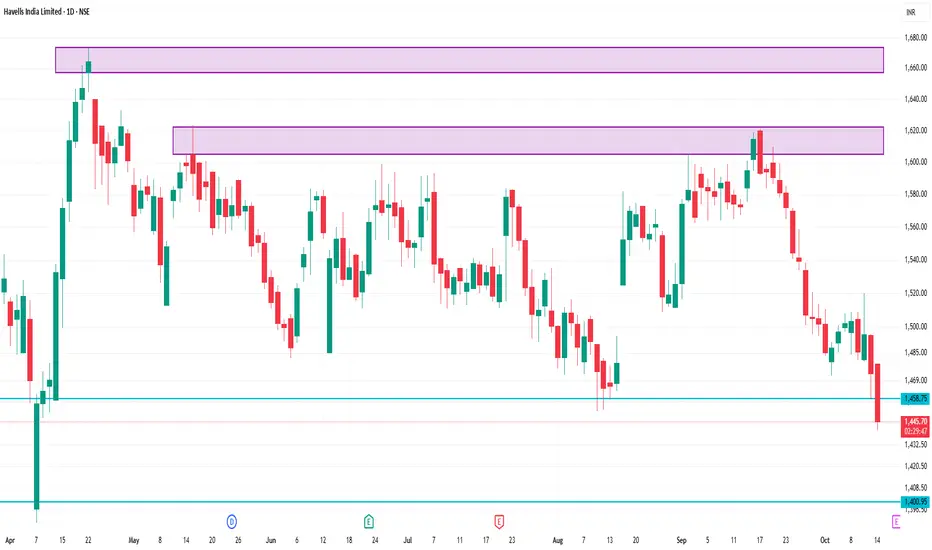
HAVELLS 1 Day Time Frame 📊 Key Support and Resistance Levels
Immediate Support: ₹1,477.53
Immediate Resistance: ₹1,527.85
Short-Term Support: ₹1,497.04
Short-Term Resistance: ₹1,538.60
Fibonacci Pivot Point: ₹1,462.70
These levels are derived from standard technical analysis tools and are relevant for intraday trading strategies.
📉 Technical Indicators
Relative Strength Index (RSI): 28.62 (indicating an oversold condition)
Moving Average Convergence Divergence (MACD): -9.64 (suggesting bearish momentum)
5-Day Moving Average: ₹1,465.36
50-Day Moving Average: ₹1,490.21
200-Day Moving Average: ₹1,547.08
These indicators collectively suggest a bearish trend in the short term.
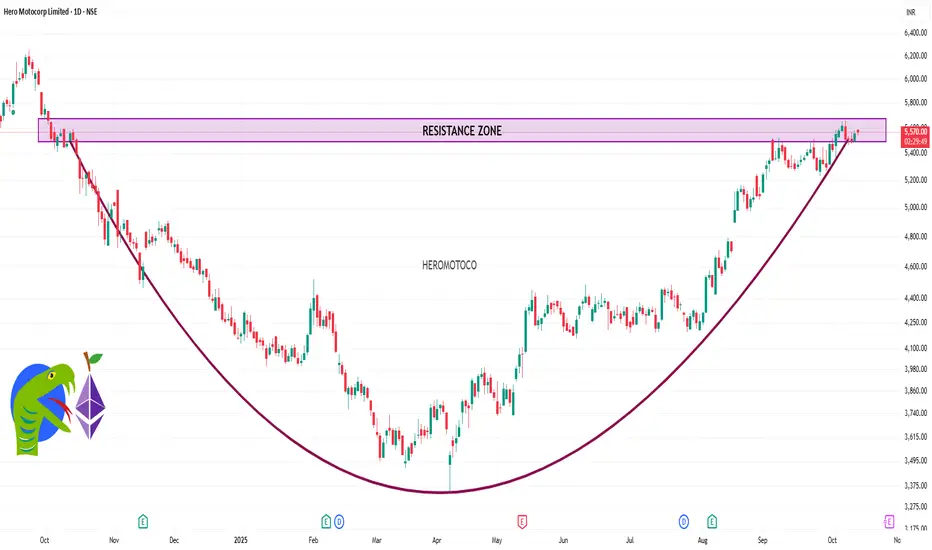
HEROMOTOCO 1 Day Time Frame 📈 Current Price and Technical Overview
Current Price: ₹5,547.50
Day's Range: ₹5,540.00 – ₹5,591.00
52-Week Range: ₹3,344.00 – ₹5,659.00
Volume: 181,480 shares
VWAP: ₹5,561.87
Market Cap: ₹111,208 crore
🔍 Technical Indicator
RSI (14-day): 53.69 — Neutral
MACD: 4.05 — Buy Signal
CCI: 92.51 — Buy Signal
ADX: 28.12 — Buy Signal
ATR (14-day): ₹35.14 — Indicates lower volatility
📊 Moving Averages
5-day EMA: ₹5,443.40 — Buy Signal
20-day EMA: ₹5,547.67 — Buy Signal
50-day EMA: ₹5,521.93 — Buy Signal
100-day EMA: ₹5,484.48 — Buy Signal
200-day EMA: ₹5,350.33 — Buy Signal
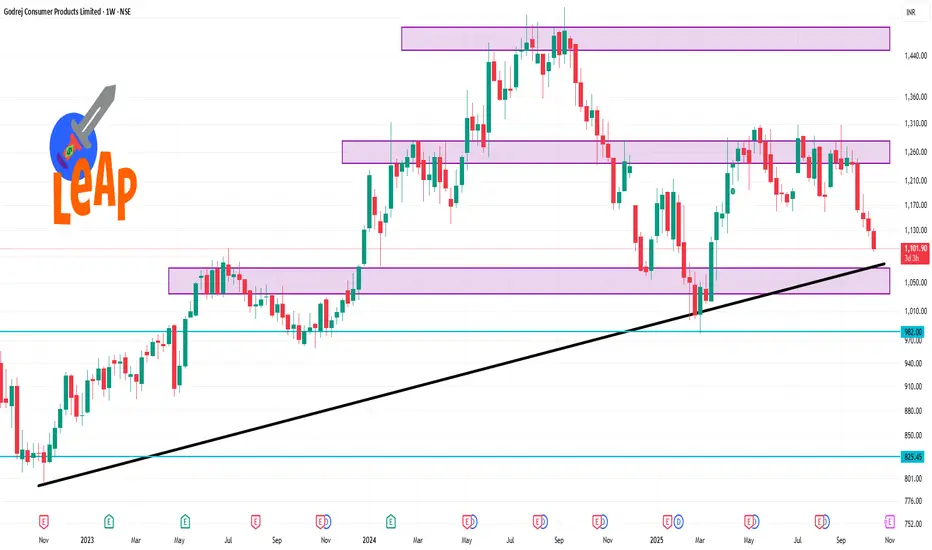
GODREJCP 1 Week Time Frame 📊 Weekly Support and Resistance Levels
Immediate Support: ₹1,112.83
Major Support: ₹1,095.87
Immediate Resistance: ₹1,153.93
Major Resistance: ₹1,178.07
Upper Range for the Week: ₹1,195.03
Lower Range for the Week: ₹1,071.73
📈 Technical Outlook
Trend: Bearish
RSI (14-day): 22.61 — indicating an oversold condition
MACD: -8.17 — suggesting a bearish trend
Moving Averages: All key moving averages (5-day to 200-day) are in a strong sell position, with no buy signals.