Brokers’ Impact on the Indian Trading Market1. Market Liquidity Enhancement
Brokers significantly enhance liquidity in the Indian trading market. By facilitating the buying and selling of securities, they ensure that there is a continuous flow of transactions, which allows investors to enter or exit positions with relative ease. High liquidity reduces the bid-ask spread and stabilizes prices, thereby creating a more efficient market. For example, large brokerage houses like Zerodha and ICICI Direct enable millions of retail investors to transact daily, adding substantial liquidity to both equity and derivatives markets.
2. Price Discovery and Market Efficiency
Brokers contribute directly to price discovery—the process through which the market determines the fair value of a security based on supply and demand. By executing trades promptly and efficiently, brokers help in reflecting accurate market sentiment. This becomes particularly crucial in volatile conditions, where brokers’ rapid response to client orders prevents large price gaps and contributes to overall market efficiency. Institutional brokers, due to their large order volumes, play a major role in signaling market trends.
3. Investor Accessibility and Participation
The democratization of the Indian trading market has largely been driven by brokers. Online brokerage platforms have reduced barriers to entry, enabling small retail investors to participate alongside institutional players. Features such as zero brokerage trading, mobile apps, and educational resources empower investors, broadening the market base. A larger investor base increases overall market participation, which in turn stabilizes market fluctuations and fosters long-term growth.
4. Advisory Services and Investment Guidance
Beyond executing trades, many brokers provide research, advisory services, and personalized investment guidance. They analyze market trends, corporate earnings, and macroeconomic developments, helping investors make informed decisions. These services influence trading patterns and investor behavior, shaping market trends indirectly. For instance, advisory reports recommending sectoral or stock-specific strategies can trigger substantial trading volumes in those assets.
5. Regulatory Compliance and Market Integrity
Brokers are the frontline enforcers of market regulations in India. Registered with SEBI (Securities and Exchange Board of India), they ensure compliance with trading norms, disclosure requirements, and anti-fraud measures. By adhering to regulatory frameworks, brokers maintain market integrity and protect investors from malpractices. Their role in preventing insider trading, front-running, and other unethical practices is crucial to maintaining confidence in the Indian financial system.
6. Technological Innovation and Market Modernization
Brokers have driven technological innovation in the Indian trading market. The introduction of electronic trading platforms, algorithmic trading services, and real-time market data feeds has revolutionized market operations. Brokers facilitate high-speed order execution, automated trading strategies, and advanced charting tools, allowing both retail and institutional investors to make rapid, informed decisions. These technological advancements enhance transparency and reduce operational inefficiencies in the market.
7. Market Stabilization During Volatility
During periods of high market volatility, brokers play a stabilizing role by managing order flows and advising clients prudently. Their risk management tools, such as stop-loss orders and portfolio diversification recommendations, help prevent panic selling and irrational market movements. By maintaining a balance between buyer and seller interest, brokers reduce extreme price swings and contribute to a resilient market structure.
8. Impact on Market Sentiment and Investor Psychology
Brokers influence not just trading volume, but also investor sentiment. Market rumors, analyst recommendations, and brokerage reports can shape investor perception, sometimes even more than fundamental data. Positive sentiment promoted by brokers can lead to bullish market trends, while negative sentiment may accelerate corrections. Understanding the psychological impact brokers have on trading decisions is key to evaluating their overall influence on market dynamics.
Conclusion
Brokers serve as the backbone of the Indian trading ecosystem. Their impact spans liquidity provision, price discovery, regulatory compliance, technological advancement, and investor education. Both traditional and modern brokerage models continue to shape market behavior, investor participation, and overall efficiency. As the Indian trading market grows in sophistication and scale, brokers’ role remains central in sustaining market stability, enhancing transparency, and promoting a culture of informed investing.
Tradingidea

Trading with AI: Revolutionizing Financial Markets1. Understanding AI in Trading
AI in trading refers to the use of machine learning algorithms, deep learning, natural language processing, and other advanced computational methods to analyze market data and make trading decisions. Unlike traditional trading, which relies heavily on human intuition and manual analysis, AI trading systems can process massive datasets, detect patterns, and execute trades with minimal human intervention.
Key aspects include:
Machine Learning Models: Used to forecast price movements, volatility, and trading volume.
Algorithmic Trading: AI systems can automate order placement, optimizing timing and pricing.
Predictive Analytics: Historical market data is analyzed to predict future trends.
AI-powered trading aims to reduce human biases, improve decision speed, and increase profitability by leveraging data-driven insights.
2. Types of AI Trading Strategies
AI trading encompasses multiple strategies depending on market objectives and risk tolerance. Some of the most common strategies include:
Algorithmic Trading: AI algorithms execute high-frequency trades based on predefined rules and patterns.
Sentiment Analysis Trading: AI systems analyze news, social media, and financial reports to gauge market sentiment and predict price movements.
Predictive Modeling: Machine learning models predict asset prices using historical and real-time data.
Reinforcement Learning: AI agents learn optimal trading strategies through trial and error in simulated environments.
Each strategy has its own strengths and challenges. For instance, high-frequency trading (HFT) requires extremely low-latency systems, whereas sentiment analysis relies on natural language processing and advanced data scraping.
3. AI in Market Data Analysis
The financial market generates enormous volumes of structured and unstructured data daily, including stock prices, order books, news articles, social media posts, and economic indicators. Human traders cannot efficiently process this volume in real-time. AI excels in:
Pattern Recognition: Identifying recurring price patterns and anomalies.
Correlation Analysis: Detecting relationships between assets or markets that humans may overlook.
Event Impact Analysis: Evaluating how geopolitical events, policy changes, or corporate announcements affect markets.
By leveraging AI, traders gain actionable insights from complex datasets that improve the accuracy of predictions and reduce reaction time.
4. Risk Management and AI
Effective risk management is crucial in trading, and AI can significantly enhance it by:
Real-Time Monitoring: AI models track portfolio risks continuously and alert traders to potential exposure.
Dynamic Position Sizing: Algorithms can adjust trade sizes based on volatility and market conditions.
Predictive Risk Assessment: Machine learning models forecast potential losses and drawdowns using historical data.
AI reduces human error in risk assessment and allows traders to maintain discipline even during highly volatile market conditions.
5. Benefits of AI Trading
AI-driven trading offers several advantages over traditional methods:
Speed and Efficiency: AI systems can process data and execute trades in milliseconds, outperforming human reaction times.
Data-Driven Decisions: Trading decisions are based on analytics and predictive modeling rather than emotions or intuition.
Consistency: AI executes strategies consistently without being influenced by fear or greed.
Adaptive Learning: Machine learning models evolve and improve over time with more data.
Cost Reduction: Automated AI trading reduces the need for large trading teams and manual intervention.
These benefits make AI an indispensable tool for hedge funds, institutional traders, and increasingly, retail investors.
6. Challenges in AI Trading
Despite its advantages, AI trading comes with challenges:
Model Overfitting: AI models may perform well on historical data but fail in real market conditions.
Data Quality Issues: Inaccurate or incomplete data can lead to wrong predictions.
Market Impact: High-frequency AI trades can contribute to market volatility.
Regulatory Risks: Financial regulators are increasingly scrutinizing AI trading to prevent market manipulation and ensure transparency.
Technical Complexity: Developing, testing, and maintaining AI trading systems requires expertise in data science, finance, and computing infrastructure.
Traders must balance AI capabilities with careful oversight and risk management to mitigate these challenges.
7. AI in Retail Trading
Traditionally, AI trading was limited to institutional players due to high infrastructure costs. However, advances in cloud computing, APIs, and AI platforms have democratized access:
Robo-Advisors: AI-driven advisory platforms provide portfolio management, asset allocation, and personalized investment advice for retail investors.
AI Trading Bots: Retail traders can leverage automated bots to execute trades based on algorithms.
Sentiment-Based Trading Apps: Apps analyze social media sentiment and news to provide trading signals.
Retail adoption of AI trading has grown exponentially, allowing smaller investors to compete more effectively in financial markets.
8. The Future of AI in Trading
The future of trading is intertwined with AI. Key trends likely to shape AI trading include:
Integration of Quantum Computing: Accelerating AI model training and improving prediction accuracy.
Hybrid Models: Combining human judgment with AI analytics for optimal decision-making.
Ethical AI and Transparency: Regulators will demand explainable AI models to prevent unfair advantages and ensure market integrity.
Cross-Market AI Systems: AI will simultaneously analyze equities, commodities, forex, and crypto markets to identify arbitrage and hedging opportunities.
AI in ESG Investing: AI can assess environmental, social, and governance factors to guide sustainable investment decisions.
As AI continues to evolve, it will not only enhance trading efficiency but also reshape how markets operate globally.
Conclusion
AI trading represents a paradigm shift in financial markets, transforming how data is analyzed, trades are executed, and risks are managed. By combining speed, precision, and predictive power, AI allows traders—both institutional and retail—to make smarter, more informed decisions. However, successful AI trading requires robust infrastructure, high-quality data, careful risk management, and continuous monitoring to navigate challenges effectively.
The ongoing convergence of AI, big data, and financial markets promises a future where trading is faster, smarter, and increasingly automated, while still requiring human oversight to ensure ethical and strategic decision-making.

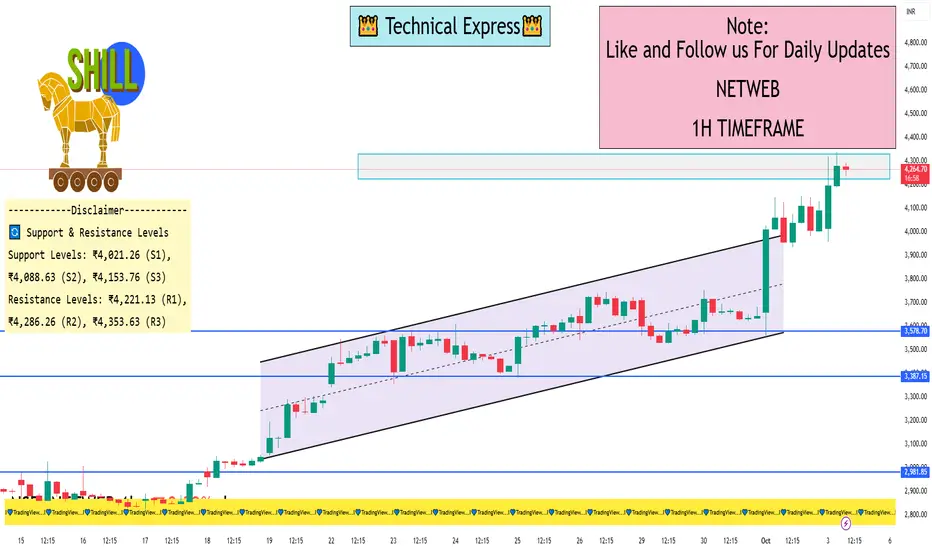
NETWEB 1 Hour ViewNETWEB is trading at ₹4,216.00, reflecting a 3.79% increase from the previous close.
📈 1-Hour Technical Analysis (as of 10:43 AM IST)
Based on intraday data, here are the key technical indicators for NETWEB on the 1-hour timeframe:
Relative Strength Index (RSI): 81.37 — indicates the stock is in the overbought zone, suggesting potential for a short-term pullback.
Moving Average Convergence Divergence (MACD): 395.90 — confirms a strong bullish momentum.
Average Directional Index (ADX): 60.55 — suggests a strong trend in the market.
Stochastic Oscillator: 89.93 — indicates the stock is in the overbought zone.
Super Trend: ₹3,386.37 — supports the current upward movement .
Williams %R: -4.50 — suggests the stock is in the overbought zone.
🔄 Support & Resistance Levels
According to pivot point analysis, the key support and resistance levels for NETWEB are:
Support Levels: ₹4,021.26 (S1), ₹4,088.63 (S2), ₹4,153.76 (S3).
Resistance Levels: ₹4,221.13 (R1), ₹4,286.26 (R2), ₹4,353.63 (R3).
The current price of ₹4,216.00 is near the R1 resistance level, indicating potential for a breakout if the price surpasses this level.
📊 Trend Analysis
The stock is exhibiting strong bullish indicators across multiple timeframes, including the 1-hour chart. The RSI, MACD, and ADX all suggest a continuation of the upward trend. However, the overbought conditions indicated by the RSI, Stochastic Oscillator, and Williams %R suggest that traders should be cautious of potential short-term pullbacks.
Regulatory & Policy Developments1. Introduction to Regulatory and Policy Developments
At the core, regulation refers to rules and directives issued by governing bodies to control, manage, or guide the conduct of businesses, markets, and economic participants. Policy, on the other hand, represents a broader framework of principles, strategies, and guidelines that guide decision-making in government, financial institutions, and corporations.
Key Objectives of Regulations and Policies
Market Stability: Regulations prevent market volatility and systemic risk, ensuring investor confidence.
Consumer Protection: Policies safeguard consumers from fraudulent practices, misleading information, and financial exploitation.
Transparency and Accountability: Regulatory frameworks require disclosure of financial information, promoting trust in institutions.
Economic Growth and Innovation: Policies can stimulate sectors, attract investments, and encourage innovation through incentives or guidelines.
Risk Management: Regulations manage risks in banking, finance, and corporate sectors, reducing chances of crises.
Regulations and policies are intertwined, often evolving with changing economic environments, technological advancements, and societal needs. Their impact is felt across every segment of the economy, from financial markets and corporate governance to labor markets and international trade.
2. Historical Evolution of Regulatory and Policy Frameworks
Global Perspective
The evolution of regulations globally has been shaped by crises, technological advancements, and policy reforms. Key milestones include:
Early 20th Century: Following financial panics like the 1907 crisis in the U.S., regulatory mechanisms emerged to stabilize markets.
The Great Depression (1929): The collapse of stock markets led to the Securities Act of 1933 and Securities Exchange Act of 1934 in the United States, establishing the SEC (Securities and Exchange Commission).
Post-War Era: Economic rebuilding prompted regulatory frameworks focusing on industrial development, labor rights, and social welfare.
Late 20th Century: Globalization and technological progress led to reforms in trade, banking, and securities markets.
Post-2008 Financial Crisis: The crisis highlighted risks in financial derivatives, complex banking products, and inadequate oversight, resulting in stringent reforms like Dodd-Frank Act (USA) and Basel III (Global Banking Standards).
Indian Regulatory History
India’s regulatory and policy framework has evolved gradually to balance growth and stability:
Pre-Independence: Limited formal regulations; trade largely unregulated with colonial economic policies.
Post-Independence Era (1947-1990): Emphasis on industrial licensing, import substitution, and financial control through entities like RBI, SEBI, and IRDAI.
Economic Liberalization (1991 Onwards): Liberalization, privatization, and globalization (LPG reforms) spurred regulatory modernization.
Recent Decades: Introduction of Goods and Services Tax (GST), Insolvency and Bankruptcy Code (IBC, 2016), and fintech regulations reflects India’s adaptation to global standards.
3. Types of Regulatory and Policy Developments
Regulations and policies vary across sectors, targeting specific objectives. Broadly, they can be classified into the following categories:
a. Financial Market Regulations
Securities Regulations: Governing stock exchanges, mutual funds, IPOs, and listed companies.
Example: SEBI regulations for market intermediaries and investor protection.
Banking and Finance Regulations: Ensuring capital adequacy, liquidity, and prudent lending.
Example: RBI’s Basel III implementation for Indian banks.
Insurance and Pension Policies: Protecting policyholders and promoting long-term savings.
Example: IRDAI regulations for insurance products.
b. Corporate Governance Policies
Disclosure Requirements: Mandating periodic reporting of financial statements.
Board Composition and Ethical Standards: Ensuring accountability in corporate management.
Fraud Prevention Measures: Detecting and preventing insider trading and market manipulation.
c. Trade and Economic Policies
Industrial Policies: Encouraging investment and promoting priority sectors.
Foreign Direct Investment (FDI) Regulations: Defining limits and approvals for international investments.
Export-Import Policies: Facilitating global trade and ensuring balance-of-payments stability.
d. Technological and Digital Regulations
Data Protection Policies: Protecting consumer privacy and personal information.
Example: Personal Data Protection Bill (India)
Fintech Regulations: Governing digital payments, cryptocurrencies, and blockchain adoption.
Cybersecurity Policies: Ensuring safe digital infrastructure in banking and corporate sectors.
e. Environmental and Sustainability Policies
Environmental Regulations: Reducing carbon emissions, pollution, and promoting clean technologies.
Sustainability Reporting: Mandating ESG (Environmental, Social, Governance) disclosures by corporates.
Renewable Energy Incentives: Policies promoting green energy and sustainable investments.
4. Key Regulatory Developments Globally
a. United States
Dodd-Frank Wall Street Reform (2010): Post-2008 financial crisis reform aimed at reducing systemic risk.
Sarbanes-Oxley Act (2002): Strengthened corporate governance and transparency after corporate scandals (Enron, WorldCom).
Federal Reserve Policies: Monetary regulations influencing liquidity, interest rates, and bank supervision.
b. European Union
MiFID II (2018): Financial market transparency, investor protection, and trading standards.
GDPR (2018): Comprehensive data protection and privacy regulations.
EU Sustainable Finance Regulations: ESG disclosures, green finance taxonomy, and risk assessments.
c. Asia-Pacific
China’s Financial Market Reforms: Liberalization of stock exchanges, fintech regulations, and digital currency issuance.
Japan’s Corporate Governance Code (2015): Focused on board independence, shareholder rights, and sustainable growth.
5. Key Regulatory Developments in India
a. Financial Market Reforms
SEBI (Securities and Exchange Board of India) Regulations
IPO norms, insider trading prevention, mutual fund oversight.
Emphasis on investor protection and market integrity.
RBI Banking Reforms
Basel III norms, asset quality review, and digital banking initiatives.
Insurance Sector
IRDAI’s solvency regulations and customer grievance redressal frameworks.
b. Corporate Governance and Compliance
Companies Act 2013
Mandates board independence, audit committees, CSR activities, and disclosure norms.
Insider Trading Regulations
Strengthened to deter market manipulation and unethical practices.
c. Trade and Economic Policies
FDI Policy Reforms
Liberalized norms across sectors, including defense, telecom, and retail.
GST Implementation (2017)
Unified indirect tax system improving ease of doing business.
Make in India Initiative
Policy to boost domestic manufacturing and attract global investors.
d. Technology and Digital Regulations
Fintech and Digital Payments
NPCI (National Payments Corporation of India) overseeing UPI, digital wallets, and payments security.
Cryptocurrency Policy
RBI and government regulations balancing innovation with risk containment.
Data Privacy and Protection
Draft bills addressing consumer data security and corporate responsibilities.
e. Environmental and ESG Policies
Mandatory CSR Reporting
Companies above a threshold must allocate profits for social development.
Green Finance Policies
Encouraging investment in renewable energy, clean technology, and sustainable infrastructure.
Carbon Emission Norms
Industries must comply with emission limits, promoting low-carbon technologies.
6. Impact of Regulatory and Policy Developments
a. Positive Impacts
Market Confidence and Stability
Strong regulations reduce uncertainty, attracting both domestic and foreign investments.
Consumer Protection
Policies prevent exploitation, fraud, and unfair practices.
Promoting Innovation
Incentives and supportive policies encourage startups, fintech, and green technology.
Global Integration
Alignment with global standards boosts international trade and capital inflows.
b. Challenges and Limitations
Regulatory Overreach
Excessive compliance costs can stifle small businesses.
Lag Between Policy and Implementation
Enforcement gaps often reduce effectiveness.
Technological Disruption
Rapid fintech, AI, and blockchain developments require constant regulatory adaptation.
Global Uncertainties
Trade wars, geopolitical tensions, and international regulatory divergence can impact domestic policies.
Conclusion
Regulatory and policy developments are essential pillars of modern economies. They ensure market stability, protect consumers, foster innovation, and integrate domestic economies with the global framework. The landscape of regulations is continuously evolving, influenced by crises, technological advancements, and societal needs. Countries like India are modernizing their regulatory architecture to promote transparency, efficiency, and sustainability while balancing growth and innovation.
Looking forward, the key to effective regulation lies in adaptability, technology integration, and a balance between control and freedom. Policymakers, regulators, businesses, and investors must collaborate to ensure a robust framework that fosters economic growth, protects stakeholders, and prepares the economy for future challenges. Regulatory and policy development is not just a compliance exercise—it is a strategic enabler for sustainable and inclusive economic progress.
Unlocking India’s Derivative Power1. Introduction: The Rise of Derivatives in India
Derivatives have existed in some form for centuries, initially in agriculture and commodities, enabling farmers and merchants to hedge price risk. In India, derivatives gained prominence after the economic liberalization in the 1990s. The National Stock Exchange (NSE) launched equity derivatives in 2000, followed by commodity derivatives on the Multi Commodity Exchange (MCX) and the National Commodity & Derivatives Exchange (NCDEX).
The core appeal of derivatives lies in risk management. Investors and institutions can hedge against price volatility, speculate for gains, or arbitrage price inefficiencies across markets. India’s derivatives market, although smaller than developed economies, has shown exponential growth, both in volume and diversity.
2. Understanding Derivatives: Types and Functions
Derivatives in India primarily fall into four categories:
2.1 Futures Contracts
Futures are standardized agreements to buy or sell an underlying asset at a predetermined price on a specific future date. They exist across equity, index, commodity, currency, and interest rate segments. Futures are widely used for hedging and speculative purposes. For example, a farmer can hedge against falling crop prices using commodity futures.
2.2 Options Contracts
Options give the buyer the right, but not the obligation, to buy (call option) or sell (put option) an asset at a specified price before or on the expiration date. Options are highly versatile for hedging, income generation, and portfolio protection. In India, options trading is active in equities, indices, currencies, and commodities.
2.3 Currency Derivatives
Currency derivatives help manage foreign exchange risk. With globalization and rising trade, Indian businesses increasingly rely on currency futures and options to hedge against volatility in USD/INR, EUR/INR, and other currency pairs.
2.4 Interest Rate Derivatives
Interest rate derivatives, including forwards, swaps, and futures, are used by banks, corporates, and investors to manage interest rate exposure. They have become crucial with rising corporate borrowing and government debt issuance.
3. The Current Landscape of India’s Derivative Markets
India’s derivative markets have evolved significantly, both in depth and sophistication.
3.1 Equity Derivatives
Equity derivatives, including stock and index futures and options, dominate India’s derivative ecosystem. NSE’s Nifty 50 futures and options are among the most traded globally. Retail participation has increased, driven by online platforms, algorithmic trading, and financial literacy.
3.2 Commodity Derivatives
MCX and NCDEX facilitate trading in gold, silver, crude oil, agricultural commodities, and base metals. Commodity derivatives allow businesses and investors to manage price risk efficiently while attracting speculative interest that enhances liquidity.
3.3 Currency and Forex Derivatives
With India’s integration into the global economy, currency derivatives have become indispensable. Corporates hedging imports and exports, banks managing reserves, and traders speculating on exchange rates collectively make this segment robust.
3.4 Institutional Participation
Foreign institutional investors (FIIs), mutual funds, insurance companies, and banks actively participate in India’s derivative markets. Their involvement improves liquidity, market efficiency, and price discovery.
4. Regulatory Framework: Building Confidence
A strong regulatory framework underpins India’s derivative markets. Key authorities include:
Securities and Exchange Board of India (SEBI): Regulates equity and currency derivatives to ensure investor protection, transparency, and risk mitigation.
Forward Markets Commission (FMC): Historically regulated commodity derivatives, now merged with SEBI for unified oversight.
Reserve Bank of India (RBI): Regulates currency derivatives and interest rate products.
SEBI has implemented measures such as position limits, margin requirements, and reporting obligations to curb systemic risk and promote market integrity. Such frameworks instill confidence among investors and institutions.
5. Unlocking Derivative Power: Strategies and Opportunities
To fully unlock the power of derivatives in India, market participants need to embrace innovation, strategic usage, and risk awareness.
5.1 Hedging and Risk Management
Derivatives allow businesses, investors, and traders to hedge against market volatility. For example:
A corporates hedging foreign currency exposure.
Farmers locking in commodity prices.
Investors protecting equity portfolios through index options.
Hedging creates stability in returns, making businesses and markets more resilient.
5.2 Speculation for Returns
Speculators provide liquidity and contribute to efficient price discovery. Traders using futures, options, and spreads can generate profits based on market expectations. While speculation involves risk, disciplined strategies can significantly enhance wealth.
5.3 Arbitrage Opportunities
Derivatives provide avenues for arbitrage—exploiting price differences across markets or between underlying assets and derivatives. For example, mispricing between Nifty spot and futures creates riskless profit opportunities. Efficient arbitrage strengthens market integrity and narrows spreads.
5.4 Portfolio Diversification
Derivatives facilitate exposure to diverse asset classes without directly holding them. Investors can gain exposure to commodities, currencies, and indices efficiently, enhancing portfolio diversification and risk-adjusted returns.
5.5 Leveraging Technology
Algorithmic trading, AI-driven analytics, and data modeling enhance derivative trading efficiency. Institutional and retail investors can use sophisticated models to optimize hedging, detect opportunities, and manage risks in real-time.
6. Challenges in India’s Derivative Market
While potential is vast, India’s derivative ecosystem faces several challenges:
6.1 Low Awareness and Education
Despite growth, a large segment of retail investors lacks knowledge about derivative usage and risk management. This gap often leads to misuse and losses.
6.2 Market Volatility
Derivatives amplify market volatility. Without proper risk management, leveraged positions can lead to systemic shocks or investor losses.
6.3 Regulatory Complexity
Compliance with SEBI, RBI, and tax regulations can be cumbersome. Frequent changes require active adaptation, which can be challenging for smaller participants.
6.4 Limited Access in Certain Segments
Currency, interest rate, and commodity derivatives remain underutilized by retail investors and SMEs due to lack of exposure, awareness, and platform accessibility.
7. Unlocking Derivative Power for SMEs and Retail Investors
Small and medium enterprises (SMEs) and retail investors form a large portion of India’s economy. Leveraging derivatives can empower them:
SMEs: Can hedge raw material costs, forex exposure, and interest rate risks, ensuring stable cash flows.
Retail Investors: Can use options for risk management, generate additional income via covered calls, or hedge equity portfolios.
Education programs, simplified platforms, and advisory services can accelerate adoption.
8. Technological Innovations Driving Growth
India’s derivative markets are increasingly powered by technology:
Algorithmic Trading: Automated strategies enhance efficiency, speed, and accuracy.
AI & Data Analytics: Predictive models improve risk assessment and market forecasts.
Blockchain & Smart Contracts: Can enhance transparency, settlement efficiency, and reduce counterparty risk in derivative contracts.
9. Global Comparison and India’s Potential
Compared to developed markets like the US, derivatives penetration in India remains lower. For example:
Equity derivatives turnover in India is high, but options and exotic instruments are less prevalent.
Commodity derivatives offer tremendous growth potential, especially in agri-commodities where hedging is limited.
Unlocking India’s derivative power can align the country with global financial practices, attract foreign investment, and enhance market sophistication.
10. Risk Management and Responsible Trading
While derivatives offer leverage and profit potential, they carry inherent risks:
Leverage Risk: Small price movements can lead to large gains or losses.
Liquidity Risk: Some contracts may lack adequate liquidity, leading to slippage.
Counterparty Risk: Though exchanges mitigate this via clearinghouses, OTC contracts carry higher risk.
Systemic Risk: Excessive speculative positions can destabilize markets.
Prudent risk management strategies, margin discipline, diversification, and regulatory compliance are essential to sustainably unlock derivative power.
Conclusion: A New Era of Financial Empowerment
India’s derivative market represents a formidable yet underutilized resource. By combining technology, education, regulatory oversight, and strategic usage, India can unlock the true power of derivatives. Properly harnessed, derivatives will not only stabilize risks and enhance returns but also position India as a global financial hub with sophisticated market infrastructure.
For investors, traders, and businesses alike, understanding and using derivatives responsibly is key to unlocking wealth, managing risk, and driving long-term economic growth. India stands at the threshold of a financial revolution, where derivatives can transform market efficiency, liquidity, and resilience—ushering in a new era of economic empowerment.

Indian SME IPOs: High Rewards Amidst High RisksPart 1: Introduction to SME IPOs in India
Small and Medium Enterprises (SMEs) are the backbone of India’s economy, contributing significantly to employment, GDP, and innovation. Recognizing their importance, the Indian government and capital markets have encouraged SMEs to access public funding through Initial Public Offerings (IPOs). Unlike traditional IPOs on the main board, SME IPOs are specifically designed to allow smaller companies to raise capital efficiently while offering retail and institutional investors opportunities to participate in potentially high-growth ventures.
Definition and Characteristics of SME IPOs
SME IPOs are offerings of equity by small and medium enterprises listed on the SME segment of recognized stock exchanges, primarily the BSE SME and NSE Emerge platforms. The eligibility criteria for SMEs include:
Minimum net worth and profitability standards.
A track record of at least two years of operations.
Compliance with corporate governance standards.
SME IPOs typically have a lower investment size compared to mainboard IPOs, making them accessible to retail investors. The minimum application amount is often around ₹1–2 lakh, while the maximum may vary depending on the issue size.
Why SMEs Go Public
SMEs pursue IPOs for several reasons:
Capital for Expansion: SME IPOs provide companies with funds to expand operations, invest in new technology, or enter new markets.
Brand Visibility: Listing enhances a company’s visibility and credibility among clients, suppliers, and investors.
Liquidity and Exit Opportunities: Founders, early investors, and venture capitalists gain a structured exit route.
Attract Talent: A public listing makes it easier to offer stock options and attract skilled professionals.
Potential for High Rewards
SME IPOs are high-risk, high-reward opportunities. Unlike established companies, SMEs operate in niche markets or emerging sectors, meaning a successful IPO can yield significant returns. Historically, some SME IPOs have delivered returns of 50–200% within a year of listing, attracting speculative and growth-focused investors. However, it’s important to note that the risks are also higher, including market volatility, limited liquidity, and operational challenges.
Conclusion of Part 1
The SME IPO segment offers a unique avenue for investors seeking exposure to high-growth, smaller companies in India. With regulatory support, increasing investor awareness, and improved market infrastructure, SME IPOs are becoming a mainstream avenue for wealth creation.
Part 2: Regulatory Framework and Listing Process
The growth of SME IPOs in India has been facilitated by clear regulatory frameworks established by SEBI (Securities and Exchange Board of India) and the stock exchanges. These frameworks ensure investor protection while promoting SME participation in public markets.
SEBI Guidelines for SME IPOs
SEBI has set distinct rules for SMEs to streamline the IPO process:
Companies must have a post-issue capital of at least ₹10 crore.
Mandatory appointment of a merchant banker to manage the issue.
Submission of a prospectus detailing financials, business model, risks, and future plans.
Listing on SME platforms like BSE SME or NSE Emerge, not the mainboard initially.
The IPO Process for SMEs
The process for an SME IPO typically includes:
Appointment of Merchant Banker: To ensure compliance with SEBI regulations and guide the company through the listing process.
Preparation of Draft Prospectus: Includes financial statements, growth plans, risk factors, and use of IPO proceeds.
SEBI Approval: Draft prospectus is submitted to SEBI for review and approval.
Pricing and Marketing: The IPO can be priced via fixed price or book-building route. SMEs often use book-building to determine fair value.
IPO Launch and Subscription: Investors, including retail and institutional, subscribe to the shares during the IPO period.
Listing: Once shares are allotted, they get listed on SME platforms, enabling trading and liquidity.
Investor Protection Measures
Despite being high-growth, high-risk investments, SME IPOs incorporate measures for investor protection:
Disclosure of risk factors and financials.
Requirement of a market maker to maintain liquidity.
SEBI guidelines for lock-in periods for promoters, reducing the risk of sudden sell-offs.
Conclusion of Part 2
A strong regulatory framework ensures transparency, investor confidence, and orderly growth of the SME IPO market. Understanding this framework helps investors evaluate the potential risks and rewards before committing capital.
Part 3: Factors Driving High Returns in SME IPOs
High returns in SME IPOs are driven by a combination of market dynamics, company fundamentals, and investor sentiment.
1. Growth Potential of SMEs
Many SMEs operate in emerging sectors such as technology, renewable energy, healthcare, and specialty manufacturing. These sectors have higher growth potential compared to mature industries, making them attractive for investors seeking exponential returns.
2. Market Inefficiencies and Speculation
SME stocks often have lower liquidity, creating price inefficiencies. Early investors who identify strong companies can benefit from rapid price appreciation after listing.
3. Promoter Credibility and Track Record
A promoter’s experience, credibility, and operational success significantly influence investor confidence. Companies with visionary leadership tend to perform better post-IPO, often rewarding early investors.
4. Favorable Economic Conditions
Macroeconomic factors like GDP growth, low interest rates, and government incentives for SMEs can amplify returns. For instance, policies promoting Make in India or technology adoption can increase SME valuations.
5. Undervalued Offerings
SME IPOs often carry lower valuations compared to mainboard companies. Investors with careful fundamental analysis can identify undervalued opportunities poised for growth.
6. Role of Market Makers
BSE and NSE mandate market makers for SME stocks, ensuring continuous buying and selling, which can reduce volatility and provide price support during initial trading days.
Conclusion of Part 3
High returns in SME IPOs are a result of the interplay between intrinsic company value, sector growth potential, market sentiment, and regulatory mechanisms. However, investors must exercise caution and due diligence to avoid speculative pitfalls.
Part 4: Risks and Challenges in Investing in SME IPOs
While SME IPOs promise high rewards, they are accompanied by unique risks that investors must understand.
1. Limited Operational Track Record
SMEs often have shorter business histories. Any operational misstep, market slowdown, or competitive threat can significantly impact profitability and share price.
2. Lower Liquidity
SME stocks trade on smaller platforms with fewer participants, leading to thin order books. This can result in higher price volatility and difficulty in exiting positions quickly.
3. Market Volatility
SME IPOs are more sensitive to broader market swings. Even positive company performance may not prevent stock prices from falling during bearish market conditions.
4. Regulatory and Compliance Risks
Although SEBI regulates SME IPOs, non-compliance, reporting delays, or governance lapses can affect investor confidence and share performance.
5. Sector-Specific Risks
Many SMEs operate in niche sectors that may face rapid technological changes, policy shifts, or demand fluctuations, affecting long-term sustainability.
6. Overvaluation at Listing
Due to hype, some SME IPOs may be overpriced relative to fundamentals, exposing investors to short-term losses post-listing.
Risk Mitigation Strategies
Diversification: Avoid concentrating capital in one SME IPO.
Fundamental Analysis: Study financials, business model, and growth prospects.
Monitor Market Maker Activity: Ensure liquidity support is sufficient.
Long-Term Perspective: SME IPOs often perform better over 1–3 years than in the immediate post-listing period.
Conclusion of Part 4
Understanding risks is critical for balancing potential high rewards. While SME IPOs can deliver significant returns, careful due diligence, prudent investment size, and long-term perspective are essential to mitigate inherent risks.
Part 5: Strategies for Successful Investment in SME IPOs
Investors can maximize rewards from SME IPOs by combining research, timing, and portfolio management strategies.
1. Identifying Promising SMEs
Focus on companies with:
Strong fundamentals and consistent revenue growth.
Experienced promoters with proven track records.
Products or services in emerging or high-demand sectors.
2. Timing and Market Sentiment
Investors should monitor:
IPO subscription trends: Oversubscription indicates strong demand.
Market conditions: Bullish markets often favor strong listing gains.
Listing day performance and early trading trends for post-IPO opportunities.
3. Diversification Across Sectors
Investing in multiple SME IPOs across different industries reduces sector-specific risk and increases chances of capturing high-growth opportunities.
4. Leveraging Advisory Services
Merchant bankers, financial analysts, and SEBI-registered advisors can provide insights into valuation, risk factors, and listing prospects.
5. Long-Term Investment Approach
While short-term gains are possible, many SME IPOs achieve substantial growth over 1–3 years. Investors focusing on long-term growth can benefit from compounding returns and company expansion.
6. Monitoring Post-Listing Performance
After listing, track:
Quarterly financial results.
Market share growth and competitive positioning.
Promoter activity and adherence to corporate governance.
7. Exit Strategies
Plan exits based on valuation targets or fundamental deterioration. Avoid panic selling during short-term market volatility.
Conclusion of Part 5
SME IPOs represent a compelling opportunity for investors willing to take calculated risks. By combining careful research, diversification, long-term vision, and active monitoring, investors can participate in India’s growth story and potentially achieve high rewards from the SME IPO segment.
Overall Conclusion
Indian SME IPOs are a vibrant, high-potential segment that balances risk with opportunity. Regulatory support, growth potential, and market mechanisms make it possible for investors to reap significant rewards, provided they adopt disciplined investment strategies. By understanding the nuances, risks, and strategies discussed, investors can confidently navigate the SME IPO landscape in India.

Bonds and Fixed-Income Trading Strategies1. Introduction to Bonds and Fixed Income
1.1 What Are Bonds?
A bond is a debt security, essentially a loan made by an investor to a borrower (typically a government, corporation, or financial institution). The borrower promises to pay periodic interest (coupon payments) and to return the principal (face value) at maturity. Bonds are considered fixed-income securities because they generally provide predictable returns over time.
Key components of a bond:
Face Value (Par Value): Amount repaid at maturity.
Coupon Rate: Annual interest percentage based on face value.
Maturity Date: When the principal is repaid.
Issuer: Entity borrowing the funds.
1.2 Importance of Bonds
Bonds serve several key functions:
Income Generation: Provide stable cash flows through coupons.
Portfolio Diversification: Lower correlation with equities reduces portfolio volatility.
Capital Preservation: Generally lower risk than stocks, especially government bonds.
Market Signaling: Bond yields reflect interest rate expectations and economic conditions.
2. Types of Bonds
Understanding the types of bonds is foundational for trading strategies:
2.1 Government Bonds
Issued by national governments; considered low risk.
Examples: U.S. Treasuries, Indian Government Securities (G-Secs).
Typically used for safe-haven investing.
2.2 Corporate Bonds
Issued by companies to raise capital.
Higher yields than government bonds due to default risk.
Categories:
Investment Grade: Lower default risk, moderate yields.
High Yield (Junk Bonds): Higher default risk, high yields.
2.3 Municipal Bonds
Issued by local governments or municipalities.
Often tax-exempt in certain jurisdictions.
Attractive for investors seeking tax-efficient income.
2.4 Convertible Bonds
Can be converted into equity shares of the issuing company.
Hybrid instrument combining bond-like stability and equity upside.
2.5 Zero-Coupon Bonds
Pay no periodic interest; sold at a discount.
Investor gains from capital appreciation at maturity.
2.6 Inflation-Linked Bonds
Principal and/or interest payments adjust with inflation.
Examples: U.S. TIPS, India’s Inflation Indexed Bonds.
Useful for hedging against inflation risk.
3. Bond Trading Strategies
Trading bonds requires understanding market cycles, interest rate movements, and credit risks. Strategies can be broadly categorized as:
3.1 Buy and Hold Strategy
Objective: Earn coupon income and principal at maturity.
Best For: Conservative investors and retirees.
Pros: Stability, predictable returns.
Cons: Limited capital gains; sensitive to inflation.
3.2 Active Trading Strategies
3.2.1 Interest Rate Anticipation
Goal: Profit from expected changes in interest rates.
Method: Buy long-duration bonds if rates are expected to fall; sell if rates are expected to rise.
Example: U.S. Treasury futures or Indian G-Secs.
3.2.2 Bond Laddering
Goal: Reduce reinvestment risk and smooth cash flows.
Method: Invest in bonds with staggered maturities.
Benefits: Steady income, flexibility to reinvest at different rates.
3.2.3 Barbell Strategy
Goal: Balance risk and return by investing in short- and long-term bonds.
Method: Avoid intermediate-term bonds.
Pros: High liquidity from short-term bonds, high yields from long-term bonds.
Use Case: Uncertain interest rate environment.
3.2.4 Bullet Strategy
Goal: Concentrate maturities around a specific date to fund known obligations.
Method: Buy bonds maturing around the same period.
Best For: Funding a major expense (e.g., pension payouts, debt obligations).
3.2.5 Credit Spread Trading
Goal: Exploit differences in yields between bonds of varying credit quality.
Method: Buy undervalued bonds or short overvalued bonds.
Caution: Requires strong credit analysis skills.
3.2.6 Yield Curve Strategies
Steepener: Buy long-term bonds, sell short-term bonds if yield curve is expected to steepen.
Flattener: Sell long-term bonds, buy short-term bonds if yield curve is expected to flatten.
Objective: Profit from changes in shape of yield curve, not absolute rates.
3.3 Arbitrage Strategies
Convertible Bond Arbitrage: Exploit mispricing between a convertible bond and its underlying equity.
Treasury Arbitrage: Use derivatives or bond futures to profit from small yield differences across maturities or markets.
4. Fixed-Income Derivatives in Bond Trading
Derivatives enhance bond trading flexibility:
4.1 Futures
Standardized contracts to buy/sell bonds at a future date.
Useful for hedging or speculating on interest rates.
4.2 Options
Call Options: Right to buy a bond at a strike price.
Put Options: Right to sell a bond.
Can hedge against price volatility or take directional bets.
4.3 Swaps
Interest Rate Swap: Exchange fixed for floating interest payments.
Credit Default Swap (CDS): Insurance against default risk.
Widely used by institutional traders to manage risk and leverage positions.
5. Risk Management in Fixed-Income Trading
Trading bonds is not risk-free. Key risks include:
5.1 Interest Rate Risk
Bond prices fall when interest rates rise.
Mitigation: Duration management, interest rate derivatives.
5.2 Credit Risk
Risk of issuer default.
Mitigation: Diversification, credit analysis, CDS.
5.3 Reinvestment Risk
Coupons may be reinvested at lower rates.
Mitigation: Laddering strategy.
5.4 Liquidity Risk
Some bonds, especially corporate and municipal, may be illiquid.
Mitigation: Focus on high-volume instruments or use ETFs.
6.5 Inflation Risk
Erodes real returns of fixed-income instruments.
Mitigation: Inflation-linked bonds, shorter maturities.
6. Technical and Fundamental Analysis for Bond Trading
6.1 Fundamental Analysis
Economic indicators: Inflation, GDP growth, employment, central bank policies.
Credit fundamentals: Debt-to-equity ratios, cash flows, corporate earnings.
Central bank actions and fiscal policy directly impact interest rates and yields.
6.2 Technical Analysis
Price patterns, volume trends, and yield charts.
Common tools: Moving averages, trendlines, RSI, support/resistance for bond ETFs and futures.
7. Global and Indian Bond Market Dynamics
7.1 Global Factors
U.S. Treasury yields set benchmark for global rates.
Geopolitical risk, monetary policies, and inflation expectations drive bond flows.
7.2 Indian Bond Market
Key instruments: Government securities (G-Secs), State Development Loans (SDLs), corporate bonds.
RBI’s monetary policy, inflation trends, and credit growth impact yields.
Indian bond market liquidity is improving, but corporate bonds can be thinly traded.
8. Advanced Trading Considerations
8.1 Algorithmic and Quantitative Trading
High-frequency trading in government bonds.
Arbitrage strategies using yield curve mispricings.
8.2 Portfolio Optimization
Combining bonds of different durations and credit qualities.
Risk-adjusted returns measured using metrics like Sharpe ratio.
8.3 Regulatory and Tax Considerations
Compliance with SEBI, RBI, and international regulations.
Tax efficiency plays a role in bond selection (e.g., municipal bonds in the U.S., tax-free bonds in India).
Conclusion
Bond and fixed-income trading requires a balance of knowledge, patience, and strategy. While bonds are traditionally seen as conservative instruments, sophisticated trading strategies—from interest rate anticipation and yield curve trades to credit spread plays—allow traders to capitalize on market inefficiencies. Understanding bond fundamentals, market dynamics, derivatives, and risk management principles is essential to crafting a successful fixed-income portfolio.
Bonds remain an indispensable tool for both income generation and portfolio diversification, bridging the gap between safety and opportunity in the financial markets.
Global Market Shifts1. Introduction
Global markets are dynamic ecosystems where capital, goods, services, and information flow across borders. Shifts in these markets represent changes in patterns of trade, investment, currency valuation, risk appetite, and economic influence among countries or regions. Understanding these shifts is crucial for investors, policymakers, and traders because they directly influence portfolio strategies, national economic stability, and global financial connectivity.
Global market shifts can be sudden, triggered by geopolitical events, technological breakthroughs, or crises, or they can be gradual, influenced by demographic trends, policy reforms, and shifts in global supply-demand balances. These shifts impact equities, bonds, commodities, foreign exchange, and digital assets, creating opportunities and risks in both short-term trading and long-term investment strategies.
2. Historical Perspective of Global Market Shifts
2.1 Pre-20th Century Shifts
The concept of global markets is not new. Historical shifts can be traced to:
The Age of Exploration (15th–17th century): European expansion opened global trade routes, creating early financial centers in Amsterdam and London.
Industrial Revolution (18th–19th century): Mass production and technological innovation shifted economic power to industrialized nations. Capital markets expanded to fund infrastructure and factories.
Colonial Trade: Commodities like sugar, cotton, and spices became globally traded, influencing global capital flows and wealth distribution.
2.2 Early 20th Century
Interwar Period: Post-WWI reconstruction caused capital flows from the US to Europe. The 1929 stock market crash highlighted the interconnectedness of global financial systems.
Post-WWII Era: Establishment of Bretton Woods institutions (IMF, World Bank) stabilized currencies and encouraged multilateral trade. The US dollar emerged as the global reserve currency, shifting financial power toward the United States.
2.3 Late 20th Century Shifts
Globalization and Trade Liberalization: The 1980s and 1990s saw a surge in cross-border investments, driven by deregulation, technology, and emerging markets (China, India).
Financial Crises: Events like the 1997 Asian Financial Crisis and 2008 Global Financial Crisis reshaped market confidence, risk management practices, and regulatory frameworks worldwide.
3. Drivers of Global Market Shifts
Global market shifts are driven by a combination of economic, technological, geopolitical, and behavioral factors. Understanding these drivers is crucial for predicting trends and managing risks.
3.1 Economic Drivers
Monetary Policy: Interest rate decisions by central banks (Fed, ECB, BoJ) influence capital flows and currency valuations, causing global shifts in investment and trade patterns.
Fiscal Policy: Government spending, taxation, and public debt impact domestic growth, influencing foreign investment.
Inflation & Deflation: High inflation reduces real returns on bonds and equities, causing shifts toward commodities or alternative assets.
Global Trade Dynamics: Trade agreements, tariffs, and sanctions alter supply chains and capital allocation across regions.
3.2 Technological Drivers
Digital Transformation: Automation, AI, blockchain, and fintech innovations reshape global trading, payments, and investment platforms.
High-Frequency Trading (HFT): Algorithmic trading exploits price discrepancies across global markets, accelerating the speed of capital shifts.
Data Availability: Real-time global economic data enables investors to react instantly, increasing volatility and market interconnectedness.
3.3 Geopolitical Drivers
Wars and Conflicts: Conflicts disrupt supply chains, commodity flows, and investor confidence.
Diplomacy and Sanctions: Trade restrictions or sanctions shift market focus toward alternative trading partners.
Political Stability: Stable governments attract foreign investment, while instability triggers capital flight.
3.4 Behavioral and Psychological Drivers
Investor Sentiment: Fear and greed cycles influence global capital allocation and risk appetite.
Herd Behavior: Collective reactions to news or trends can magnify market shifts, causing bubbles or crashes.
Speculation: Short-term speculative activity, especially in currencies and commodities, can exacerbate market swings.
4. Types of Global Market Shifts
4.1 Currency Shifts
Fluctuations in exchange rates impact global trade and investment. Examples include:
Dollar Strength/Weakness: The USD’s dominance affects emerging markets’ debt sustainability.
Currency Crises: Rapid devaluations in countries like Turkey or Argentina can trigger regional financial instability.
4.2 Equity Market Shifts
Sectoral Rotation: Global investment often rotates between sectors based on macroeconomic trends (e.g., tech vs. commodities).
Emerging Market Surges: Markets like China, India, or Brazil attract capital during periods of rapid growth.
Market Corrections: Large-scale corrections ripple through global markets, especially during crises.
4.3 Commodity Market Shifts
Oil & Gas: Geopolitical conflicts in the Middle East or supply disruptions cause global energy price shocks.
Metals & Agriculture: Changing demand from industrializing nations or climate events influence commodity markets.
Precious Metals: Gold and silver act as hedges during currency depreciation or inflation.
4.4 Bond Market Shifts
Interest Rate Changes: Global bond yields react to central bank policies.
Flight-to-Safety Movements: During crises, capital shifts from equities to sovereign bonds in stable economies.
4.5 Digital Asset Shifts
Cryptocurrencies and Central Bank Digital Currencies (CBDCs) introduce new dimensions in cross-border payments and speculative flows, often moving faster than traditional assets.
5. Mechanisms of Global Market Shifts
5.1 Capital Flows
Global capital shifts through foreign direct investment (FDI), portfolio investments, and cross-border loans. Key mechanisms include:
Equity Investment: Buying stocks in foreign markets.
Bond Purchases: Sovereign or corporate bonds attract global investors seeking yields.
Venture Capital & Private Equity: Funding emerging tech and startups drives long-term shifts.
5.2 Trade Shifts
Changes in import/export patterns directly impact currency strength, commodity prices, and equity markets.
Regional trade agreements (e.g., USMCA, RCEP) can reroute capital and investment priorities.
5.3 Technological Interconnectivity
Digital trading platforms, APIs, and HFT algorithms accelerate the speed and scale of global shifts.
Real-time news and analytics platforms make global markets reactive to small events.
5.4 Speculative Movements
Hedge funds and institutional traders use leverage to amplify global market shifts.
Speculative bubbles can cause temporary but impactful disruptions in asset prices.
6. Case Studies of Major Global Market Shifts
6.1 The 2008 Global Financial Crisis
Triggered by US subprime mortgage defaults.
Resulted in a global credit crunch, massive equity declines, and sovereign debt crises.
Shifted investment toward safer assets and caused long-term regulatory reforms.
6.2 COVID-19 Pandemic
Global lockdowns disrupted supply chains, commodity flows, and labor markets.
Accelerated technology adoption and digital finance.
Triggered massive central bank interventions, leading to low interest rates globally.
6.3 US-China Trade War (2018–2020)
Tariffs and sanctions caused supply chain rerouting and increased investment in alternative markets.
Global markets reacted with sectoral shifts, affecting technology, manufacturing, and agriculture.
6.4 Russia-Ukraine Conflict (2022–2025)
Energy and commodity markets experienced historic volatility.
Shifted global energy trade toward renewables and alternative suppliers.
Increased defense spending in Europe influenced equity and bond markets.
7. Implications for Stakeholders
7.1 Investors
Must diversify across regions, sectors, and asset classes.
Require active monitoring of macroeconomic indicators and geopolitical risks.
Can capitalize on emerging market growth or sectoral rotations.
7.2 Traders
High-frequency and algorithmic traders exploit short-term market inefficiencies.
Currency and commodity traders must track global capital flows and central bank policies.
News trading strategies become more critical in volatile environments.
7.3 Policymakers
Need to anticipate capital flight and currency volatility.
Must coordinate with international institutions to stabilize markets during crises.
Regulatory reforms can shape long-term market resilience and investor confidence.
7.4 Corporates
Supply chain disruptions necessitate alternative sourcing strategies.
Foreign exchange volatility affects revenue and profit margins.
Investment planning must account for global economic cycles and market shifts.
8. Emerging Trends Shaping Future Global Market Shifts
8.1 Rise of Emerging Markets
Countries like India, Vietnam, and Nigeria attract FDI due to growth potential.
Shifts capital from traditional power centers (US, EU) to these new hubs.
8.2 Digital Assets and Fintech
Cryptocurrencies, CBDCs, and blockchain-based platforms enable faster, cross-border capital movements.
Decentralized finance may reduce reliance on traditional banking channels.
8.3 Climate Change and ESG Investing
Green finance, carbon trading, and sustainability-linked investments are influencing global capital allocation.
Traditional energy sectors may see declining investments, while renewable energy surges.
8.4 Geopolitical Realignments
Regional conflicts, trade blocs, and shifting alliances (e.g., US–EU–Asia dynamics) will continue to drive market shifts.
Energy independence, defense spending, and technological self-sufficiency influence investment flows.
8.5 AI and Automation
Artificial intelligence accelerates market analysis, predictive modeling, and trading execution.
Could increase volatility but also enhance risk management.
9. Challenges in Navigating Global Market Shifts
Volatility: Rapid shifts can erode capital and destabilize portfolios.
Information Overload: Massive real-time data streams make it difficult to separate noise from meaningful signals.
Policy Uncertainty: Sudden changes in regulations, sanctions, or trade policies create unpredictability.
Technological Disruption: Markets must adapt to fintech innovations, automated trading, and digital currencies.
Climate & ESG Risks: Environmental crises and regulations may cause unexpected sectoral disruptions.
10. Conclusion
Global market shifts are a complex interplay of economic, geopolitical, technological, and behavioral forces. They can be incremental or sudden, affecting currencies, equities, commodities, bonds, and digital assets. Historical crises demonstrate the interconnected nature of markets, while emerging trends highlight the importance of technology, sustainability, and global cooperation.
For investors, traders, corporates, and policymakers, understanding these shifts is no longer optional—it is essential. Effective strategies require real-time information, diversified portfolios, risk management, and a forward-looking approach that anticipates structural changes in the global economy.
By studying past shifts and monitoring ongoing developments, market participants can navigate volatility, capitalize on opportunities, and mitigate risks in an increasingly interconnected financial world.

Part 4 Institutional TradingThe Structure of an Option Contract
Every option contract has certain key components:
Underlying asset – The stock, index, or commodity the option is based on.
Strike price – The agreed-upon price at which the asset can be bought or sold.
Expiration date – The last date when the option can be exercised.
Premium – The cost paid by the buyer to the seller.
Lot size – The standardized quantity of the underlying represented by one option contract.
Example:
If you buy a Nifty 20,000 Call Option at ₹200 premium, one lot size is 50.
Total cost = ₹200 × 50 = ₹10,000.
You gain if Nifty moves above 20,200 (strike + premium).

Part 3 Institutional Trading 1. What Are Options?
1.1 Definition
An option is a financial derivative contract that gives the buyer the right, but not the obligation, to buy or sell an underlying asset at a predetermined price (strike price) on or before a specified date (expiry).
Call Option: Right to buy.
Put Option: Right to sell.
The buyer of an option pays a premium to the seller (writer) for acquiring this right.
1.2 Underlying Assets
Options can be written on:
Equities (stocks)
Indices (Nifty, S&P 500, etc.)
Commodities (gold, crude oil)
Currencies (USD/INR, EUR/USD)
Interest rates & bonds
This wide range makes them versatile instruments for trading and hedging.

Part 2 Ride The Big MovesIntroduction
Financial markets have evolved significantly over the last century, offering a wide variety of instruments to investors and traders. One such instrument is options, which provide flexibility, leverage, and hedging opportunities. Unlike straightforward investments such as stocks or bonds, option trading involves contracts that derive their value from an underlying asset—making them part of the broader derivatives market.
For professional traders, options are indispensable for hedging risk, generating income, and leveraging market moves. For retail participants, they represent both a fascinating opportunity and a high-risk tool that requires discipline and knowledge.
This guide explains option trading in detail, starting from the basics and moving into advanced strategies, risks, and practical applications.

Part 11 Trading Master Class With ExpertsI. Option Trading Strategies
Buying Calls and Puts
Buying a Call: Profitable if asset price rises above strike + premium.
Buying a Put: Profitable if asset price falls below strike - premium.
Covered Call Strategy
Involves holding the underlying stock and selling a call option.
Generates premium income but limits upside profit.
Protective Put
Buying a put while holding the underlying asset as insurance against a price drop.
Spreads
Combine buying and selling options to reduce risk and cost:
Bull Call Spread: Buy lower strike call, sell higher strike call.
Bear Put Spread: Buy higher strike put, sell lower strike put
Straddles and Strangles
Straddle: Buy ATM call and put; profitable if price moves significantly either way.
Strangle: Buy OTM call and put; cheaper than straddle, requires larger movement.
Iron Condor
Advanced strategy combining bull and bear spreads.
Generates income with limited risk in low-volatility markets.
Calendar and Diagonal Spreads
Utilize different expiration dates and strikes to profit from time decay and volatility.
II. Risk Management in Options
Leverage and Risk
Options offer high leverage: small price moves in underlying asset can lead to large gains or losses. Proper position sizing is crucial.
Maximum Loss and Gain
Buyer: Max loss = premium paid; Max gain = theoretically unlimited for calls, limited for puts.
Seller: Max gain = premium received; Max loss = potentially unlimited for naked calls.
Diversification Across Strategies
Mixing spreads, covered calls, and protective puts helps reduce single-position risk.
Stop-Loss and Exit Strategies
Plan exit points: cut losses, take partial profits, or roll positions to new strikes or expirations.
III. Market Mechanics and Trading
Exchanges and Option Contracts
Options trade on regulated exchanges (e.g., NSE, BSE, CBOE). Each contract represents a fixed quantity of the underlying (e.g., 100 shares per contract).
Liquidity and Open Interest
Liquidity: Ease of buying/selling options at fair prices.
Open Interest: Number of outstanding contracts; higher OI often means better liquidity.
Implied Volatility and Market Sentiment
IV: Market’s forecast of future volatility.
Rising IV generally increases option premiums, signaling uncertainty.
Hedging vs. Speculation
Options can hedge existing positions or speculate on market movements. Hedging reduces risk, speculation increases risk but offers leverage.

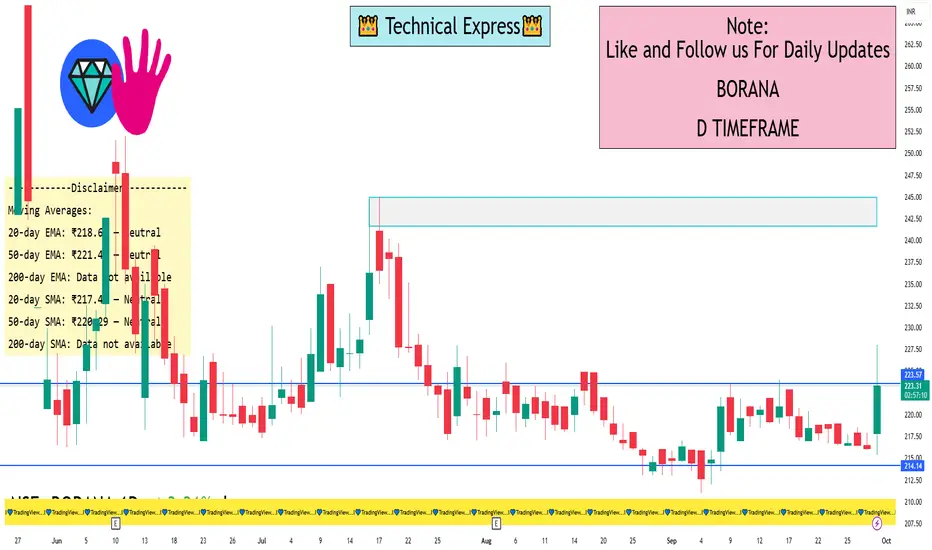
BORANA 1 Day ViewBORANA is trading at ₹222.33, reflecting a 2.86% increase for the day.
📈 1-Day Technical Overview
Opening Price: ₹217.85
Day’s Range: ₹215.35 – ₹228.00
Closing Price: ₹222.33
Volume: Approximately 166,570 shares traded
🔍 Key Technical Indicators
RSI (14): 60.94 — Neutral to bullish, indicating moderate buying interest
MACD: 0.24 — Bullish, suggesting upward momentum
ADX (14): 19.01 — Neutral, implying no strong trend direction
Stochastic RSI: 0 — Strong downtrend, caution advised
Williams %R: -37.15 — Neutral, no clear overbought or oversold signal
Moving Averages:
20-day EMA: ₹218.62 — Neutral
50-day EMA: ₹221.40 — Neutral
200-day EMA: Data not available
20-day SMA: ₹217.44 — Neutral
50-day SMA: ₹220.29 — Neutral
200-day SMA: Data not available
📊 Summary
The stock is experiencing a positive intraday movement, trading above its opening price and near the day's high. While the RSI and MACD indicate moderate bullishness, the Stochastic RSI suggests a potential downtrend. Investors should monitor these indicators closely for any signs of trend reversal or continuation.
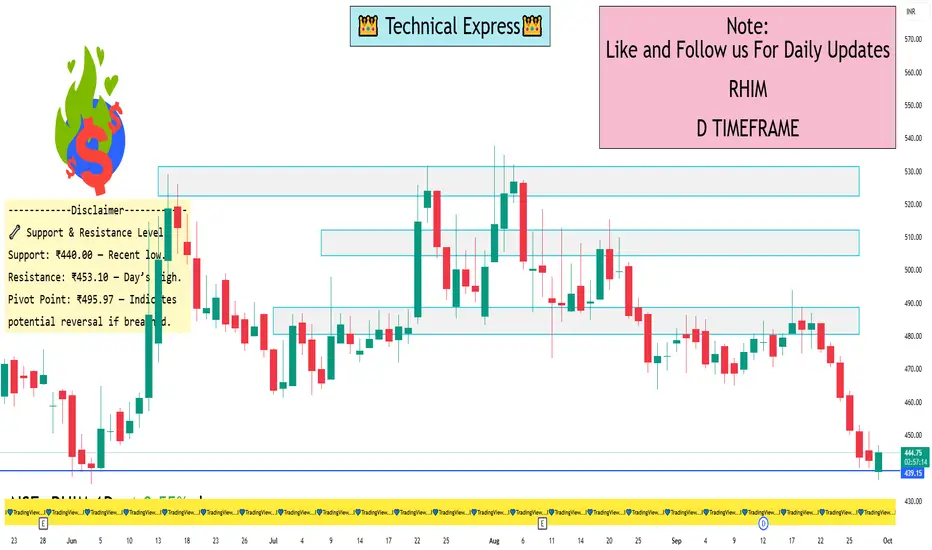
RHIM 1 Day View📊 Technical Overview
Current Price: ₹445.00
Day’s Range: ₹440.00 – ₹453.10
Previous Close: ₹451.45
52-Week Range: ₹376.45 – ₹640.00
🔻 Bearish Indicators
RSI (14): 24.86 — Oversold condition, suggesting potential for a rebound.
MACD: -7.80 — Indicates downward momentum.
Moving Averages:
5-day: ₹444.48 — Slightly above current price.
50-day: ₹469.06 — Bearish crossover.
200-day: ₹478.22 — Further confirmation of downtrend.
Technical Indicators: Strong Sell signals across multiple platforms.
🔧 Support & Resistance Levels
Support: ₹440.00 — Recent low.
Resistance: ₹453.10 — Day’s high.
Pivot Point: ₹495.97 — Indicates potential reversal if breached.
⚠️ Summary
RHI Magnesita India Ltd is currently in a downtrend, with technical indicators signaling a strong sell. The stock is approaching key support levels, and while it is oversold, caution is advised. Traders should monitor for any bullish reversal patterns or volume spikes before considering entry points.
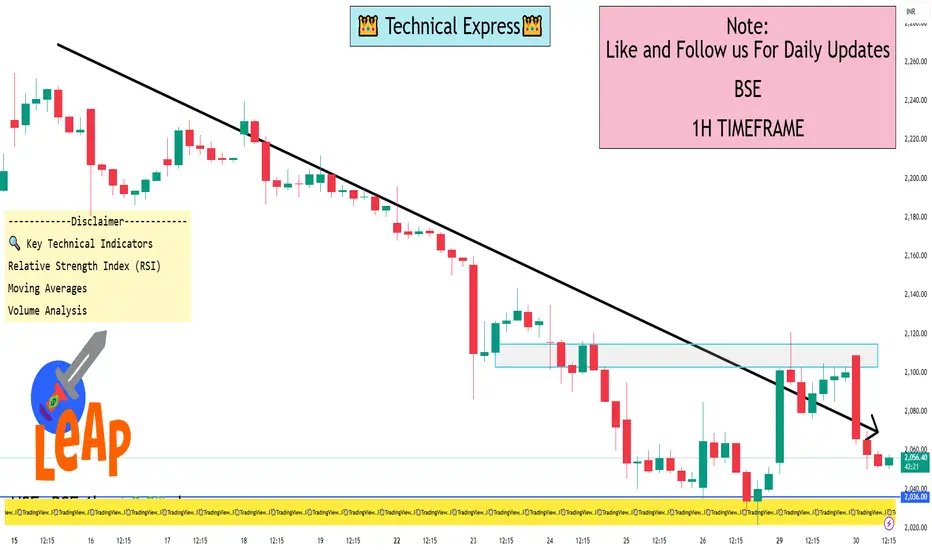
BSE 1 Hour ViewBSE is trading at ₹2,054.60, reflecting a 2.04% decline for the day.
📊 1-Hour Time Frame Technical Analysis
On the 1-hour chart, BSE Ltd. is exhibiting a "Strong Sell" signal across both technical indicators and moving averages. This suggests a prevailing short-term downtrend, with the stock trading below its key moving averages.
🔍 Key Technical Indicators
Relative Strength Index (RSI): Currently below 30, indicating the stock is in oversold territory and may be due for a short-term rebound.
Moving Averages: The stock is trading below its 5-day, 20-day, 50-day, 100-day, and 200-day moving averages, suggesting a bearish trend.
Volume Analysis: Recent trading volumes have been lower than average, indicating reduced investor participation.
📈 Support and Resistance Levels
Immediate Support: ₹2,000
Immediate Resistance: ₹2,100
A break below ₹2,000 could signal further downside, while a move above ₹2,100 may indicate a potential reversal.
⚠️ Considerations for Traders
Given the current "Strong Sell" signals, traders should exercise caution. It's advisable to wait for confirmation of a trend reversal before entering long positions. Utilizing a multi-timeframe analysis can provide a more comprehensive view of the stock's potential movements.
Retail vs Institutional Trading1. Introduction to Trading Participants
1.1 Retail Traders
Retail traders, often referred to as individual investors, are non-professional participants in financial markets. They trade personal funds rather than pooled or client capital. Retail traders can include anyone from a small investor buying a few shares in the stock market to active traders participating in forex, commodities, or cryptocurrency markets.
Key Characteristics:
Trade smaller volumes compared to institutions.
Decisions are often influenced by news, social media, market sentiment, or personal beliefs.
Typically have limited access to advanced tools and institutional-grade research.
1.2 Institutional Traders
Institutional traders represent organizations managing large sums of money, including mutual funds, hedge funds, pension funds, insurance companies, banks, and investment firms. They trade on behalf of clients or institutional portfolios and often have significant influence on market prices due to their trade volumes.
Key Characteristics:
Trade in large volumes, often moving markets.
Utilize professional research, proprietary trading algorithms, and sophisticated analytics.
Longer-term investment horizons, though some engage in high-frequency trading.
2. Market Participation and Influence
2.1 Retail Participation
Retail traders historically had limited influence in the markets due to smaller trade sizes. However, the rise of online trading platforms, zero-commission trading, and social media-driven movements (e.g., meme stocks) has increased retail impact in recent years.
Advantages of Retail Participation:
Flexibility to react quickly.
Ability to pursue niche opportunities or speculative trades.
Lower regulatory burdens allow creative strategies.
Disadvantages:
Susceptibility to emotional trading.
Higher vulnerability to market manipulation.
Limited access to professional research and tools.
2.2 Institutional Participation
Institutional traders dominate market liquidity and pricing. Their large trades can move market prices, create trends, or influence volatility. They are also instrumental in market stability as they provide liquidity during periods of stress.
Advantages of Institutional Trading:
Access to advanced market intelligence and professional research.
Ability to use sophisticated trading strategies, including algorithmic trading.
Can leverage economies of scale for reduced transaction costs.
Disadvantages:
Large trades may impact markets in ways that reduce profitability.
Regulatory scrutiny is stringent, limiting flexibility.
Requires complex risk management due to large exposure.
3. Trading Strategies
3.1 Retail Trading Strategies
Retail traders often employ strategies based on technical analysis, short-term news, or trend-following techniques.
Popular Strategies:
Day Trading: Buying and selling securities within the same trading day.
Swing Trading: Holding positions for several days to capture short-term market movements.
Momentum Trading: Riding price trends based on market sentiment.
News Trading: Reacting to economic reports, corporate earnings, or geopolitical events.
3.2 Institutional Trading Strategies
Institutional traders adopt more sophisticated strategies due to their large capital base and professional resources.
Popular Strategies:
Algorithmic Trading (Algo-Trading): Using computer programs to execute trades at optimal prices.
High-Frequency Trading (HFT): Executing thousands of trades in milliseconds to exploit small market inefficiencies.
Arbitrage: Taking advantage of price differences across markets.
Hedging and Risk Management: Using derivatives to manage exposure to currency, interest rate, or market risk.
4. Risk Management
4.1 Retail Risk Management
Retail traders often rely on basic risk management tools such as:
Stop-loss orders.
Position sizing based on personal risk tolerance.
Diversification across a few stocks or sectors.
However, retail investors are prone to emotional decisions, such as holding losing positions too long or chasing returns impulsively.
4.2 Institutional Risk Management
Institutions adopt structured risk frameworks, including:
Value-at-Risk (VaR): Quantifying potential losses under normal market conditions.
Stress Testing: Evaluating portfolio performance under extreme scenarios.
Diversification and Hedging: Using derivatives, multiple asset classes, and global exposure to mitigate risk.
Regulatory Compliance: Ensuring all trades adhere to legal and fiduciary requirements.
5. Technology and Tools
5.1 Retail Technology
Retail traders have benefited from:
Online trading platforms like Zerodha, Robinhood, and E*TRADE.
Mobile apps for instant trading and market tracking.
Charting tools for technical analysis (TradingView, MetaTrader).
5.2 Institutional Technology
Institutions use highly advanced tools:
Proprietary trading algorithms with AI and machine learning.
Direct market access (DMA) platforms for faster execution.
Risk analytics software for real-time portfolio monitoring.
Big data analytics for predictive market insights.
6. Regulatory Environment
6.1 Retail Trading Regulations
Retail traders are primarily regulated to ensure transparency and protect against fraud:
Know Your Customer (KYC) requirements.
Disclosure of fees and commissions.
Restrictions on certain high-risk products without adequate knowledge.
6.2 Institutional Trading Regulations
Institutional traders face stricter oversight:
Reporting large trades and positions.
Compliance with investment mandates.
Adherence to market conduct rules and fiduciary duties.
Stress testing for systemic risk management.
7. Psychology and Behavioral Differences
7.1 Retail Trader Psychology
Retail traders are heavily influenced by emotion:
Fear and Greed: Leading to panic selling or impulsive buying.
Overconfidence: Believing in personal market insight without adequate data.
Herd Mentality: Following trends or social media-driven movements.
7.2 Institutional Trader Psychology
Institutional traders operate under disciplined frameworks:
Decisions are data-driven and analytical.
Emotional biases are minimized through systematic strategies.
Portfolio-level focus reduces reactionary decisions.
8. Conclusion
The contrast between retail and institutional trading illustrates the diversity of market participants. Retail traders bring flexibility, innovation, and sentiment-driven momentum, while institutions contribute liquidity, stability, and analytical rigor. Both are essential for a healthy financial ecosystem.
Understanding their differences, behaviors, and strategies allows traders to navigate markets more effectively, whether by learning from institutional methodologies or leveraging the unique advantages of retail agility. In today’s technology-driven world, the line between retail and institutional trading is increasingly blurred, creating a dynamic and evolving marketplace where knowledge, strategy, and discipline define success.
Technical Analysis vs. Option Chain Analysis in Trading1. Introduction to Technical Analysis
Technical Analysis is the study of historical price and volume data to forecast future price movements. Unlike fundamental analysis, which focuses on the intrinsic value of an asset based on financials and macroeconomic indicators, technical analysis relies solely on market data.
Core Principles of Technical Analysis:
Price Discounts Everything:
TA assumes that all known information (fundamental, political, economic) is already reflected in the price. Therefore, price movements are sufficient for forecasting future trends.
Price Moves in Trends:
Markets rarely move randomly. They exhibit trends—uptrend, downtrend, or sideways—which traders identify and trade accordingly.
History Repeats Itself:
Market behavior tends to repeat due to human psychology, making chart patterns, technical indicators, and market cycles predictive.
Key Tools in Technical Analysis:
Charts: Line charts, bar charts, candlestick charts
Indicators: RSI, MACD, Bollinger Bands, moving averages
Patterns: Head & shoulders, double top/bottom, triangles
Volume Analysis: Confirms trends and reversals
Practical Applications:
Identifying entry and exit points
Spotting trends and reversals
Risk management using support, resistance, and stop-loss
Advantages of Technical Analysis:
Works in all market conditions
Can be automated using algorithmic trading
Useful for both short-term and long-term trading
Limitations:
Subjective interpretation of charts
Can give false signals in volatile markets
Does not consider underlying fundamentals
2. Introduction to Option Chain Analysis
Option Chain Analysis involves examining the details of options contracts available for a particular stock or index. An option chain lists all available options (calls and puts) along with their strike prices, premiums, open interest (OI), and volume.
Unlike technical analysis, option chain analysis is specific to derivatives and is used to infer market sentiment and potential price movements.
Core Concepts of Option Chain Analysis:
Calls and Puts:
Call Option: Right to buy at a specific price
Put Option: Right to sell at a specific price
Strike Price: The price at which the underlying asset can be bought or sold.
Open Interest (OI): Number of outstanding contracts. High OI at specific strikes can indicate support or resistance zones.
Volume: Number of contracts traded in a day, indicating trader interest.
Implied Volatility (IV): Market’s forecast of volatility, impacting option premiums.
Key Applications of Option Chain Analysis:
Identifying support and resistance levels using maximum OI strikes
Predicting short-term price movements based on put-call ratios (PCR)
Planning hedging strategies using options
Understanding market sentiment
Advantages:
Provides real-time insight into market sentiment
Useful for short-term trading and intraday strategies
Helps in planning hedging strategies for portfolios
Limitations:
Requires understanding of options pricing
Complex for beginners
Influenced by external factors like volatility and time decay
3. Technical Analysis in Depth
3.1 Price Action
Price action refers to the movement of price over time.
Candlestick patterns (Doji, Hammer, Engulfing) help identify reversals and continuations.
Trendlines and channels assist in visualizing the market direction.
3.2 Indicators and Oscillators
Moving Averages: Smooth out price data; 50-day & 200-day MAs show trend strength.
MACD (Moving Average Convergence Divergence): Shows momentum and trend changes.
RSI (Relative Strength Index): Identifies overbought/oversold conditions.
Bollinger Bands: Measures volatility; price touching bands signals potential reversal.
3.3 Volume Analysis
Volume confirms trend strength.
Rising price with high volume = strong trend; Falling price with high volume = potential reversal.
3.4 Chart Patterns
Reversal Patterns: Head & Shoulders, Double Top/Bottom
Continuation Patterns: Triangles, Flags, Pennants
4. Option Chain Analysis in Depth
4.1 Understanding Option Data
Calls vs Puts: Analyzing the ratio helps gauge bullish or bearish sentiment.
Open Interest (OI): Strikes with high OI act as psychological support/resistance.
Volume: High trading volume at a strike indicates trader focus.
4.2 Put-Call Ratio (PCR)
PCR = Total Put OI / Total Call OI
PCR > 1 indicates bearish sentiment; PCR < 1 indicates bullish sentiment.
4.3 Max Pain Theory
Max Pain = strike where option writers lose the least money
Price tends to gravitate towards max pain level near expiry
4.4 Implied Volatility (IV)
High IV = expensive options, often during high uncertainty
Low IV = cheap options, during stable periods
Helps in timing entry and exit points in options trading
5. Integrating Technical and Option Chain Analysis
Successful traders often combine both approaches:
Confirming Trend with TA and OCA:
Technical indicators may show uptrend.
Option chain OI analysis confirms resistance/support levels, giving high-probability entry points.
Hedging Positions:
Buy stock based on TA trend.
Hedge using options with OCA support.
Intraday Trading:
Use TA for momentum and pattern breakout.
Use OCA for strike-based resistance and price targets.
Volatility Trading:
Use TA to identify consolidation or breakout zones.
Use OCA IV data to choose options strategies (straddle, strangle).
6. Case Study Example
Stock: XYZ Ltd.
TA Observation: 50-day MA trending upward, RSI around 65 → bullish bias
Option Chain Analysis:
Max Call OI at 150 strike → strong resistance
Max Put OI at 140 strike → strong support
PCR = 0.8 → bullish sentiment
Trading Strategy:
Enter long near support (140)
Target price near resistance (150)
Use options to hedge if breakout fails
7. Pros and Cons in Trading Context
7.1 Technical Analysis Pros and Cons
Pros:
Easy to interpret
Widely applicable
Works across timeframes
Cons:
Cannot measure market sentiment directly
False breakouts possible
Subjective
7.2 Option Chain Analysis Pros and Cons
Pros:
Reveals trader sentiment
Helps with hedging
Useful for expiry-week trading
Cons:
Complex interpretation
Affected by volatility and time decay
Requires options knowledge
8. Conclusion
Both Technical Analysis and Option Chain Analysis are indispensable tools for traders. While TA provides a structured approach to reading price trends and patterns, OCA adds depth by revealing market sentiment and strike-based support/resistance. Combining both approaches gives traders a holistic view, enabling better risk management, precise entry/exit points, and a strategic edge in the market.
TA: Broadly applicable, trend and pattern-based, foundational for all traders.
OCA: Derivatives-focused, sentiment-driven, crucial for options and intraday trading.
Combined Approach: Confirms technical signals, improves probability of success, and optimizes risk management.
For modern traders, understanding both TA and OCA is no longer optional—it is essential to navigate volatile markets and enhance decision-making capabilities.
Option Trading Complete Guidence1. Introduction to Option Trading
Option trading is one of the most powerful and flexible tools in financial markets. Unlike buying stocks directly, where you simply own a share of a company, options allow traders to speculate, hedge, and leverage positions without necessarily owning the underlying asset. They are part of a broader group of financial products called derivatives, meaning their value is derived from an underlying asset like stocks, indices, commodities, or currencies.
At its core, an option is a contract that gives the buyer the right, but not the obligation, to buy or sell an underlying asset at a predetermined price (strike price) within a specified time. The seller (or writer) of the option, however, takes on the obligation to fulfill the contract if the buyer decides to exercise it.
2. Call Options and Put Options
Options come in two main types:
Call Option: Gives the buyer the right to buy the underlying asset at the strike price before expiry. Traders use calls when they expect the price to rise.
Put Option: Gives the buyer the right to sell the underlying asset at the strike price before expiry. Traders use puts when they expect the price to fall.
Example: If you buy a call option on Reliance at ₹2,500 with one month to expiry, and Reliance rises to ₹2,700, you can buy it cheaper (₹2,500) while the market trades higher. Conversely, if the price falls below ₹2,500, you can simply let the option expire, losing only the premium you paid.
3. Premium – The Cost of Options
The price of an option is called the premium. It is the amount the buyer pays to the seller for the rights the option provides. The premium is influenced by several factors, including:
Underlying Price – The closer the stock is to the strike price, the more valuable the option.
Time to Expiry – More time means more opportunity for movement, so longer-dated options cost more.
Volatility – High volatility increases the premium since the probability of hitting profitable levels rises.
Interest Rates & Dividends – Affect option pricing, though impact is usually smaller in stock options.
4. How Options Differ from Stocks
Unlike stocks, where risk is unlimited on the downside (the stock could fall to zero), option buyers’ risk is limited to the premium paid. For sellers, however, risk can be much larger. Another big difference is leverage. With relatively small capital, option traders can take large positions, magnifying potential gains and losses.
5. American vs. European Options
American Options: Can be exercised anytime before expiry. (Used in US equity markets.)
European Options: Can only be exercised at expiry. (Used in India’s NSE index options like NIFTY and BANKNIFTY.)
6. Uses of Options
Options are versatile and serve multiple purposes:
Speculation – Traders bet on short-term price movements.
Hedging – Investors use options to protect against adverse moves in their portfolios.
Income Generation – By selling options, traders collect premiums to earn steady returns.
Leverage – Amplify exposure with smaller capital.
7. Option Buyers vs. Option Sellers
Buyer: Pays premium, has limited risk, unlimited profit potential (in theory).
Seller (Writer): Receives premium, has limited profit (premium received), potentially unlimited loss.
This asymmetry makes options attractive to aggressive buyers and income-seeking sellers.
8. Factors Affecting Option Pricing (The Greeks)
Options pricing involves mathematical models like the Black-Scholes Model, but traders often rely on "Greeks" to understand risk:
Delta: Sensitivity to underlying price movement.
Gamma: Rate of change of Delta.
Theta: Time decay – options lose value as expiry approaches.
Vega: Sensitivity to volatility.
Rho: Sensitivity to interest rates.
Example: An option with high Theta loses value rapidly as expiry nears if the underlying doesn’t move.
9. Simple Option Strategies
Beginners usually start with these basic plays:
Buying Calls – Bullish outlook.
Buying Puts – Bearish outlook.
Covered Call – Owning stock + selling calls to earn premium.
Protective Put – Holding stock but buying a put as insurance.
10. Advanced Option Strategies
Professional traders combine multiple options to balance risk and reward:
Straddle: Buy both call and put at the same strike → Profits from large move in either direction.
Strangle: Similar to straddle, but strikes are different → Cheaper, wider profit range.
Bull Call Spread: Buy call at lower strike, sell call at higher strike → Limited profit, reduced cost.
Iron Condor: Selling out-of-the-money call and put while buying protection → Earns from low volatility.

Part 2 Support and Resistance1. Introduction to Option Trading
Options are one of the most versatile financial instruments available in the world of trading. They are derivatives, meaning their value is derived from an underlying asset such as stocks, indices, commodities, or currencies. Unlike buying or selling the underlying asset directly, options provide traders with the right, but not the obligation, to buy (call option) or sell (put option) the asset at a predetermined price (strike price) within a specified time period (expiration).
Options are unique because they allow traders to leverage small capital into larger potential gains, manage risk with hedging strategies, and create income through option writing. At the same time, they carry high risk when misused, particularly due to time decay, volatility fluctuations, and complex pricing models.
2. The Basics of Options: Calls and Puts
The two fundamental building blocks of option trading are Call Options and Put Options:
Call Option: Gives the buyer the right to buy an asset at a fixed strike price before or on the expiration date. Traders buy calls if they expect the price of the asset to rise.
Put Option: Gives the buyer the right to sell an asset at a fixed strike price. Traders buy puts if they expect the price of the asset to fall.
Example: If stock XYZ is trading at ₹100, a call option with a strike price of ₹105 expiring in one month gives the buyer the right to buy the stock at ₹105. If the stock rises to ₹120, the option becomes profitable. Conversely, a put option with a strike of ₹95 would benefit if the stock fell below ₹95.
3. Understanding Option Premiums
An option buyer pays a premium to acquire the rights. This premium is determined by several factors:
Intrinsic Value: The actual in-the-money value (e.g., if stock is ₹120 and strike price is ₹100 call, intrinsic value = ₹20).
Time Value: The extra value based on time remaining until expiration. Longer time = higher premium.
Volatility: Higher expected price fluctuations increase premiums.
Interest Rates & Dividends: Play a minor but measurable role in pricing.
This pricing is mathematically modeled by the Black-Scholes Model and Binomial Option Pricing Model.
4. European vs. American Options
Options differ in terms of when they can be exercised:
European Options: Can be exercised only at expiration.
American Options: Can be exercised any time before expiration.
Most index options in India are European style, while stock options in the U.S. are often American style.
5. The Greeks – Risk Measurement Tools
To manage option risk, traders rely on Option Greeks, which quantify how premiums move with changes in price, volatility, and time:
Delta (Δ): Sensitivity of option price to changes in underlying price.
Gamma (Γ): Rate of change of Delta.
Theta (Θ): Time decay effect on options.
Vega (ν): Sensitivity to volatility changes.
Rho (ρ): Sensitivity to interest rate changes.
Understanding Greeks is like having a navigation map for option strategies.

Part 1 Support and Resistance Part 1: Introduction to Options
Options are a derivative financial instrument, meaning their value is derived from an underlying asset like a stock, commodity, index, or currency. Unlike buying the actual asset, options give you the right—but not the obligation—to buy or sell the underlying asset at a predetermined price (strike price) before or on a specific date (expiry).
The core advantage of options lies in their flexibility and leverage. A trader can control a large amount of stock with a relatively small investment—the premium paid. Options are widely used for three main purposes:
Speculation: Traders bet on price movement of the underlying asset.
Hedging: Investors protect their portfolios against adverse price moves.
Income Generation: Selling options can provide regular premium income.
Options are classified based on exercise style:
American options: Can be exercised any time before expiry.
European options: Can only be exercised at expiry.
Example: Suppose a stock trades at ₹100, and you expect it to rise. You could buy a call option with a strike price of ₹105. This option allows you to buy the stock at ₹105, even if it rises to ₹120. If the stock never crosses ₹105, you only lose the premium paid.
Options are highly versatile. They can be used to profit in bullish, bearish, or sideways markets, making them more dynamic than regular stock trading. However, they are also riskier because the time-sensitive nature of options (time decay) can erode profits if the market doesn’t move as expected.
Part 2: Types of Options
Options come in two basic types:
1. Call Option
A call option gives the buyer the right to buy the underlying asset at the strike price. Buyers benefit if the asset price rises above the strike price plus premium. Sellers, called writers, have the obligation to sell if the buyer exercises the option.
Example:
Stock Price: ₹100
Strike Price: ₹105
Premium: ₹5
Break-even for buyer = Strike + Premium = 105 + 5 = ₹110. Profit starts above ₹110.
Profit Calculation for Call Buyer:
Profit = Max(0, Stock Price – Strike) – Premium
2. Put Option
A put option gives the buyer the right to sell the underlying asset at the strike price. Buyers profit if the asset price falls below the strike price minus premium. Sellers have the obligation to buy if the buyer exercises.
Example:
Stock Price: ₹100
Strike Price: ₹95
Premium: ₹3
Break-even = Strike – Premium = 95 – 3 = ₹92. Profit starts below ₹92.
Profit Calculation for Put Buyer:
Profit = Max(0, Strike – Stock Price) – Premium
Part 3: Option Terminology
To trade options effectively, understanding terminology is crucial:
Strike Price (Exercise Price): Price at which the option can be exercised.
Premium: Cost of buying the option. It depends on intrinsic value, time value, volatility, and interest rates.
Expiration Date: Last date an option can be exercised.
In-the-Money (ITM): Call: Stock > Strike, Put: Stock < Strike. Profitable if exercised immediately.
Out-of-the-Money (OTM): Call: Stock < Strike, Put: Stock > Strike. Not profitable if exercised immediately.
At-the-Money (ATM): Stock ≈ Strike Price. Usually has highest time value.
Intrinsic Value: Value if exercised now (Stock – Strike for calls, Strike – Stock for puts).
Time Value: Additional premium due to remaining time until expiry.
Premium Formula:
Premium = Intrinsic Value + Time Value
Example:
Stock = ₹120, Call Strike = ₹100, Premium = ₹25
Intrinsic Value = 120 – 100 = ₹20
Time Value = Premium – Intrinsic Value = 25 – 20 = ₹5
Time decay reduces this value daily, especially for options close to expiry.
Part 4: How Options Work
Options trading involves buying and selling contracts:
Buying a Call Option
Expectation: Stock price will rise.
Loss is limited to the premium.
Profit is unlimited if the stock keeps rising.
Example: Buy call with strike ₹105, premium ₹5, stock rises to ₹120.
Profit = 120 – 105 – 5 = ₹10
Buying a Put Option
Expectation: Stock price will fall.
Loss is limited to the premium.
Profit = Strike – Stock – Premium
Example: Buy put with strike ₹95, premium ₹3, stock falls to ₹85.
Profit = 95 – 85 – 3 = ₹7
Writing Options
Writing calls: Seller gets premium, but risk is unlimited if stock rises sharply.
Writing puts: Seller gets premium, but risk is significant if stock falls.
Options are exercised or expired:
Exercise: Buyer uses the right to buy/sell.
Assignment: Seller fulfills the obligation.

MRPL 1 Day View📊 MRPL 1-Day Technical Snapshot
Current Price: ₹133.83
Day Range: ₹127.56 – ₹137.60
Previous Close: ₹127.39
Volume: 9.3 million shares
VWAP: ₹134.30
Market Cap: ₹23,455 crore
52-Week Range: ₹98.92 – ₹186.45
All-Time High: ₹289.25
P/E Ratio: Not applicable (negative earnings)
ROE: 0.45%
📈 Technical Indicators
RSI (14-day): 44 — Neutral zone, indicating balanced buying and selling pressure.
EMA (200-day): Approximately ₹150 — The stock is trading below this long-term average, suggesting a bearish trend.
Support Levels: ₹127.50, ₹120.00
Resistance Levels: ₹137.60, ₹145.00
🔍 Chart Patterns & Sentiment
Consolidation Phase: The stock is currently in a consolidation phase between ₹127 and ₹137, forming a potential ascending triangle pattern.
Volume Analysis: Increased trading volume today indicates heightened investor interest, possibly due to upcoming earnings expectations or
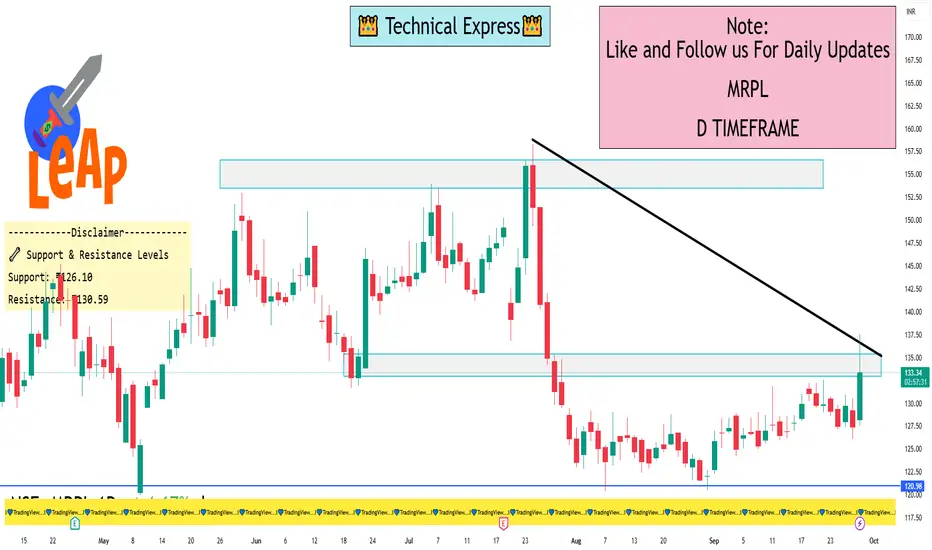
IOB 1 Week View📊 Key Technical Indicators
Moving Averages: The stock is trading below its 5-day, 50-day, and 200-day moving averages, all indicating a sell trend.
Relative Strength Index (RSI): The 14-day RSI stands at 39.62, suggesting the stock is in a neutral to bearish condition.
MACD: The MACD is negative, reinforcing the bearish trend.
📈 Support and Resistance Levels
Support Levels: ₹37.84 (weekly pivot), ₹37.56 (short-term support), ₹36.07 (lower range of horizontal trend).
Resistance Levels: ₹39.75 (weekly pivot), ₹39.59 (near-term resistance), ₹41.08 (upper range of horizontal trend).
🔍 Trend Analysis
The stock is moving within a wide and horizontal trend, with a 90% probability of trading between ₹36.07 and ₹41.08 over the next three months.
⚠️ Outlook
The prevailing trend is bearish, with no significant positive signals at the moment. A break above the resistance levels could indicate a potential reversal, but currently, the stock remains under pressure.
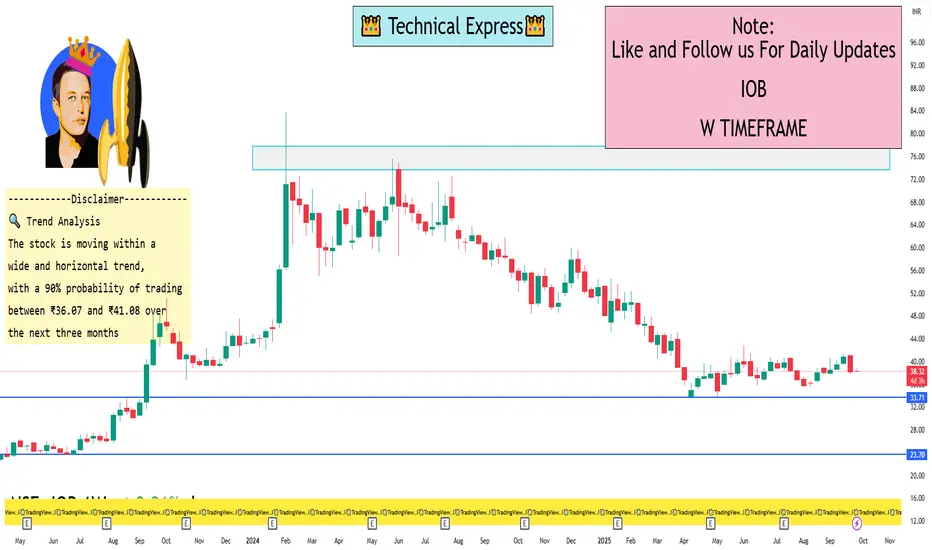
Part 6 Institutional TradingPart 1: Role of Implied Volatility
Implied volatility (IV) reflects market expectations of future price movement.
High IV → Expensive options, profitable for sellers if volatility drops.
Low IV → Cheap options, profitable for buyers if volatility rises.
IV is a key factor in selecting strategies and timing trades.
Part 2: Time Decay in Options (Theta)
Options lose value as expiration approaches due to time decay.
Long options: Lose value over time if price doesn’t move.
Short options: Benefit from decay as premium erodes.
Understanding time decay is critical for timing trades.
Part 3: Hedging with Options
Options are powerful hedging tools:
Protect portfolios from market downturns using puts.
Lock in future prices for commodities.
Reduce risk while maintaining upside potential.
Hedging requires understanding correlation and position sizing.
Part 4: Speculation Using Options
Options allow leveraged speculation:
Small capital can control large positions.
Enables directional bets on bullish, bearish, or volatile markets.
High leverage carries high risk and potential loss of the entire premium.
Part 5: Options Market Participants
Key participants include:
Hedgers: Reduce risk from price fluctuations.
Speculators: Take positions for profit from price movements.
Arbitrageurs: Exploit pricing inefficiencies.
Market Makers: Provide liquidity by quoting bid and ask prices.
Part 6: Options on Indices vs Stocks
Stock Options: Based on individual stocks, more sensitive to company events.
Index Options: Based on market indices, less prone to individual stock risk.
Index options often used for hedging broad market exposure.
Part 7: Regulatory Environment
Options trading is regulated to ensure market integrity:
Exchanges like NSE, BSE in India; CBOE in the US.
Margin requirements for sellers.
Reporting and compliance rules.
Surveillance to prevent manipulation.
Part 8: Risks in Option Trading
Risks include:
Market Risk: Price moves against the position.
Time Decay Risk: Value erodes as expiration nears.
Liquidity Risk: Inability to exit positions at fair price.
Volatility Risk: Unexpected market volatility.
Proper risk management is critical for survival in options trading.
Part 9: Trading Platforms and Tools
Options are traded through online brokers and trading platforms:
Real-time data, option chains, and Greeks calculators.
Advanced platforms allow strategy backtesting.
Mobile apps support tracking and execution on-the-go.
Part 10: Conclusion and Best Practices
Option trading is a versatile financial instrument offering leverage, hedging, and income generation opportunities. Key best practices:
Understand the product before trading.
Focus on risk management, not just profit.
Start with simple strategies before moving to complex spreads.
Use Greeks to monitor risk and optimize trades.
Keep learning, as markets and strategies evolve continuously.
Options are powerful tools, but they require knowledge, discipline, and patience to trade successfully.
