Futures and Options (F&O) in Indian Stock Market1. Introduction to F&O
Futures and Options are derivatives, which are financial contracts whose value is derived from an underlying asset such as stocks, indices, commodities, or currencies. Unlike spot market trading, where assets are exchanged immediately, derivatives provide the right or obligation to buy or sell an underlying asset at a predetermined price on a future date.
Futures Contract: A standardized agreement to buy or sell an asset at a future date at a price agreed upon today.
Options Contract: A contract that gives the holder the right, but not the obligation, to buy (Call Option) or sell (Put Option) the underlying asset at a predetermined price before or on the contract's expiry.
F&O trading is highly leveraged, allowing traders to control larger positions with smaller capital, but it also carries higher risk.
2. Components of F&O Contracts
Every F&O contract has specific components that traders must understand:
Underlying Asset: The stock, index, commodity, or currency on which the derivative is based.
Strike Price: The price at which the option can be exercised.
Expiry Date: The date on which the contract matures.
Lot Size: The minimum quantity of the underlying asset that can be traded in a contract.
Premium (for Options): The price paid to buy an option.
Settlement Mechanism: Physical delivery or cash settlement, depending on the contract type.
These components define the risk and payoff structure of F&O trades.
3. Types of F&O Instruments
In the Indian context, F&O instruments are broadly classified into:
Stock Futures and Options: Derivatives based on individual company stocks. For example, Infosys or Reliance stock futures.
Index Futures and Options: Derivatives based on market indices like Nifty 50, Bank Nifty, or Sensex.
Currency Derivatives: Based on currency pairs like USD/INR, EUR/INR.
Commodity Derivatives: Based on metals, energy products, and agricultural commodities.
Each type has its own market participants, risk profiles, and trading strategies.
4. Trading Mechanism in F&O
F&O trading happens on recognized exchanges like NSE (National Stock Exchange) and BSE (Bombay Stock Exchange) in India.
Margin-Based Trading: Traders are required to maintain a margin instead of paying the full contract value. This allows leverage but amplifies risk.
Mark-to-Market (MTM) Settlement: Daily profits and losses are adjusted in the trader’s account to reflect the market movement.
Hedging vs. Speculation: Traders can hedge existing positions in the cash market to reduce risk or speculate purely on price movements.
The trading mechanism ensures liquidity and efficient price discovery, making F&O an essential part of modern financial markets.
5. Advantages of F&O Trading
F&O trading offers several benefits:
Leverage: Control large positions with smaller capital investment.
Hedging: Protect against adverse price movements in the cash market.
Diversification: Trade in multiple asset classes like stocks, indices, commodities, and currencies.
Profit Opportunities in Both Directions: Traders can earn from rising or falling markets using futures and options strategies.
Price Discovery: F&O markets help determine the fair price of underlying assets.
Despite the advantages, F&O trading is risky and requires a clear understanding of strategies and market behavior.
6. Risks in F&O Trading
The high rewards of F&O come with significant risks:
Leverage Risk: Small market movements can result in large gains or losses.
Time Decay (for Options): Options lose value as expiry approaches if the market does not move favorably.
Volatility Risk: Sudden market swings can lead to margin calls or loss of capital.
Liquidity Risk: Some contracts may have fewer participants, making it hard to exit positions.
Effective risk management, such as stop-loss orders, position sizing, and hedging, is crucial for sustainable trading.
7. Popular F&O Strategies
Traders use various strategies depending on market conditions and risk appetite:
Hedging Strategies: Protect investments in the cash market using futures or options.
Speculative Strategies: Take leveraged positions to profit from short-term price movements.
Options Strategies:
Covered Call: Holding the underlying asset and selling call options to earn premium.
Protective Put: Buying a put option to protect against a potential drop in the asset price.
Straddles and Strangles: Profit from high volatility by buying both call and put options.
Understanding and applying strategies carefully is key to F&O success.
8. Regulatory Framework and Market Participants
F&O trading in India is regulated by the Securities and Exchange Board of India (SEBI). Key regulations include:
Position Limits: Restrictions on the maximum number of contracts one can hold.
Margin Requirements: Minimum collateral for trading F&O to mitigate systemic risk.
Settlement Procedures: Standardized processes for MTM, delivery, and expiry settlement.
Market participants include:
Retail Traders: Individual investors participating in hedging or speculation.
Institutional Investors: Mutual funds, insurance companies, and banks using F&O for portfolio management.
Proprietary Traders: Firms or individuals trading with their own capital for profit.
Arbitrageurs: Traders exploiting price discrepancies between spot and derivative markets.
Conclusion
F&O trading is a powerful tool for investors and traders seeking to leverage capital, hedge risks, and benefit from price movements in multiple asset classes. While the potential for high returns exists, it comes with significant risks that require discipline, market knowledge, and risk management skills. With the Indian F&O market growing rapidly, a strong understanding of concepts, strategies, and regulations is essential for anyone aiming to succeed in derivatives trading.
F&O is not just about speculation; it’s an integral part of modern financial markets that supports liquidity, price discovery, and risk management. For serious market participants, mastering F&O can be a game-changer in wealth creation and portfolio optimization.
Tradingideas
Brokers’ Impact on the Indian Trading Market1. Market Liquidity Enhancement
Brokers significantly enhance liquidity in the Indian trading market. By facilitating the buying and selling of securities, they ensure that there is a continuous flow of transactions, which allows investors to enter or exit positions with relative ease. High liquidity reduces the bid-ask spread and stabilizes prices, thereby creating a more efficient market. For example, large brokerage houses like Zerodha and ICICI Direct enable millions of retail investors to transact daily, adding substantial liquidity to both equity and derivatives markets.
2. Price Discovery and Market Efficiency
Brokers contribute directly to price discovery—the process through which the market determines the fair value of a security based on supply and demand. By executing trades promptly and efficiently, brokers help in reflecting accurate market sentiment. This becomes particularly crucial in volatile conditions, where brokers’ rapid response to client orders prevents large price gaps and contributes to overall market efficiency. Institutional brokers, due to their large order volumes, play a major role in signaling market trends.
3. Investor Accessibility and Participation
The democratization of the Indian trading market has largely been driven by brokers. Online brokerage platforms have reduced barriers to entry, enabling small retail investors to participate alongside institutional players. Features such as zero brokerage trading, mobile apps, and educational resources empower investors, broadening the market base. A larger investor base increases overall market participation, which in turn stabilizes market fluctuations and fosters long-term growth.
4. Advisory Services and Investment Guidance
Beyond executing trades, many brokers provide research, advisory services, and personalized investment guidance. They analyze market trends, corporate earnings, and macroeconomic developments, helping investors make informed decisions. These services influence trading patterns and investor behavior, shaping market trends indirectly. For instance, advisory reports recommending sectoral or stock-specific strategies can trigger substantial trading volumes in those assets.
5. Regulatory Compliance and Market Integrity
Brokers are the frontline enforcers of market regulations in India. Registered with SEBI (Securities and Exchange Board of India), they ensure compliance with trading norms, disclosure requirements, and anti-fraud measures. By adhering to regulatory frameworks, brokers maintain market integrity and protect investors from malpractices. Their role in preventing insider trading, front-running, and other unethical practices is crucial to maintaining confidence in the Indian financial system.
6. Technological Innovation and Market Modernization
Brokers have driven technological innovation in the Indian trading market. The introduction of electronic trading platforms, algorithmic trading services, and real-time market data feeds has revolutionized market operations. Brokers facilitate high-speed order execution, automated trading strategies, and advanced charting tools, allowing both retail and institutional investors to make rapid, informed decisions. These technological advancements enhance transparency and reduce operational inefficiencies in the market.
7. Market Stabilization During Volatility
During periods of high market volatility, brokers play a stabilizing role by managing order flows and advising clients prudently. Their risk management tools, such as stop-loss orders and portfolio diversification recommendations, help prevent panic selling and irrational market movements. By maintaining a balance between buyer and seller interest, brokers reduce extreme price swings and contribute to a resilient market structure.
8. Impact on Market Sentiment and Investor Psychology
Brokers influence not just trading volume, but also investor sentiment. Market rumors, analyst recommendations, and brokerage reports can shape investor perception, sometimes even more than fundamental data. Positive sentiment promoted by brokers can lead to bullish market trends, while negative sentiment may accelerate corrections. Understanding the psychological impact brokers have on trading decisions is key to evaluating their overall influence on market dynamics.
Conclusion
Brokers serve as the backbone of the Indian trading ecosystem. Their impact spans liquidity provision, price discovery, regulatory compliance, technological advancement, and investor education. Both traditional and modern brokerage models continue to shape market behavior, investor participation, and overall efficiency. As the Indian trading market grows in sophistication and scale, brokers’ role remains central in sustaining market stability, enhancing transparency, and promoting a culture of informed investing.

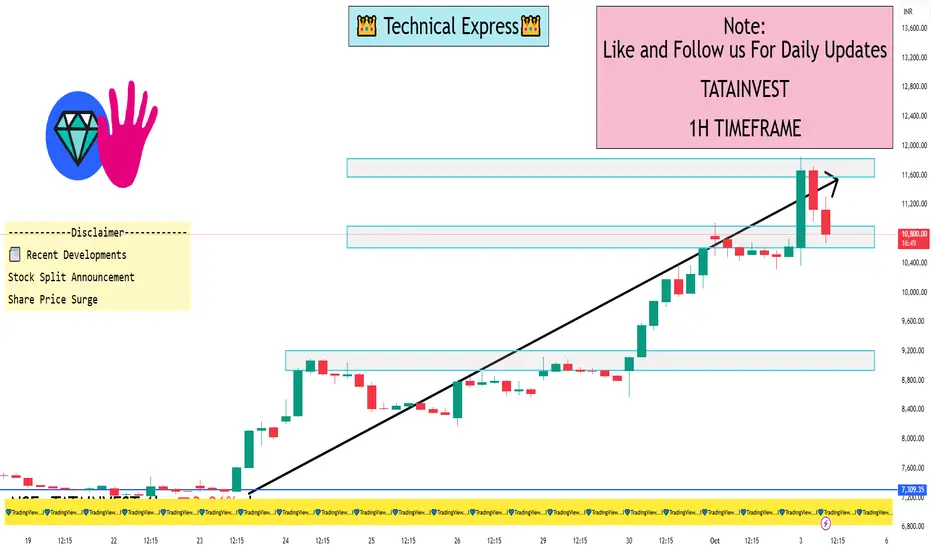
TATAINVEST 1 Hour View📈 Current Price Snapshot
Current Price: ₹11,122.00 (up ₹542.00, +5.12%)
Day’s Range: ₹10,366.00 – ₹11,847.00
52-Week High/Low: ₹10,950.00 – ₹5,145.15
Volume: 2,308,009 shares traded
Market Cap: ₹53,538 crore
🔍 1-Hour Time Frame Analysis
Recent intraday charts indicate a bullish breakout on the 1-hour time frame. The stock has surpassed key resistance levels, suggesting strong upward momentum. Technical indicators such as the Relative Strength Index (RSI) and Moving Averages are showing positive signals, reinforcing the bullish outlook.
📰 Recent Developments
Stock Split Announcement: On September 22, 2025, Tata Investment Corporation announced its first-ever stock split in a 1:10 ratio, aiming to improve liquidity and make shares more accessible to a broader base of investors. This decision was made by the company’s board and coincided with the release of its financial results for the first quarter ending June 2025.
Share Price Surge: Following the stock split announcement, the company's share price rose by 11.7% during intraday trading on September 23, 2025, reaching a new 52-week high of ₹8,131.50 on the Bombay Stock Exchange (BSE).
📊 Technical Indicators (1-Hour Time Frame)
RSI: Currently above 70, indicating strong bullish momentum.
Moving Averages: Short-term averages are above long-term averages, confirming the uptrend.
Volume: Increased trading volume suggests strong investor interest and potential continuation of the upward movement.
✅ Conclusion
Tata Investment Corporation Ltd. is exhibiting strong bullish momentum on the 1-hour time frame, supported by positive technical indicators and recent developments. Investors should monitor key support and resistance levels for potential entry or exit points.
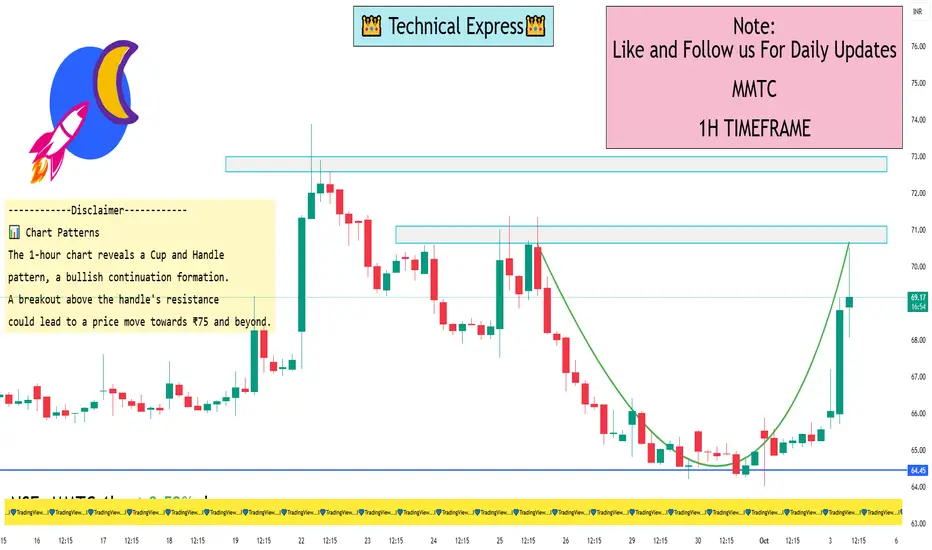
MMTC 1 Hour View📈 1-Hour Timeframe Technical Overview
Trend: The stock is exhibiting a bullish trend on the 1-hour chart, characterized by higher highs and higher lows.
Resistance Levels:
Immediate Resistance: ₹70.
Key Resistance: ₹75.
Support Levels:
Immediate Support: ₹65.
Key Support: ₹62.
Pivot Points:
Central Pivot: ₹64.84
Resistance (R1): ₹66.13
Support (S1): ₹63.55
🔧 Technical Indicators
RSI (Relative Strength Index): Currently neutral, indicating no overbought or oversold conditions.
Moving Averages:
50-period EMA: Trending upwards, supporting the bullish momentum.
200-period EMA: Also trending upwards, confirming the long-term bullish trend.
MACD (Moving Average Convergence Divergence): The MACD line is above the signal line, suggesting bullish momentum.
Volume: Increasing volume on upward movements indicates strong buying interest.
📊 Chart Patterns
The 1-hour chart reveals a Cup and Handle pattern, a bullish continuation formation. A breakout above the handle's resistance could lead to a price move towards ₹75 and beyond.
✅ Summary
MMTC Ltd is showing bullish signals on the 1-hour chart, with key resistance at ₹70 and ₹75, and support at ₹65 and ₹62. Technical indicators confirm the upward momentum. A breakout above ₹70 could signal further bullish movement.
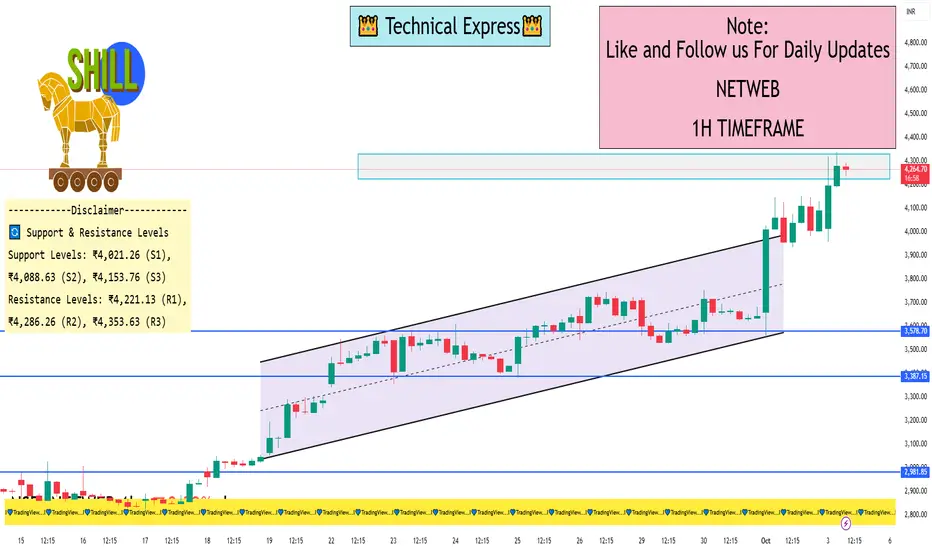
NETWEB 1 Hour ViewNETWEB is trading at ₹4,216.00, reflecting a 3.79% increase from the previous close.
📈 1-Hour Technical Analysis (as of 10:43 AM IST)
Based on intraday data, here are the key technical indicators for NETWEB on the 1-hour timeframe:
Relative Strength Index (RSI): 81.37 — indicates the stock is in the overbought zone, suggesting potential for a short-term pullback.
Moving Average Convergence Divergence (MACD): 395.90 — confirms a strong bullish momentum.
Average Directional Index (ADX): 60.55 — suggests a strong trend in the market.
Stochastic Oscillator: 89.93 — indicates the stock is in the overbought zone.
Super Trend: ₹3,386.37 — supports the current upward movement .
Williams %R: -4.50 — suggests the stock is in the overbought zone.
🔄 Support & Resistance Levels
According to pivot point analysis, the key support and resistance levels for NETWEB are:
Support Levels: ₹4,021.26 (S1), ₹4,088.63 (S2), ₹4,153.76 (S3).
Resistance Levels: ₹4,221.13 (R1), ₹4,286.26 (R2), ₹4,353.63 (R3).
The current price of ₹4,216.00 is near the R1 resistance level, indicating potential for a breakout if the price surpasses this level.
📊 Trend Analysis
The stock is exhibiting strong bullish indicators across multiple timeframes, including the 1-hour chart. The RSI, MACD, and ADX all suggest a continuation of the upward trend. However, the overbought conditions indicated by the RSI, Stochastic Oscillator, and Williams %R suggest that traders should be cautious of potential short-term pullbacks.
ICICIBANK 1 Hour View📊 1-Hour Timeframe: Key Levels
🔹 Support Levels
Immediate Support: ₹1,363.14
Key Support Zones: ₹1,352.93, ₹1,333.87
🔹 Resistance Levels
Immediate Resistance: ₹1,367.07
Key Resistance Zones: ₹1,385.23, ₹1,398.47
These levels are derived from standard pivot point calculations and are commonly used by traders to identify potential reversal points within the trading day.
📈 Technical Indicators (1-Hour Chart)
Relative Strength Index (RSI): 37.26 — indicates the stock is nearing oversold conditions, suggesting potential for a price rebound.
Moving Average Convergence Divergence (MACD): -16.11 — a negative value, which may indicate bearish momentum.
Average Directional Index (ADX): 23.81 — suggests a weak trend, implying indecision in the market.
Stochastic Oscillator: 13.21 — indicates the stock is oversold, potentially signaling a reversal.
Supertrend Indicator: ₹1,398.34 — indicates a bearish trend.
These indicators collectively suggest a bearish short-term outlook, with potential for a reversal if support levels hold.
📊 Price Levels to Watch
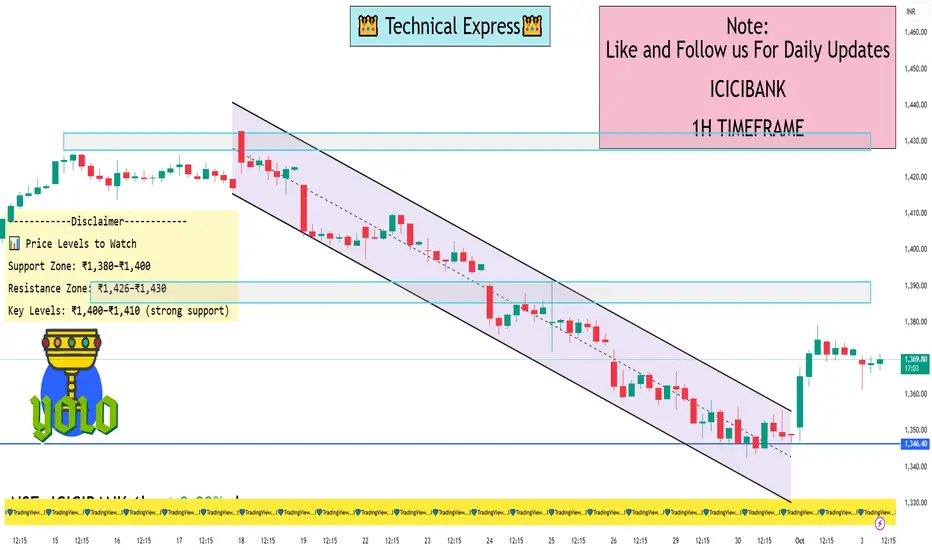
Support Zone: ₹1,380–₹1,400
Resistance Zone: ₹1,426–₹1,430
Key Levels: ₹1,400–₹1,410 (strong support)
🔄 Summary
ICICI Bank Ltd. is currently trading near its support levels on the 1-hour chart. The RSI indicates potential oversold conditions, while other indicators suggest a weak bearish trend. Traders should monitor the key support and resistance levels mentioned above for potential breakout or breakdown scenarios.
E-Commerce Trading1. Introduction
E-commerce trading, also known as electronic commerce trading, represents the buying and selling of goods and services over digital platforms. Unlike traditional trading, which relies on physical stores, direct interaction, and manual processes, e-commerce operates over the internet, enabling global access, efficiency, and automation. With the exponential growth of internet penetration, smartphone usage, and digital payment systems, e-commerce trading has become one of the fastest-growing segments of the global economy.
E-commerce trading encompasses a broad spectrum of activities, including retail trading, wholesale trading, business-to-business (B2B) transactions, business-to-consumer (B2C) sales, consumer-to-consumer (C2C) platforms, and increasingly, business-to-government (B2G) operations. This digital marketplace has transformed traditional commerce by integrating technology, logistics, marketing, and finance, enabling businesses and consumers to interact seamlessly.
2. History and Evolution
Early Beginnings
The concept of e-commerce trading dates back to the late 20th century. Early examples include Electronic Data Interchange (EDI) systems used by corporations to exchange business documents electronically. The first online retail sale is often credited to the 1994 sale of a Sting CD via the website NetMarket. Soon after, Amazon and eBay emerged as pioneers, creating the blueprint for online marketplaces.
Technological Milestones
Several technological developments accelerated the growth of e-commerce trading:
Internet Expansion: The widespread availability of broadband internet allowed users to access online stores easily.
Secure Payment Gateways: Innovations like SSL encryption, PayPal, and later UPI, digital wallets, and credit/debit card integrations made online transactions secure and convenient.
Mobile Commerce: With smartphones becoming ubiquitous, mobile apps and responsive websites enabled trading anytime, anywhere.
AI and Data Analytics: Personalized recommendations, demand forecasting, and dynamic pricing became possible, improving trading efficiency.
Cloud Computing: Allowed scalable online storefronts and storage solutions for businesses without heavy infrastructure investments.
3. Types of E-Commerce Trading
E-commerce trading is not a monolithic concept; it can be categorized based on the nature of participants:
3.1 Business-to-Consumer (B2C)
B2C trading involves businesses selling directly to consumers. Amazon, Flipkart, Myntra, and Walmart are classic examples. This segment focuses on:
Product variety and convenience.
Personalized marketing using AI and customer analytics.
Rapid delivery services.
Seamless payment methods, including COD, wallets, and UPI.
3.2 Business-to-Business (B2B)
B2B platforms facilitate transactions between companies. Examples include Alibaba, IndiaMART, and ThomasNet. Key characteristics:
Bulk transactions at negotiated prices.
Long-term partnerships and contracts.
Integration of supply chain management with trading platforms.
3.3 Consumer-to-Consumer (C2C)
C2C platforms allow individuals to trade with each other. eBay, OLX, and Quikr are examples. Features include:
Peer-to-peer sales of used goods or handmade items.
Trust-building through rating systems.
Secure payment mechanisms to ensure safe trades.
3.4 Business-to-Government (B2G)
B2G trading involves businesses providing products or services to government agencies. Digital tendering platforms, government e-procurement systems, and contracts for public projects are part of this domain.
4. Key Components of E-Commerce Trading
E-commerce trading relies on multiple integrated components that ensure smooth operation:
4.1 Online Marketplace Platforms
Platforms such as Amazon, Flipkart, Shopify, and Etsy provide the digital infrastructure for trading. These platforms host multiple sellers, offer product search and categorization, manage orders, and facilitate payments.
4.2 Payment Gateways and Financial Services
Secure payment systems are the backbone of e-commerce. Payment gateways process online transactions, while financial technologies (FinTech) like UPI, PayPal, Stripe, and digital wallets ensure instant transfers and refunds.
4.3 Logistics and Supply Chain Management
Efficient trading requires prompt delivery. Logistics includes warehousing, transportation, inventory management, and last-mile delivery. Companies like DHL, FedEx, and Indian startups like Delhivery revolutionized supply chain efficiency.
4.4 Digital Marketing
E-commerce trading thrives on digital marketing strategies, including:
Search Engine Optimization (SEO)
Social media advertising
Influencer marketing
Email campaigns and retargeting
Personalized recommendation engines
4.5 Technology Infrastructure
Modern e-commerce trading depends on advanced technologies:
Cloud computing for scalable server architecture.
AI and machine learning for predictive analytics and chatbots.
Big data for consumer insights.
AR/VR for immersive shopping experiences.
Blockchain for secure transactions and supply chain transparency.
5. Advantages of E-Commerce Trading
E-commerce trading offers numerous benefits for both businesses and consumers:
5.1 Global Reach
Unlike traditional stores limited by location, e-commerce platforms enable businesses to reach customers worldwide, expanding market potential significantly.
5.2 Cost Efficiency
Lower overhead costs due to the absence of physical storefronts, reduced staff requirements, and automation in operations contribute to cost efficiency.
5.3 Convenience
Consumers can shop 24/7, compare prices, read reviews, and receive products at their doorstep, enhancing customer satisfaction.
5.4 Personalized Experiences
Using AI-driven recommendations and behavioral analytics, e-commerce platforms provide tailored product suggestions, increasing sales and customer loyalty.
5.5 Analytics-Driven Decisions
Real-time tracking of sales, customer preferences, and market trends allows businesses to make informed decisions about inventory, pricing, and marketing.
6. Challenges in E-Commerce Trading
Despite its growth, e-commerce trading faces significant challenges:
6.1 Cybersecurity Risks
Hacking, data breaches, and fraudulent transactions threaten businesses and consumer trust.
6.2 Logistics and Supply Chain Bottlenecks
Delivery delays, damaged products, and inventory mismanagement can reduce customer satisfaction.
6.3 Intense Competition
Low barriers to entry in e-commerce result in fierce competition, driving prices down and impacting profit margins.
6.4 Regulatory and Legal Issues
Compliance with tax laws, consumer protection regulations, cross-border trade laws, and data privacy rules is complex.
6.5 Technological Dependence
Overreliance on digital infrastructure exposes businesses to risks of downtime, server failures, or software glitches.
Conclusion
E-commerce trading has transformed the way businesses and consumers interact, creating an ecosystem that is fast, efficient, and global. It bridges the gap between markets and customers, empowers small businesses, and drives technological innovation. While challenges like cybersecurity, logistics, and competition remain, emerging trends in mobile commerce, AI, AR, and sustainability promise a bright and transformative future.
Businesses that adapt quickly, embrace technology, and prioritize customer-centric strategies are likely to thrive, while traditional models will need to evolve or collaborate with digital platforms to remain relevant. In essence, e-commerce trading is not just a trend—it is the new norm in global commerce, reshaping the very fabric of trade in the 21st century.

Indian Stock Market Trends1. Introduction: Understanding the Indian Stock Market
The Indian stock market is one of the fastest-growing and most dynamic financial markets globally. Comprising the Bombay Stock Exchange (BSE) and the National Stock Exchange (NSE) as its two primary platforms, it serves as the barometer of India’s economic health. Over the last three decades, India has witnessed transformative changes in its stock market driven by economic liberalization, technological advancements, regulatory reforms, and global market integration.
The market plays a critical role in mobilizing domestic savings, enabling companies to raise capital, and providing investors with opportunities to grow wealth. Its growth is intrinsically linked to economic cycles, policy decisions, corporate earnings, and investor sentiment. Over time, the Indian stock market has evolved from a predominantly retail and family-controlled ownership pattern to a sophisticated ecosystem influenced by domestic institutional investors (DIIs), foreign institutional investors (FIIs), and algorithmic trading.
2. Historical Context: How the Market Evolved
The Indian stock market’s evolution can be divided into four phases:
2.1 Pre-Liberalization Era (Before 1991)
Before India’s economic liberalization, the stock market was relatively small and dominated by a few family-owned business groups. Market participation was limited, transparency was low, and regulatory frameworks were underdeveloped. Price manipulation and insider trading were common, and trading volumes were minimal.
2.2 Post-Liberalization Boom (1991–2000)
With the 1991 economic reforms, India opened up to foreign investments, reduced government controls, and encouraged private enterprise. The introduction of the NSE in 1992 brought transparency, electronic trading, and nationwide access. The market became more structured, attracting foreign capital and retail investors. The late 1990s saw the IT boom, which contributed to significant stock market growth, with indices such as the BSE Sensex gaining widespread attention.
2.3 Consolidation and Global Integration (2000–2010)
During this period, the Indian market became more integrated with global financial markets. The rise of derivative products, mutual funds, and increased institutional participation transformed the market into a more sophisticated environment. The 2008 global financial crisis impacted Indian equities, but the market’s resilience was evident in its recovery, highlighting growing domestic investor confidence.
2.4 Technological Transformation and Retail Participation (2010–Present)
The proliferation of digital trading platforms, discount brokers, and mobile apps has democratized market access, enabling retail investors to play a significant role. The introduction of exchange-traded funds (ETFs), algorithmic trading, and structured products has further diversified trading strategies. India’s equity market now reflects a mix of retail exuberance, institutional strategy, and global capital flows.
3. Current Trends in the Indian Stock Market
3.1 Index Performance and Volatility
The two primary indices, Sensex and Nifty 50, provide an overview of market performance:
Sensex, consisting of 30 of the largest and most actively traded stocks on the BSE, represents the performance of established blue-chip companies.
Nifty 50 tracks 50 major companies across 13 sectors on the NSE, offering a broader market perspective.
Trends Observed:
Bullish Momentum: Over the last decade, Indian markets have seen sustained growth due to economic reforms, infrastructure expansion, and corporate earnings growth.
Volatility Episodes: Global events like the COVID-19 pandemic, US Federal Reserve rate hikes, and geopolitical tensions caused sharp but often temporary volatility.
Sectoral Rotation: There is frequent rotation between sectors like IT, FMCG, banking, and energy, reflecting both domestic growth patterns and global demand cycles.
3.2 Sectoral Performance
Sectoral trends often drive broader market movements. Key sectors include:
Information Technology (IT):
IT companies like TCS, Infosys, and Wipro benefit from global digital transformation.
Revenue is influenced by foreign exchange fluctuations, client budgets, and global tech adoption.
Banking and Financial Services:
The BFSI sector contributes heavily to Sensex and Nifty 50 indices.
Trends are driven by credit growth, NPAs, policy reforms, and RBI rate decisions.
Energy and Commodities:
Reliance, ONGC, and Coal India drive energy sector performance.
Crude oil price movements and global commodity cycles directly impact profitability and stock prices.
Consumer Goods and FMCG:
Companies like Hindustan Unilever and Nestle thrive on domestic consumption patterns.
Market performance often reflects rural demand, inflation, and discretionary spending trends.
Pharmaceuticals and Healthcare:
Companies such as Sun Pharma and Dr. Reddy’s benefit from global demand, patent expirations, and regulatory approvals.
Healthcare reforms and medical tourism trends also impact sector valuations.
Emerging Sectors:
Electric vehicles (EVs), renewable energy, and fintech are gaining prominence in stock market valuations.
Investors are increasingly participating in IPOs of tech-driven start-ups, especially under the SME and unicorn segment.
3.3 IPO and FII Trends
Initial Public Offerings (IPOs):
The Indian IPO market has been vibrant, particularly in technology, fintech, and consumer sectors.
Retail participation is growing, fueled by online subscription platforms and easier access.
Foreign Institutional Investors (FIIs):
FIIs influence market liquidity, especially in large-cap stocks.
Capital inflows from FIIs are often cyclical and react to global interest rates, US market trends, and geopolitical developments.
Domestic Institutional Investors (DIIs):
Mutual funds, insurance companies, and pension funds are increasingly dominant players.
DIIs often act as stabilizers during FII outflows.
3.4 Retail Participation and Behavioral Trends
Retail investors have become a key driver of market liquidity:
Digital Trading Platforms: Zerodha, Groww, Upstox, and others have made investing easy and low-cost.
Trend-Following Behavior: Retail investors often follow market sentiment, resulting in high volatility during short-term rallies.
SIP Investments: Systematic Investment Plans in mutual funds have attracted long-term domestic capital to equity markets.
Behavioral finance studies indicate that retail participation can both amplify bullish trends during optimism and exacerbate corrections during fear-driven sell-offs.
3.5 Regulatory and Policy Impacts
The Indian stock market’s trends are strongly influenced by regulatory interventions:
SEBI (Securities and Exchange Board of India):
Enforces transparency, prevents insider trading, and regulates corporate governance.
Initiatives like T+1 settlement, margin requirements, and circuit breakers have enhanced market stability.
RBI Policies:
Interest rate decisions impact bank stocks, debt yields, and overall market sentiment.
Government Initiatives:
Policies like Make in India, Digital India, and infrastructure development have sectoral and index-level impacts.
Taxation reforms, including GST implementation and dividend taxation changes, influence market psychology.
4. Market Drivers and Influencers
Several internal and external factors shape Indian stock market trends:
4.1 Macroeconomic Indicators
GDP growth, inflation rates, industrial production, and employment data directly affect investor sentiment.
India’s strong demographic dividend and rising middle class support long-term equity consumption trends.
4.2 Corporate Earnings
Earnings growth in sectors like IT, banking, FMCG, and energy drives stock valuations.
Companies with robust fundamentals attract long-term investment despite short-term volatility.
4.3 Global Market Integration
India’s market is increasingly influenced by US market trends, oil prices, currency fluctuations, and geopolitical risks.
Events such as US Fed rate hikes or China’s economic policies have immediate ripple effects on capital inflows.
4.4 Technological Advancement
Algorithmic and high-frequency trading now contributes significantly to daily volumes.
Fintech innovation is democratizing access to equities, ETFs, and derivatives, increasing retail participation.
5. Long-term Trends and Market Outlook
5.1 Structural Growth
India’s stock market is expected to benefit from long-term structural growth factors:
Urbanization and rising disposable incomes.
Expansion of the digital economy.
Rising financial literacy leading to higher market participation.
5.2 Sectoral Shift
Technology, EVs, renewable energy, healthcare, and consumer goods are expected to dominate market growth.
Traditional sectors like oil & gas, steel, and banking will continue to remain core drivers but may face cyclicality.
5.3 ESG Investing
Environmental, Social, and Governance (ESG) investing is gaining traction among institutional and retail investors.
Companies with strong ESG credentials are increasingly receiving premium valuations.
5.4 Volatility and Risk Management
The market remains susceptible to global shocks, policy changes, and liquidity fluctuations.
Investors are adopting diversified portfolios, derivative hedging, and algorithmic strategies to manage risk.
6. Challenges and Risks
While the Indian stock market presents immense opportunities, it faces challenges:
Market Volatility: Triggered by global economic shocks or domestic policy changes.
Corporate Governance Issues: Despite SEBI oversight, lapses can lead to temporary erosion of investor confidence.
Liquidity Concerns: Small-cap stocks often experience lower liquidity, creating price inefficiencies.
Behavioral Biases: Retail investors’ herd mentality can cause speculative bubbles.
7. Conclusion
The Indian stock market is a reflection of the country’s economic aspirations, structural transformation, and global integration. From a small, opaque market in the 1980s to a technologically advanced, globally linked marketplace today, the evolution has been remarkable. The current trends—dominated by technology-driven trading, sectoral rotations, rising retail participation, and regulatory enhancements—point towards a robust future trajectory.
Investors must remain vigilant of macroeconomic shifts, policy interventions, and global cues while capitalizing on India’s long-term growth story. Strategic investment, risk management, and sectoral diversification will be key to navigating the opportunities and challenges in India’s evolving equity landscape.

Cross-Market Arbitrage Opportunities1. Understanding Cross-Market Arbitrage
Arbitrage is the simultaneous buying and selling of an asset to profit from price differences in different markets or forms. Cross-market arbitrage occurs when an asset, security, or derivative is traded across two or more markets (such as stock exchanges, commodity markets, or currency markets), and a trader exploits the temporary price mismatch.
1.1 Basic Concept
Imagine a stock listed on two exchanges—say, Exchange A and Exchange B. If the stock trades at $100 on Exchange A but $102 on Exchange B, a trader could theoretically buy at $100 on Exchange A and sell at $102 on Exchange B, locking in a risk-free profit of $2 per share (ignoring transaction costs). This opportunity exists because markets are not perfectly efficient at all times. Cross-market arbitrage seeks to exploit such temporary inefficiencies.
1.2 Importance in Financial Markets
Cross-market arbitrage contributes to:
Market efficiency: By exploiting price differences, arbitrageurs help align prices across markets.
Liquidity enhancement: Arbitrage strategies increase trading activity and liquidity.
Risk management: Investors use cross-market arbitrage in hedging strategies to manage exposure to price fluctuations.
2. Types of Cross-Market Arbitrage
Cross-market arbitrage can be categorized based on the types of assets, markets, and instruments involved. Below are the most common types:
2.1 Stock Arbitrage Across Exchanges
Stocks listed on multiple exchanges often exhibit price discrepancies due to differences in trading hours, liquidity, and investor behavior.
Example: An Indian company’s stock listed both on the NSE (National Stock Exchange) and BSE (Bombay Stock Exchange). If NSE trades at ₹1,000 and BSE at ₹1,005, arbitrageurs can buy on NSE and sell on BSE simultaneously.
2.2 Currency Arbitrage
Foreign exchange markets provide cross-market opportunities when the same currency pair trades at slightly different rates in different markets.
Triangular arbitrage is a common method, where traders exploit discrepancies among three currencies in different forex markets.
Example: USD/INR trades at 83.50 in New York and 83.60 in London. Buying USD in New York and selling in London can yield a profit.
2.3 Commodity Arbitrage
Commodities like gold, oil, and agricultural products are often traded in multiple markets. Price differences can arise due to storage costs, transportation costs, and market demand.
Example: Gold trades at $1,900 per ounce on the London Bullion Market and $1,905 in Mumbai. Traders can buy in London and sell in Mumbai after accounting for transaction costs.
2.4 Derivative and Futures Arbitrage
Arbitrage opportunities exist between the spot market and the futures market or across derivative exchanges.
Cash-and-carry arbitrage is a common example where traders buy an underlying asset in the spot market and sell futures contracts if the futures price is overpriced relative to the spot price.
Reverse cash-and-carry occurs when futures are underpriced.
3. Mechanics of Cross-Market Arbitrage
To execute a cross-market arbitrage strategy, traders follow these steps:
3.1 Identify Price Discrepancies
The first step is to monitor multiple markets and identify assets trading at different prices. Sophisticated traders use algorithmic systems, real-time data feeds, and market scanners to detect these differences within milliseconds.
3.3 Simultaneous Execution
Cross-market arbitrage requires executing buy and sell orders almost simultaneously to avoid market risk (the risk of prices changing before both trades are completed). This is often achieved through:
High-frequency trading (HFT) algorithms
Direct market access (DMA) platforms
Automated trading bots
3.4 Risk Management
Even “risk-free” arbitrage carries risks such as:
Execution risk
Liquidity risk
Regulatory restrictions
Currency or settlement risk in international markets
Professional arbitrageurs hedge these risks using derivatives or diversification strategies.
4. Popular Cross-Market Arbitrage Strategies
4.1 Dual-Listed Stock Arbitrage
Concept: Exploit price differences in a stock listed on two exchanges.
Example: Infosys Ltd., dual-listed in India and the US as ADRs (American Depository Receipts). Traders can arbitrage price differences between NSE/BSE and NYSE markets.
4.2 Index Arbitrage
Concept: Exploit differences between a stock index and its futures contract.
Mechanism: If the futures price is higher than the fair value implied by the index, traders buy the index components and sell futures simultaneously.
4.3 Cross-Currency Arbitrage
Triangular arbitrage involves three currencies. For instance, if USD/INR, USD/EUR, and EUR/INR exchange rates are misaligned, traders can make a profit by converting currencies sequentially.
4.4 Commodity Arbitrage
Traders exploit price discrepancies in commodities across global exchanges, often factoring in shipping, storage, and hedging costs.
Example: Oil traded in NYMEX versus Brent crude in ICE Europe.
4.5 Derivative Arbitrage
Exploiting differences between options, futures, and underlying assets.
Example: Convertible bond arbitrage, where traders hedge the bond portion and speculate on the stock portion to lock profits.
5. Advantages of Cross-Market Arbitrage
Risk-Adjusted Returns: Offers relatively low-risk profits when executed correctly.
Market Efficiency: Aligns prices across markets, reducing mispricing.
Liquidity Generation: Arbitrage trading increases market depth.
Diversification: Arbitrage can diversify an investor’s portfolio by introducing trades that are market-neutral.
Predictability: Unlike directional trades, arbitrage profits rely on price discrepancies rather than market trends.
6. Challenges and Risks
Despite being considered “low-risk,” cross-market arbitrage has challenges:
6.1 Execution Risk
Delays in order execution can erase profits. Markets move quickly, so any lag can turn an arbitrage opportunity into a loss.
6.2 Transaction Costs
Trading fees, broker commissions, and taxes can reduce or nullify arbitrage gains.
6.3 Liquidity Risk
Insufficient market liquidity can prevent traders from executing trades at desired prices.
6.4 Regulatory Risk
Different countries have distinct trading rules and capital controls, especially for cross-border arbitrage.
6.5 Currency Risk
For international arbitrage, fluctuations in exchange rates can impact profits.
6.6 Competition
High-frequency trading firms and institutional players dominate cross-market arbitrage, making it less accessible for retail traders.
7. Future Trends
AI-Powered Arbitrage: AI models will identify patterns and predict mispricings with greater accuracy.
Blockchain and Cryptocurrencies: Cross-exchange crypto arbitrage is gaining traction due to high volatility and fragmented exchanges.
Global Market Integration: Increased connectivity may reduce arbitrage opportunities but also create short-lived micro-opportunities.
Retail Access: As technology becomes more accessible, retail investors may participate in smaller-scale arbitrage.
8. Conclusion
Cross-market arbitrage is a sophisticated, yet fundamentally simple, trading strategy that capitalizes on temporary price discrepancies across markets. It requires speed, precision, and careful risk management. While large institutional players dominate this space, technology is gradually enabling wider participation.
Arbitrage benefits markets by enhancing efficiency, improving liquidity, and contributing to price discovery. However, it is not without risks. Transaction costs, execution delays, and regulatory hurdles are significant challenges. Understanding the mechanics, types, and tools of cross-market arbitrage is essential for traders seeking to profit in an increasingly competitive global market.
Ultimately, successful cross-market arbitrage combines market insight, technological proficiency, and disciplined execution, making it a cornerstone strategy for risk-conscious investors in the 21st century.

Domestic Equity Market TrendsIntroduction
The domestic equity market, often considered the barometer of a nation’s economic health, has witnessed dynamic shifts over the years. Characterized by fluctuations in stock prices, trading volumes, investor sentiment, and corporate performance, these markets reflect both macroeconomic trends and microeconomic realities. Understanding domestic equity market trends is essential not only for investors and traders but also for policymakers, financial analysts, and the broader business community.
Equity markets are influenced by a variety of factors including economic policies, global financial conditions, corporate earnings, technological advancements, and investor behavior. Domestic markets serve as platforms for capital formation, wealth creation, and efficient allocation of resources, contributing significantly to overall economic development.
This detailed analysis explores the evolution of domestic equity markets, identifies prevailing trends, examines sectoral movements, evaluates regulatory and policy impacts, and assesses investor behavior in shaping market trajectories.
1. Evolution of Domestic Equity Markets
1.1 Early Development
Domestic equity markets have evolved over decades, starting from informal trading practices to highly regulated, technologically advanced platforms. In the early stages, equity trading was largely manual, with transactions recorded on paper and executed in physical trading floors. Investor participation was limited to a select group of institutional and high-net-worth investors, and the market was relatively illiquid.
1.2 Modernization and Technological Integration
The introduction of electronic trading platforms revolutionized domestic equity markets. Real-time order matching, automated clearing, and electronic settlement have increased transparency, reduced transaction costs, and expanded participation. Technology has also enabled retail investors to access the market through online brokerage platforms and mobile trading applications, democratizing market participation.
1.3 Regulatory Reforms
Over the years, regulatory reforms have strengthened market integrity. Key initiatives include:
Implementation of investor protection mechanisms.
Stringent disclosure requirements for listed companies.
Risk management frameworks to safeguard against market manipulation.
Corporate governance reforms promoting transparency and accountability.
These measures have enhanced investor confidence and encouraged broader participation in the equity markets.
2. Key Drivers of Domestic Equity Market Trends
Domestic equity markets are influenced by a combination of macroeconomic, microeconomic, and geopolitical factors. Understanding these drivers is crucial for analyzing market behavior.
2.1 Economic Indicators
Economic performance, measured through GDP growth, inflation, employment rates, and industrial production, directly affects equity market trends. For instance, robust economic growth typically boosts corporate earnings, which in turn drives stock prices higher. Conversely, economic slowdowns or recessions often lead to market corrections.
2.2 Corporate Earnings
Corporate profitability is a primary determinant of stock prices. Companies reporting strong earnings growth attract investor interest, driving demand and prices up. Conversely, declining earnings or profit warnings can trigger sell-offs. Sectoral earnings also play a role, as some industries outperform others during different economic cycles.
2.3 Monetary Policy
Central banks influence equity markets through interest rate adjustments and liquidity management. Lower interest rates make equity investments more attractive relative to fixed-income securities, often boosting market performance. Conversely, rising rates can dampen equity valuations.
2.4 Fiscal Policy
Government spending, taxation, and policy measures impact corporate profitability and investor sentiment. Expansionary fiscal policies can stimulate growth and market optimism, while contractionary measures may lead to caution or sell-offs.
2.5 Global Market Conditions
Domestic markets are not isolated from global trends. Foreign institutional investments, geopolitical tensions, global commodity prices, and currency fluctuations influence domestic equity performance. Integration with global markets means domestic indices often mirror global sentiments to some extent.
3. Current Domestic Equity Market Trends
3.1 Market Valuation Trends
Over the past few years, domestic equity markets have experienced significant valuation shifts. Key observations include:
Bullish Phases: Periods of strong economic growth, low-interest rates, and corporate earnings growth have fueled bullish markets.
Correction Phases: Market corrections have occurred due to economic slowdowns, geopolitical uncertainties, or rising interest rates.
Sector Rotation: Investors often shift funds between sectors depending on prevailing macroeconomic conditions, leading to sector-specific performance trends.
3.2 Sectoral Trends
Equity markets often exhibit sectoral trends, influenced by industry-specific developments and investor preferences. Current sectoral trends include:
Technology & IT Services: Continues to benefit from digital transformation and global outsourcing demands.
Banking & Financial Services: Driven by credit growth, asset quality improvements, and fintech adoption.
Pharmaceuticals & Healthcare: Gaining attention due to rising health awareness and government initiatives.
Consumer Goods & Retail: Sensitive to consumption patterns, inflation, and changing consumer preferences.
Energy & Infrastructure: Influenced by commodity prices, government spending, and renewable energy transitions.
3.3 Retail Participation
Retail investors have increasingly contributed to domestic equity market volumes. The rise of mobile trading apps, online brokerage platforms, and investment awareness campaigns has led to higher retail engagement, which can amplify market trends during bullish or bearish phases.
3.4 Institutional Investment Patterns
Domestic and foreign institutional investors play a significant role in shaping market trends. Their investment decisions, often based on research, macroeconomic analysis, and portfolio strategies, can create momentum in specific sectors or indices.
4. Technological and Trading Innovations
4.1 Algorithmic and High-Frequency Trading
The introduction of algorithmic and high-frequency trading has transformed equity market dynamics. These technologies execute trades at high speeds, exploiting short-term market inefficiencies. While they increase liquidity, they also contribute to heightened volatility during market stress.
4.2 Data Analytics and AI
Advanced data analytics and artificial intelligence are increasingly used by traders and analysts to predict market trends, assess risk, and optimize portfolios. Machine learning models analyze historical and real-time data to identify trading opportunities.
4.3 Mobile and Online Trading Platforms
The proliferation of mobile trading platforms has empowered retail investors to participate in real-time trading. Features such as instant order execution, portfolio tracking, and market alerts have enhanced retail engagement.
5. Market Volatility and Risk Factors
Domestic equity markets are inherently volatile, influenced by multiple risk factors:
Macroeconomic Shocks: Sudden changes in interest rates, inflation, or GDP growth can trigger market swings.
Corporate Performance Risks: Poor earnings, mismanagement, or governance issues impact stock prices.
Global Uncertainties: Geopolitical tensions, trade wars, or global financial crises can affect domestic markets.
Liquidity Risks: Market liquidity can fluctuate, especially in mid-cap and small-cap stocks, amplifying price movements.
Behavioral Factors: Investor sentiment, herd behavior, and market psychology play critical roles in short-term volatility.
6. Challenges in Domestic Equity Markets
Despite modernization and growth, domestic equity markets face several challenges:
Market Volatility: High volatility can discourage long-term investment.
Corporate Governance Issues: Instances of fraud or mismanagement can erode investor trust.
Market Inequality: Small and mid-cap companies may face liquidity constraints compared to large-cap firms.
Information Asymmetry: Retail investors often lack access to sophisticated research and analysis tools.
Regulatory Compliance: Frequent changes in rules may create compliance challenges for market participants.
7. Opportunities for Investors
Domestic equity markets offer diverse opportunities for investors:
Long-term Wealth Creation: Equity markets remain one of the most effective avenues for long-term capital appreciation.
Sectoral Diversification: Investors can exploit sectoral trends and thematic opportunities.
Derivative Instruments: Futures and options allow hedging, speculation, and risk management.
IPO Participation: Investing in new listings can provide early-stage growth opportunities.
Technology-driven Investments: Online platforms and AI-driven advisory services enhance decision-making.
8.Conclusion
Domestic equity markets are complex, dynamic, and multifaceted, reflecting a nation’s economic health and investor sentiment. Over the years, technological innovation, regulatory reforms, and increased retail participation have enhanced market efficiency and accessibility. Trends such as sectoral shifts, ESG investing, and global integration are shaping the future of domestic markets.
Investors, regulators, and corporate entities must navigate this landscape with strategic foresight, continuous learning, and risk awareness. By understanding macroeconomic drivers, corporate performance patterns, and behavioral influences, stakeholders can leverage opportunities and mitigate challenges in domestic equity markets.
The continued evolution of domestic equity markets presents both opportunities and responsibilities. A well-informed approach, combined with regulatory oversight and technological adoption, ensures that equity markets remain robust, transparent, and a critical engine for economic growth.

Option Trading SecretsPart 1: Understanding Options – The Foundation of Secrets
1.1 What Are Options?
Options are financial derivatives that give the holder the right, but not the obligation, to buy or sell an asset at a predetermined price (strike price) before a certain date (expiry). There are two main types:
Call Options: Right to buy.
Put Options: Right to sell.
Secret Insight: Many traders fail because they focus on “predicting direction” rather than understanding the time value and volatility embedded in options prices.
1.2 Components of an Option
Strike Price – The predetermined price of the underlying asset.
Expiry Date – The date the option contract expires.
Premium – The price paid to buy the option.
Intrinsic Value – The value if exercised today.
Time Value – Additional value due to the time left until expiry.
Secret Insight: Time decay (Theta) is often overlooked. Successful option traders exploit time decay instead of fighting against it.
1.3 Why Trade Options?
Leverage: Small capital controls large positions.
Flexibility: Can profit in bullish, bearish, or neutral markets.
Hedging: Protects your stock portfolio against losses.
Income Generation: Selling options (writing calls/puts) can create steady cash flow.
Secret Insight: Most beginners try to predict market direction, while pros focus on probability, risk management, and strategic positioning.
Part 2: Core Option Trading Secrets
2.1 Volatility – The Hidden Force
Volatility is the heartbeat of option pricing.
Implied Volatility (IV): Market’s forecast of future volatility.
Historical Volatility (HV): Past price movement.
Secret Insight: Options are more expensive when IV is high. Selling options in high IV periods and buying in low IV periods can increase success probability.
2.2 The Greeks – Your Secret Weapons
Understanding the Greeks is crucial:
Delta: Sensitivity to underlying price.
Gamma: Rate of change of Delta.
Theta: Time decay effect.
Vega: Sensitivity to volatility.
Rho: Sensitivity to interest rates.
Secret Insight: Most traders obsess over price prediction. Successful traders control risk by managing Greeks, not just by buying/selling calls or puts.
2.3 The Myth of Directional Trading
While buying calls in a bullish market or puts in a bearish market is intuitive, it’s often a losing strategy if done without:
Timing
Volatility awareness
Strike price selection
Secret Insight: Many profits come from neutral strategies that capitalize on time decay or volatility changes.
Part 3: Advanced Option Strategies – Secrets of the Pros
3.1 Spreads – Reducing Risk and Cost
Vertical Spread: Buy and sell options of the same type and expiry but different strikes.
Horizontal/Calendar Spread: Exploit time decay differences.
Diagonal Spread: Combines vertical and horizontal spreads for advanced hedging.
Secret Insight: Spreads reduce cost and risk while keeping profit potential. Many retail traders ignore them, chasing naked options for huge gains and ending up in losses.
3.2 Iron Condors & Butterflies – Secrets for Range-Bound Markets
Iron Condor: Sell OTM calls and puts, buy further OTM options to hedge risk.
Butterfly Spread: Profit from minimal movement around a target price.
Secret Insight: The real secret is managing position size and probability. Profitable options trading often comes from small, consistent wins rather than rare big wins.
3.3 Protective Strategies – Hedging Like a Pro
Protective Puts: Own stock but buy puts to limit downside.
Covered Calls: Own stock and sell calls to generate income.
Secret Insight: The best traders treat options primarily as insurance and income tools, not just speculation.
Part 4: Risk Management Secrets
4.1 Position Sizing
Never risk more than 1–2% of capital on a single trade.
Adjust size based on volatility and Greeks.
Secret Insight: Even the best strategies fail without disciplined capital management.
4.2 Avoiding Common Traps
Buying deep OTM options as “lottery tickets.”
Ignoring IV crush after earnings.
Over-leveraging and underestimating Theta decay.
Secret Insight: Most traders fail psychologically before failing technically. Emotional control is a secret weapon.
4.3 The Power of Probability
Options trading isn’t gambling—it’s about stacking probabilities in your favor.
Favor high probability setups with defined risk.
Accept small consistent profits over chasing massive gains.
Part 5: Market Timing Secrets
5.1 Earnings and Events
Options react violently to earnings, FOMC, or geopolitical events.
Secret Insight: Use spreads or iron condors around events rather than naked buying. This controls risk while keeping upside potential.
5.2 Using Technical Analysis
Support/resistance levels, trend lines, and moving averages can guide strike selection.
Combine technicals with implied volatility for high-probability trades.
Secret Insight: Pros don’t blindly buy calls and puts—they combine technical triggers with probability and volatility analysis.
5.3 Psychological Edge
Patience beats impulsiveness.
Accept losses quickly; let winners run within limits.
Secret Insight: Trading psychology, discipline, and emotional control are the ultimate secrets that most books don’t emphasize.
Part 6: Building a System – From Secrets to Strategy
6.1 Developing a Personal Edge
Track historical trades and analyze winning patterns.
Identify setups where probability favors you.
Stick to trades that fit your risk tolerance.
6.2 Journaling & Review
Record each trade: entry, exit, rationale, and outcome.
Evaluate mistakes objectively.
Secret Insight: The market doesn’t care about your emotions. Your edge grows from systematic review and refinement.
6.3 Continuous Learning
Study options pricing models, volatility surfaces, and macro events.
Attend webinars, read research reports, and adapt strategies.
Conclusion
Option trading secrets are not magic formulas; they are disciplined habits:
Understanding volatility and Greeks.
Using spreads and hedges to control risk.
Managing position sizes and emotions.
Timing trades around probability and technical setups.
Constant learning and adaptation.
By mastering these secrets, traders can transform options trading from risky speculation to a high-probability, strategic, and disciplined pursuit.
TATAMOTORS 1 Day View📈 Daily Support & Resistance Levels
Immediate Support: ₹705.85
Immediate Resistance: ₹732.50
Pivot Point: ₹705.85
These levels are derived from the Classic Pivot Point analysis, indicating that the stock is trading near its pivot point, suggesting a neutral bias with potential for breakout or pullback depending on market momentum.
🔁 Fibonacci Retracement Levels
Key Support Levels:
23.6%: ₹694.85
38.2%: ₹664.45
50%: ₹639.88
61.8%: ₹615.30
Key Resistance Levels:
23.6%: ₹767.50
38.2%: ₹797.90
50%: ₹822.47
61.8%: ₹847.05
These Fibonacci levels provide potential support and resistance zones, useful for identifying entry and exit points.
📉 Technical Indicators
Relative Strength Index (RSI): Approximately 42.6, indicating early bullish momentum.
Moving Averages: The stock is trading below its 5-day and 13-day moving averages, suggesting a bearish trend.
🧭 Trend Analysis
The stock is currently trading near its pivot point, indicating a neutral bias. A breakout above ₹732.50 could signal bullish momentum, while a drop below ₹705.85 may indicate further downside potential.
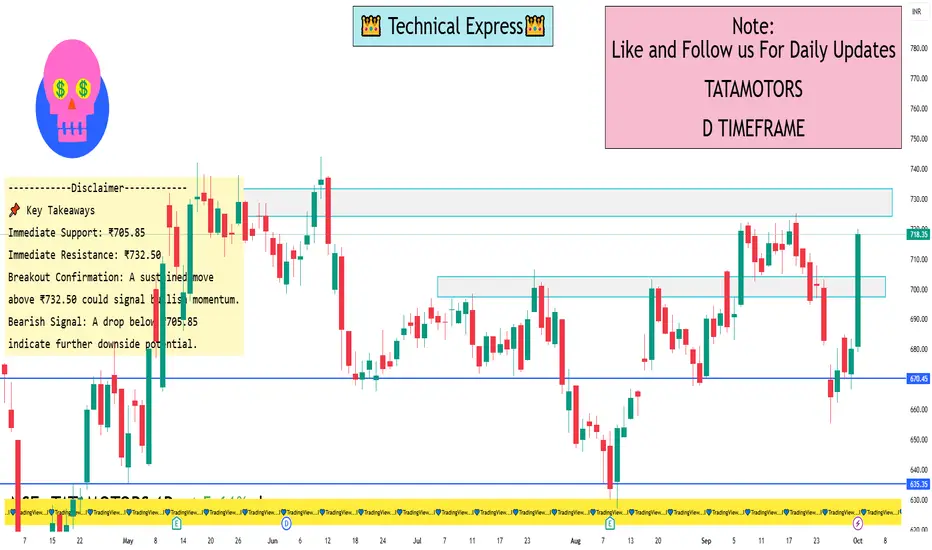
📌 Key Takeaways
Immediate Support: ₹705.85
Immediate Resistance: ₹732.50
Breakout Confirmation: A sustained move above ₹732.50 could signal bullish momentum.
Bearish Signal: A drop below ₹705.85 may indicate further downside potential.
Advanced Hedging Techniques in Modern Financial Markets1. Introduction to Hedging
Hedging, at its core, is about reducing risk without necessarily eliminating profit opportunities. Businesses, investors, and financial institutions face multiple types of risks:
Market risk: Price fluctuations in equities, commodities, or currencies.
Interest rate risk: Changes in rates affecting bonds or loans.
Credit risk: Counterparty default in financial contracts.
Operational and systemic risk: Broader business or financial system risks.
Advanced hedging strategies aim not only to mitigate these risks but also to optimize cost efficiency, capital utilization, and portfolio resilience.
2. Basic Hedging vs Advanced Hedging
Before diving into advanced techniques, it is important to differentiate:
Basic Hedging: Simple instruments such as forward contracts, futures, or plain vanilla options are used. For example:
Buying a currency forward contract to lock in exchange rates.
Selling stock futures to protect against equity price decline.
Advanced Hedging: Complex strategies that combine multiple instruments, dynamic adjustments, quantitative models, or derivative overlays. These methods are suitable for institutional investors, large corporates, and hedge funds. Advanced hedging can involve:
Dynamic hedging using options “Greeks” (delta, gamma, vega, theta).
Cross-asset hedging using correlated instruments.
Volatility-based hedging using derivatives.
Multi-layered portfolio insurance techniques.
3. Advanced Hedging Techniques
3.1 Delta Hedging
Delta hedging is an options-based strategy to neutralize the price risk of an underlying asset.
Delta (Δ) measures how much an option’s price moves for a one-unit change in the underlying asset.
By holding a position in the underlying asset opposite to the delta of the option, traders can achieve delta neutrality, reducing directional risk.
Example:
If an investor holds a call option with a delta of 0.6 on 100 shares of a stock, the option position is equivalent to owning 60 shares. To hedge, the investor might short 60 shares, neutralizing exposure.
Advantages:
Protects against small price movements.
Can be dynamically adjusted for changing delta (“dynamic delta hedging”).
Challenges:
Requires frequent rebalancing.
Transaction costs can accumulate.
Gamma risk remains (sensitivity of delta to price changes).
3.2 Gamma and Vega Hedging
After delta, advanced hedgers consider gamma and vega:
Gamma (Γ): Measures the rate of change of delta concerning the underlying price. Gamma hedging ensures that the delta remains stable as the asset price fluctuates.
Vega (ν): Measures sensitivity to volatility. Vega hedging protects against market volatility swings.
Application:
Options traders often construct multi-leg positions (spreads, straddles, strangles) to hedge gamma and vega risks.
This is particularly useful in volatile markets where price swings and implied volatility can affect option premiums.
3.3 Cross-Hedging
When a perfect hedge instrument is unavailable, cross-hedging is used:
It relies on the correlation between two assets.
Example: Hedging oil price exposure with energy sector ETFs or related futures.
Considerations:
Requires statistical analysis of correlation coefficients.
Basis risk exists because correlations may not remain stable.
3.4 Currency and Interest Rate Hedging
For multinational firms, FX risk and interest rate risk are significant.
Currency Hedging Techniques:
Forward contracts: Lock exchange rates for future transactions.
Currency options: Protect against adverse moves while retaining upside.
Currency swaps: Exchange cash flows in different currencies over time.
Interest Rate Hedging:
Swaps: Exchange fixed-rate payments for floating-rate to manage interest rate exposure.
Caps and floors: Protect against rising or falling rates without eliminating potential gains.
Duration matching: Aligning asset and liability durations to neutralize rate sensitivity.
3.5 Volatility and Volatility Trading as Hedge
Advanced traders treat volatility itself as a tradable hedge:
Volatility Index Futures/Options (e.g., VIX): Hedging equity portfolios against sudden market swings.
Variance swaps: Enable direct exposure to volatility; gains offset portfolio losses in volatile markets.
Correlation trading: Using instruments where the correlation structure changes to protect portfolios.
3.6 Portfolio Insurance
Portfolio insurance techniques aim to cap downside while maintaining upside:
Protective Put Strategy:
Buy put options on an equity portfolio.
Losses are limited to the strike price, preserving potential gains.
CPPI (Constant Proportion Portfolio Insurance):
Dynamically adjusts exposure between risky and risk-free assets.
Ensures portfolio never falls below a pre-defined floor.
Option Overlay Strategies:
Use a combination of calls, puts, and spreads on existing holdings.
Provides flexibility, cost optimization, and risk control.
3.7 Commodity Hedging Techniques
Commodities have unique risks such as seasonal volatility, geopolitical shocks, and storage costs:
Basis Hedging: Hedging the difference between spot and futures prices.
Spread Hedging: Using one commodity contract to hedge another (e.g., Brent vs WTI crude).
Weather Derivatives: Protect against crop loss or energy demand fluctuations due to weather.
3.8 Dynamic Hedging Using Quantitative Models
Modern hedgers increasingly rely on quantitative models:
Stochastic modeling: Simulate multiple price paths to determine optimal hedge ratios.
Monte Carlo simulations: Assess the probability distribution of portfolio outcomes under various hedge strategies.
Machine learning: Predict volatility, correlation shifts, and optimal hedge rebalancing points.
These methods allow adaptive hedging, where strategies evolve as markets change.
3.9 Exotic Derivatives in Hedging
Exotic derivatives provide tailored risk mitigation:
Barrier options: Activate or deactivate when underlying hits certain levels.
Lookback options: Allow locking the best/worst prices historically.
Asian options: Average underlying prices reduce volatility risk in hedging.
Exotics are expensive but allow precise hedging in complex scenarios.
3.10 Hedging with ETFs and Index Products
For large portfolios, ETFs, index futures, and inverse ETFs provide broad exposure hedging:
Protect against sectoral or market-wide declines.
Low transaction cost and high liquidity.
Can be combined with options to create synthetic hedges.
3.11 Risk Parity and Multi-Asset Hedging
Advanced portfolios often apply risk parity principles:
Allocate capital based on risk contribution, not nominal allocation.
Use derivatives to hedge dominant risks while maintaining exposure to growth assets.
Example: Combine equity, bond, commodity, and FX derivatives to balance overall portfolio volatility.
4. Strategic Considerations in Advanced Hedging
Cost Efficiency: Hedging is not free; premiums, spreads, and transaction costs matter.
Dynamic Adjustment: Hedge ratios must evolve with market conditions.
Correlation and Basis Risk: Imperfect hedges can introduce unintended exposures.
Regulatory Compliance: Certain hedges may have accounting, tax, or reporting implications.
Liquidity Management: Highly illiquid instruments can increase hedging risk.
5. Case Studies in Advanced Hedging
5.1 Equity Portfolio Hedging
A $500 million equity portfolio uses delta-neutral options, volatility derivatives, and index futures to mitigate downside while retaining growth.
5.2 Commodity Exporter Hedging
A global oil producer uses cross-hedging, swaps, and weather derivatives to stabilize revenue across multiple markets.
5.3 Multinational Corporate FX Hedging
A tech giant uses currency swaps, forward contracts, and exotic options to manage exposure across 10+ currencies while minimizing hedging costs.
6. Benefits and Limitations of Advanced Hedging
Benefits
Risk reduction tailored to portfolio needs.
Preserves upside potential while limiting downside.
Enhances confidence for institutional and corporate planning.
Enables strategic investment in volatile environments.
Limitations
High complexity requiring expertise.
Costs can erode portfolio returns if overused.
Model and counterparty risk in derivative contracts.
Dynamic adjustments can be operationally intensive.
7. Future Trends in Hedging
AI-Driven Hedging: Machine learning models optimizing hedge ratios in real-time.
Cross-Asset and ESG Hedging: Incorporating climate risk and sustainability-linked instruments.
Blockchain and Tokenized Derivatives: Increasing transparency and accessibility for hedging instruments.
Integration with Risk Analytics: Hedging becomes a holistic portfolio management tool rather than a reactive measure.
8. Conclusion
Advanced hedging techniques are no longer optional for sophisticated investors and corporations—they are central to risk management in a volatile, interconnected world. By leveraging derivatives, dynamic models, exotic instruments, and cross-asset strategies, market participants can control downside risk, stabilize returns, and navigate complex financial landscapes efficiently. While advanced hedging requires expertise, costs, and constant vigilance, it remains a cornerstone of modern portfolio and corporate risk management.
Bonds and Fixed-Income Trading Strategies1. Introduction to Bonds and Fixed Income
1.1 What Are Bonds?
A bond is a debt security, essentially a loan made by an investor to a borrower (typically a government, corporation, or financial institution). The borrower promises to pay periodic interest (coupon payments) and to return the principal (face value) at maturity. Bonds are considered fixed-income securities because they generally provide predictable returns over time.
Key components of a bond:
Face Value (Par Value): Amount repaid at maturity.
Coupon Rate: Annual interest percentage based on face value.
Maturity Date: When the principal is repaid.
Issuer: Entity borrowing the funds.
1.2 Importance of Bonds
Bonds serve several key functions:
Income Generation: Provide stable cash flows through coupons.
Portfolio Diversification: Lower correlation with equities reduces portfolio volatility.
Capital Preservation: Generally lower risk than stocks, especially government bonds.
Market Signaling: Bond yields reflect interest rate expectations and economic conditions.
2. Types of Bonds
Understanding the types of bonds is foundational for trading strategies:
2.1 Government Bonds
Issued by national governments; considered low risk.
Examples: U.S. Treasuries, Indian Government Securities (G-Secs).
Typically used for safe-haven investing.
2.2 Corporate Bonds
Issued by companies to raise capital.
Higher yields than government bonds due to default risk.
Categories:
Investment Grade: Lower default risk, moderate yields.
High Yield (Junk Bonds): Higher default risk, high yields.
2.3 Municipal Bonds
Issued by local governments or municipalities.
Often tax-exempt in certain jurisdictions.
Attractive for investors seeking tax-efficient income.
2.4 Convertible Bonds
Can be converted into equity shares of the issuing company.
Hybrid instrument combining bond-like stability and equity upside.
2.5 Zero-Coupon Bonds
Pay no periodic interest; sold at a discount.
Investor gains from capital appreciation at maturity.
2.6 Inflation-Linked Bonds
Principal and/or interest payments adjust with inflation.
Examples: U.S. TIPS, India’s Inflation Indexed Bonds.
Useful for hedging against inflation risk.
3. Bond Trading Strategies
Trading bonds requires understanding market cycles, interest rate movements, and credit risks. Strategies can be broadly categorized as:
3.1 Buy and Hold Strategy
Objective: Earn coupon income and principal at maturity.
Best For: Conservative investors and retirees.
Pros: Stability, predictable returns.
Cons: Limited capital gains; sensitive to inflation.
3.2 Active Trading Strategies
3.2.1 Interest Rate Anticipation
Goal: Profit from expected changes in interest rates.
Method: Buy long-duration bonds if rates are expected to fall; sell if rates are expected to rise.
Example: U.S. Treasury futures or Indian G-Secs.
3.2.2 Bond Laddering
Goal: Reduce reinvestment risk and smooth cash flows.
Method: Invest in bonds with staggered maturities.
Benefits: Steady income, flexibility to reinvest at different rates.
3.2.3 Barbell Strategy
Goal: Balance risk and return by investing in short- and long-term bonds.
Method: Avoid intermediate-term bonds.
Pros: High liquidity from short-term bonds, high yields from long-term bonds.
Use Case: Uncertain interest rate environment.
3.2.4 Bullet Strategy
Goal: Concentrate maturities around a specific date to fund known obligations.
Method: Buy bonds maturing around the same period.
Best For: Funding a major expense (e.g., pension payouts, debt obligations).
3.2.5 Credit Spread Trading
Goal: Exploit differences in yields between bonds of varying credit quality.
Method: Buy undervalued bonds or short overvalued bonds.
Caution: Requires strong credit analysis skills.
3.2.6 Yield Curve Strategies
Steepener: Buy long-term bonds, sell short-term bonds if yield curve is expected to steepen.
Flattener: Sell long-term bonds, buy short-term bonds if yield curve is expected to flatten.
Objective: Profit from changes in shape of yield curve, not absolute rates.
3.3 Arbitrage Strategies
Convertible Bond Arbitrage: Exploit mispricing between a convertible bond and its underlying equity.
Treasury Arbitrage: Use derivatives or bond futures to profit from small yield differences across maturities or markets.
4. Fixed-Income Derivatives in Bond Trading
Derivatives enhance bond trading flexibility:
4.1 Futures
Standardized contracts to buy/sell bonds at a future date.
Useful for hedging or speculating on interest rates.
4.2 Options
Call Options: Right to buy a bond at a strike price.
Put Options: Right to sell a bond.
Can hedge against price volatility or take directional bets.
4.3 Swaps
Interest Rate Swap: Exchange fixed for floating interest payments.
Credit Default Swap (CDS): Insurance against default risk.
Widely used by institutional traders to manage risk and leverage positions.
5. Risk Management in Fixed-Income Trading
Trading bonds is not risk-free. Key risks include:
5.1 Interest Rate Risk
Bond prices fall when interest rates rise.
Mitigation: Duration management, interest rate derivatives.
5.2 Credit Risk
Risk of issuer default.
Mitigation: Diversification, credit analysis, CDS.
5.3 Reinvestment Risk
Coupons may be reinvested at lower rates.
Mitigation: Laddering strategy.
5.4 Liquidity Risk
Some bonds, especially corporate and municipal, may be illiquid.
Mitigation: Focus on high-volume instruments or use ETFs.
6.5 Inflation Risk
Erodes real returns of fixed-income instruments.
Mitigation: Inflation-linked bonds, shorter maturities.
6. Technical and Fundamental Analysis for Bond Trading
6.1 Fundamental Analysis
Economic indicators: Inflation, GDP growth, employment, central bank policies.
Credit fundamentals: Debt-to-equity ratios, cash flows, corporate earnings.
Central bank actions and fiscal policy directly impact interest rates and yields.
6.2 Technical Analysis
Price patterns, volume trends, and yield charts.
Common tools: Moving averages, trendlines, RSI, support/resistance for bond ETFs and futures.
7. Global and Indian Bond Market Dynamics
7.1 Global Factors
U.S. Treasury yields set benchmark for global rates.
Geopolitical risk, monetary policies, and inflation expectations drive bond flows.
7.2 Indian Bond Market
Key instruments: Government securities (G-Secs), State Development Loans (SDLs), corporate bonds.
RBI’s monetary policy, inflation trends, and credit growth impact yields.
Indian bond market liquidity is improving, but corporate bonds can be thinly traded.
8. Advanced Trading Considerations
8.1 Algorithmic and Quantitative Trading
High-frequency trading in government bonds.
Arbitrage strategies using yield curve mispricings.
8.2 Portfolio Optimization
Combining bonds of different durations and credit qualities.
Risk-adjusted returns measured using metrics like Sharpe ratio.
8.3 Regulatory and Tax Considerations
Compliance with SEBI, RBI, and international regulations.
Tax efficiency plays a role in bond selection (e.g., municipal bonds in the U.S., tax-free bonds in India).
Conclusion
Bond and fixed-income trading requires a balance of knowledge, patience, and strategy. While bonds are traditionally seen as conservative instruments, sophisticated trading strategies—from interest rate anticipation and yield curve trades to credit spread plays—allow traders to capitalize on market inefficiencies. Understanding bond fundamentals, market dynamics, derivatives, and risk management principles is essential to crafting a successful fixed-income portfolio.
Bonds remain an indispensable tool for both income generation and portfolio diversification, bridging the gap between safety and opportunity in the financial markets.
Global Market Shifts1. Introduction
Global markets are dynamic ecosystems where capital, goods, services, and information flow across borders. Shifts in these markets represent changes in patterns of trade, investment, currency valuation, risk appetite, and economic influence among countries or regions. Understanding these shifts is crucial for investors, policymakers, and traders because they directly influence portfolio strategies, national economic stability, and global financial connectivity.
Global market shifts can be sudden, triggered by geopolitical events, technological breakthroughs, or crises, or they can be gradual, influenced by demographic trends, policy reforms, and shifts in global supply-demand balances. These shifts impact equities, bonds, commodities, foreign exchange, and digital assets, creating opportunities and risks in both short-term trading and long-term investment strategies.
2. Historical Perspective of Global Market Shifts
2.1 Pre-20th Century Shifts
The concept of global markets is not new. Historical shifts can be traced to:
The Age of Exploration (15th–17th century): European expansion opened global trade routes, creating early financial centers in Amsterdam and London.
Industrial Revolution (18th–19th century): Mass production and technological innovation shifted economic power to industrialized nations. Capital markets expanded to fund infrastructure and factories.
Colonial Trade: Commodities like sugar, cotton, and spices became globally traded, influencing global capital flows and wealth distribution.
2.2 Early 20th Century
Interwar Period: Post-WWI reconstruction caused capital flows from the US to Europe. The 1929 stock market crash highlighted the interconnectedness of global financial systems.
Post-WWII Era: Establishment of Bretton Woods institutions (IMF, World Bank) stabilized currencies and encouraged multilateral trade. The US dollar emerged as the global reserve currency, shifting financial power toward the United States.
2.3 Late 20th Century Shifts
Globalization and Trade Liberalization: The 1980s and 1990s saw a surge in cross-border investments, driven by deregulation, technology, and emerging markets (China, India).
Financial Crises: Events like the 1997 Asian Financial Crisis and 2008 Global Financial Crisis reshaped market confidence, risk management practices, and regulatory frameworks worldwide.
3. Drivers of Global Market Shifts
Global market shifts are driven by a combination of economic, technological, geopolitical, and behavioral factors. Understanding these drivers is crucial for predicting trends and managing risks.
3.1 Economic Drivers
Monetary Policy: Interest rate decisions by central banks (Fed, ECB, BoJ) influence capital flows and currency valuations, causing global shifts in investment and trade patterns.
Fiscal Policy: Government spending, taxation, and public debt impact domestic growth, influencing foreign investment.
Inflation & Deflation: High inflation reduces real returns on bonds and equities, causing shifts toward commodities or alternative assets.
Global Trade Dynamics: Trade agreements, tariffs, and sanctions alter supply chains and capital allocation across regions.
3.2 Technological Drivers
Digital Transformation: Automation, AI, blockchain, and fintech innovations reshape global trading, payments, and investment platforms.
High-Frequency Trading (HFT): Algorithmic trading exploits price discrepancies across global markets, accelerating the speed of capital shifts.
Data Availability: Real-time global economic data enables investors to react instantly, increasing volatility and market interconnectedness.
3.3 Geopolitical Drivers
Wars and Conflicts: Conflicts disrupt supply chains, commodity flows, and investor confidence.
Diplomacy and Sanctions: Trade restrictions or sanctions shift market focus toward alternative trading partners.
Political Stability: Stable governments attract foreign investment, while instability triggers capital flight.
3.4 Behavioral and Psychological Drivers
Investor Sentiment: Fear and greed cycles influence global capital allocation and risk appetite.
Herd Behavior: Collective reactions to news or trends can magnify market shifts, causing bubbles or crashes.
Speculation: Short-term speculative activity, especially in currencies and commodities, can exacerbate market swings.
4. Types of Global Market Shifts
4.1 Currency Shifts
Fluctuations in exchange rates impact global trade and investment. Examples include:
Dollar Strength/Weakness: The USD’s dominance affects emerging markets’ debt sustainability.
Currency Crises: Rapid devaluations in countries like Turkey or Argentina can trigger regional financial instability.
4.2 Equity Market Shifts
Sectoral Rotation: Global investment often rotates between sectors based on macroeconomic trends (e.g., tech vs. commodities).
Emerging Market Surges: Markets like China, India, or Brazil attract capital during periods of rapid growth.
Market Corrections: Large-scale corrections ripple through global markets, especially during crises.
4.3 Commodity Market Shifts
Oil & Gas: Geopolitical conflicts in the Middle East or supply disruptions cause global energy price shocks.
Metals & Agriculture: Changing demand from industrializing nations or climate events influence commodity markets.
Precious Metals: Gold and silver act as hedges during currency depreciation or inflation.
4.4 Bond Market Shifts
Interest Rate Changes: Global bond yields react to central bank policies.
Flight-to-Safety Movements: During crises, capital shifts from equities to sovereign bonds in stable economies.
4.5 Digital Asset Shifts
Cryptocurrencies and Central Bank Digital Currencies (CBDCs) introduce new dimensions in cross-border payments and speculative flows, often moving faster than traditional assets.
5. Mechanisms of Global Market Shifts
5.1 Capital Flows
Global capital shifts through foreign direct investment (FDI), portfolio investments, and cross-border loans. Key mechanisms include:
Equity Investment: Buying stocks in foreign markets.
Bond Purchases: Sovereign or corporate bonds attract global investors seeking yields.
Venture Capital & Private Equity: Funding emerging tech and startups drives long-term shifts.
5.2 Trade Shifts
Changes in import/export patterns directly impact currency strength, commodity prices, and equity markets.
Regional trade agreements (e.g., USMCA, RCEP) can reroute capital and investment priorities.
5.3 Technological Interconnectivity
Digital trading platforms, APIs, and HFT algorithms accelerate the speed and scale of global shifts.
Real-time news and analytics platforms make global markets reactive to small events.
5.4 Speculative Movements
Hedge funds and institutional traders use leverage to amplify global market shifts.
Speculative bubbles can cause temporary but impactful disruptions in asset prices.
6. Case Studies of Major Global Market Shifts
6.1 The 2008 Global Financial Crisis
Triggered by US subprime mortgage defaults.
Resulted in a global credit crunch, massive equity declines, and sovereign debt crises.
Shifted investment toward safer assets and caused long-term regulatory reforms.
6.2 COVID-19 Pandemic
Global lockdowns disrupted supply chains, commodity flows, and labor markets.
Accelerated technology adoption and digital finance.
Triggered massive central bank interventions, leading to low interest rates globally.
6.3 US-China Trade War (2018–2020)
Tariffs and sanctions caused supply chain rerouting and increased investment in alternative markets.
Global markets reacted with sectoral shifts, affecting technology, manufacturing, and agriculture.
6.4 Russia-Ukraine Conflict (2022–2025)
Energy and commodity markets experienced historic volatility.
Shifted global energy trade toward renewables and alternative suppliers.
Increased defense spending in Europe influenced equity and bond markets.
7. Implications for Stakeholders
7.1 Investors
Must diversify across regions, sectors, and asset classes.
Require active monitoring of macroeconomic indicators and geopolitical risks.
Can capitalize on emerging market growth or sectoral rotations.
7.2 Traders
High-frequency and algorithmic traders exploit short-term market inefficiencies.
Currency and commodity traders must track global capital flows and central bank policies.
News trading strategies become more critical in volatile environments.
7.3 Policymakers
Need to anticipate capital flight and currency volatility.
Must coordinate with international institutions to stabilize markets during crises.
Regulatory reforms can shape long-term market resilience and investor confidence.
7.4 Corporates
Supply chain disruptions necessitate alternative sourcing strategies.
Foreign exchange volatility affects revenue and profit margins.
Investment planning must account for global economic cycles and market shifts.
8. Emerging Trends Shaping Future Global Market Shifts
8.1 Rise of Emerging Markets
Countries like India, Vietnam, and Nigeria attract FDI due to growth potential.
Shifts capital from traditional power centers (US, EU) to these new hubs.
8.2 Digital Assets and Fintech
Cryptocurrencies, CBDCs, and blockchain-based platforms enable faster, cross-border capital movements.
Decentralized finance may reduce reliance on traditional banking channels.
8.3 Climate Change and ESG Investing
Green finance, carbon trading, and sustainability-linked investments are influencing global capital allocation.
Traditional energy sectors may see declining investments, while renewable energy surges.
8.4 Geopolitical Realignments
Regional conflicts, trade blocs, and shifting alliances (e.g., US–EU–Asia dynamics) will continue to drive market shifts.
Energy independence, defense spending, and technological self-sufficiency influence investment flows.
8.5 AI and Automation
Artificial intelligence accelerates market analysis, predictive modeling, and trading execution.
Could increase volatility but also enhance risk management.
9. Challenges in Navigating Global Market Shifts
Volatility: Rapid shifts can erode capital and destabilize portfolios.
Information Overload: Massive real-time data streams make it difficult to separate noise from meaningful signals.
Policy Uncertainty: Sudden changes in regulations, sanctions, or trade policies create unpredictability.
Technological Disruption: Markets must adapt to fintech innovations, automated trading, and digital currencies.
Climate & ESG Risks: Environmental crises and regulations may cause unexpected sectoral disruptions.
10. Conclusion
Global market shifts are a complex interplay of economic, geopolitical, technological, and behavioral forces. They can be incremental or sudden, affecting currencies, equities, commodities, bonds, and digital assets. Historical crises demonstrate the interconnected nature of markets, while emerging trends highlight the importance of technology, sustainability, and global cooperation.
For investors, traders, corporates, and policymakers, understanding these shifts is no longer optional—it is essential. Effective strategies require real-time information, diversified portfolios, risk management, and a forward-looking approach that anticipates structural changes in the global economy.
By studying past shifts and monitoring ongoing developments, market participants can navigate volatility, capitalize on opportunities, and mitigate risks in an increasingly interconnected financial world.

Psychology of Trading in the AI Era1. Evolution of Trading Psychology
Historically, market psychology focused on human behaviors:
Fear and Greed: Primary drivers of market cycles, often triggering panic selling or irrational buying.
Overconfidence: Traders overestimating their predictive abilities.
Herd Behavior: Following the crowd during market rallies or crashes.
Loss Aversion: Greater emotional impact of losses than equivalent gains.
In the AI era, these psychological patterns persist but are influenced by algorithmic behavior. Humans now interact not only with other humans but also with machines that respond instantly to market data, magnifying emotional triggers.
2. AI and Market Dynamics
AI systems, especially those using machine learning and neural networks, introduce new dynamics:
Speed and Precision: AI executes trades in milliseconds, leaving human reaction time irrelevant.
Pattern Recognition: AI identifies opportunities invisible to humans, sometimes creating “ghost signals” that affect human sentiment.
Predictive Models: Some AI predicts market trends based on massive datasets, challenging traders’ intuition.
These changes mean that traders must adapt psychologically. Traditional patience and slow analysis may no longer be sufficient, leading to stress, anxiety, or impulsive decisions.
3. Psychological Challenges in the AI Era
a. Information Overload
AI systems generate enormous amounts of data, including:
Real-time price signals
Sentiment analysis
News-driven indicators
Algorithmic trade flows
Humans struggle to process this volume, causing decision fatigue and analysis paralysis.
b. Trust vs. Skepticism
Traders face a dilemma:
Blind trust in AI can result in over-reliance and ignoring market context.
Excessive skepticism may cause missed opportunities.
Balancing trust in AI tools while maintaining independent judgment is a critical psychological skill.
c. Emotional Detachment
AI trades without emotion. Humans must learn emotional detachment from market noise while avoiding over-mechanical behavior that ignores risk management.
d. Short-Termism and Overtrading
AI accelerates market movement. Humans may feel pressured to match AI speed, leading to impulsive, short-term trades and higher stress levels.
4. Cognitive Biases in the AI Era
Even in AI-driven markets, human biases persist:
Confirmation Bias: Seeking AI outputs that match pre-existing beliefs.
Recency Bias: Overweighting recent AI-predicted trends.
Illusion of Control: Believing one can “beat the AI” consistently.
Anchoring Bias: Fixating on AI’s initial signal and failing to adjust when conditions change.
Recognizing these biases is vital to avoid psychological pitfalls.
5. Human-AI Interaction
Trading psychology now involves symbiosis between humans and AI:
Complementary Roles: Humans provide intuition, context, and risk management; AI offers speed and data processing.
Feedback Loops: Traders can learn from AI behavior, but AI models also react to aggregated human behavior, creating complex dynamics.
Adaptation Stress: Traders must continually adapt to AI updates and changing market algorithms.
6. Strategies for Psychological Resilience
a. Risk Management
Clear rules for position sizing, stop-loss levels, and portfolio diversification reduce emotional stress.
b. Mindfulness and Emotional Control
Practices such as meditation, journaling, and stress monitoring help maintain psychological balance.
c. Education and AI Literacy
Understanding how AI works reduces fear and improves trust. Traders should:
Learn AI signals’ limitations
Avoid over-dependence
Develop critical thinking for algorithmic recommendations
d. Incremental Integration
Gradually incorporating AI into trading routines prevents overwhelm and helps maintain confidence.
7. Case Studies
High-Frequency Trading (HFT) Stress: Traders monitoring HFT systems report extreme pressure to respond to AI-driven market moves, causing burnout.
Algorithmic Signal Misinterpretation: Human traders acting impulsively on AI signals without understanding context often face losses, highlighting the need for psychological discipline.
Successful Human-AI Collaboration: Long-term investors using AI for data analysis while applying human judgment achieve higher consistency and emotional stability.
8. Future Outlook
As AI advances:
Cognitive Skills Will Matter More: Pattern recognition, intuition, and judgment will remain key.
Emotional Intelligence: Traders who manage fear, greed, and stress will outperform purely reactive participants.
Ethical Considerations: AI trading may amplify market manipulation or flash crashes, testing traders’ risk perception and psychological endurance.
The AI era requires a new kind of trading psychology—one that blends human intuition, discipline, and emotional intelligence with machine efficiency.
9. Practical Tips for Traders in the AI Era
Maintain a trading journal to track both AI signals and emotional responses.
Set automated risk parameters to prevent impulsive reactions.
Limit screen time to avoid overstimulation from real-time AI data.
Regularly review AI strategies to understand logic and adjust biases.
Build a supportive network to discuss AI-related trading psychology challenges.
Conclusion
Trading psychology in the AI era is a fusion of old and new challenges. While human emotions, cognitive biases, and behavioral patterns persist, the speed, complexity, and data-driven nature of AI fundamentally alter market dynamics. Traders must adapt by embracing emotional discipline, AI literacy, and strategic integration of human intuition with machine intelligence.
Success in the AI era requires resilience, awareness, and a harmonious human-AI partnership. The psychological battlefield has expanded, but so has the potential for those who master both human mind and machine power.
Part 4 Institutional TradingThe Structure of an Option Contract
Every option contract has certain key components:
Underlying asset – The stock, index, or commodity the option is based on.
Strike price – The agreed-upon price at which the asset can be bought or sold.
Expiration date – The last date when the option can be exercised.
Premium – The cost paid by the buyer to the seller.
Lot size – The standardized quantity of the underlying represented by one option contract.
Example:
If you buy a Nifty 20,000 Call Option at ₹200 premium, one lot size is 50.
Total cost = ₹200 × 50 = ₹10,000.
You gain if Nifty moves above 20,200 (strike + premium).

Part 3 Institutional Trading 1. What Are Options?
1.1 Definition
An option is a financial derivative contract that gives the buyer the right, but not the obligation, to buy or sell an underlying asset at a predetermined price (strike price) on or before a specified date (expiry).
Call Option: Right to buy.
Put Option: Right to sell.
The buyer of an option pays a premium to the seller (writer) for acquiring this right.
1.2 Underlying Assets
Options can be written on:
Equities (stocks)
Indices (Nifty, S&P 500, etc.)
Commodities (gold, crude oil)
Currencies (USD/INR, EUR/USD)
Interest rates & bonds
This wide range makes them versatile instruments for trading and hedging.

Part 2 Ride The Big MovesIntroduction
Financial markets have evolved significantly over the last century, offering a wide variety of instruments to investors and traders. One such instrument is options, which provide flexibility, leverage, and hedging opportunities. Unlike straightforward investments such as stocks or bonds, option trading involves contracts that derive their value from an underlying asset—making them part of the broader derivatives market.
For professional traders, options are indispensable for hedging risk, generating income, and leveraging market moves. For retail participants, they represent both a fascinating opportunity and a high-risk tool that requires discipline and knowledge.
This guide explains option trading in detail, starting from the basics and moving into advanced strategies, risks, and practical applications.

Part 1 Ride The Big Moves1. Introduction to Options
An option is a financial contract that gives the buyer the right, but not the obligation, to buy or sell an underlying asset at a predetermined price, called the strike price, before or on a specified expiration date. Unlike stocks, options do not represent ownership in a company; instead, they are derivatives whose value is derived from the underlying asset (stocks, indices, commodities, or currencies).
There are two primary types of options:
Call Option: Grants the holder the right to buy the underlying asset at the strike price.
Put Option: Grants the holder the right to sell the underlying asset at the strike price.
Options can be American style (exercisable any time before expiration) or European style (exercisable only on the expiration date).
2. Key Terminology in Options Trading
To trade options effectively, you must understand the key terms:
Strike Price (Exercise Price): The price at which the underlying asset can be bought (call) or sold (put).
Premium: The cost of buying an option. Determined by factors like intrinsic value, time to expiration, volatility, and interest rates.
Expiration Date: The date on which the option contract becomes invalid.
In-the-Money (ITM): A call option is ITM if the stock price > strike price; a put is ITM if stock price < strike price.
Out-of-the-Money (OTM): A call option is OTM if the stock price < strike price; a put is OTM if stock price > strike price.
At-the-Money (ATM): The stock price is approximately equal to the strike price.
3. How Options Work
Options allow investors to control a larger number of shares with relatively small capital. Let’s look at an example:
Example:
Stock price of XYZ Ltd.: ₹1,000
Call option strike price: ₹1,050
Premium: ₹50
Expiration: 1 month
If the stock rises to ₹1,200, the call option holder can exercise the option, buy at ₹1,050, and sell at ₹1,200, making a profit of ₹150 per share (minus the premium of ₹50, net profit = ₹100).
If the stock stays below ₹1,050, the option expires worthless, and the loss is limited to the premium paid.
This limited-loss feature makes options attractive for hedging.
4. Participants in Options Market
Options trading involves different market participants with varying objectives:
Hedgers: Use options to protect their existing investments from adverse price movements. For example, a stock investor buys a put option to safeguard against a potential fall in stock price.
Speculators: Seek profit from price movements without owning the underlying asset. They take higher risk for potentially higher rewards.
Arbitrageurs: Exploit price discrepancies between options and the underlying assets to earn risk-free profits.
5. Option Pricing Models
Option pricing is critical for traders. The two most commonly used models are:
Black-Scholes Model (for European options):
It calculates the theoretical value of options using factors such as stock price, strike price, time to expiration, volatility, and risk-free interest rate.
Binomial Model:
Uses a step-by-step approach to evaluate options, useful for American options due to their early-exercise feature.
Factors Affecting Option Premiums:
Intrinsic Value: Difference between the underlying price and strike price.
Time Value: Additional value due to remaining time until expiration.
Volatility: Higher volatility increases premiums.
Interest Rates and Dividends: Can influence option pricing.

Part 12 Trading Master Class With ExpertsI. Introduction to Options
What is an Option?
An option is a financial derivative contract that gives the buyer the right, but not the obligation, to buy or sell an underlying asset at a predetermined price (strike price) within a specified time period. Options derive their value from the underlying asset, which can be stocks, indices, commodities, currencies, or ETFs.
Types of Options
There are two primary types:
Call Option: Gives the holder the right to buy the underlying asset at a strike price before expiration.
Put Option: Gives the holder the right to sell the underlying asset at a strike price before expiration.
Buyers vs. Sellers
Option Buyer (Holder): Pays a premium for the right to exercise the option. Limited risk (premium paid), unlimited or capped potential reward depending on call or put.
Option Seller (Writer): Receives the premium. Obligated to fulfill the contract if exercised. Higher risk, especially in uncovered options.
Option Premium Explained
The premium is the price paid for the option. It comprises two components:
Intrinsic Value: The real, immediate profit if exercised now (for in-the-money options).
Time Value: Additional value based on time left until expiration and market volatility.
Option Expiration and Exercise
Options have a fixed expiration date. Exercise can happen in two ways:
American Style: Can be exercised any time before expiration.
European Style: Can only be exercised at expiration.
II. Understanding Option Pricing
Factors Affecting Option Pricing
The price of an option (premium) is influenced by:
Underlying asset price
Strike price
Time to expiration
Volatility
Interest rates
Dividends
Intrinsic vs. Extrinsic Value
Intrinsic Value: Difference between underlying asset price and strike price (only if in-the-money).
Extrinsic Value: Time value and volatility premium. Represents potential for future gains.
Moneyness of Options
Options are classified based on their intrinsic value:
In-the-Money (ITM): Profitable if exercised now.
At-the-Money (ATM): Strike price equals the underlying asset price.
Out-of-the-Money (OTM): Not profitable if exercised now.
The Greeks – Risk and Sensitivity Measures
Options are influenced by “Greeks” which measure sensitivity to different factors:
Delta: Sensitivity of option price to underlying asset price change.
Gamma: Rate of change of delta.
Theta: Time decay of option value.
Vega: Sensitivity to volatility.
Rho: Sensitivity to interest rates.
Black-Scholes & Binomial Models
Option pricing models estimate theoretical values:
Black-Scholes Model: For European options; factors in price, strike, volatility, time, and risk-free rate.
Binomial Model: Uses a stepwise approach; suitable for American options.

BORANA 1 Day ViewBORANA is trading at ₹222.33, reflecting a 2.86% increase for the day.
📈 1-Day Technical Overview
Opening Price: ₹217.85
Day’s Range: ₹215.35 – ₹228.00
Closing Price: ₹222.33
Volume: Approximately 166,570 shares traded
🔍 Key Technical Indicators
RSI (14): 60.94 — Neutral to bullish, indicating moderate buying interest
MACD: 0.24 — Bullish, suggesting upward momentum
ADX (14): 19.01 — Neutral, implying no strong trend direction
Stochastic RSI: 0 — Strong downtrend, caution advised
Williams %R: -37.15 — Neutral, no clear overbought or oversold signal
Moving Averages:
20-day EMA: ₹218.62 — Neutral
50-day EMA: ₹221.40 — Neutral
200-day EMA: Data not available
20-day SMA: ₹217.44 — Neutral
50-day SMA: ₹220.29 — Neutral
200-day SMA: Data not available
📊 Summary
The stock is experiencing a positive intraday movement, trading above its opening price and near the day's high. While the RSI and MACD indicate moderate bullishness, the Stochastic RSI suggests a potential downtrend. Investors should monitor these indicators closely for any signs of trend reversal or continuation.
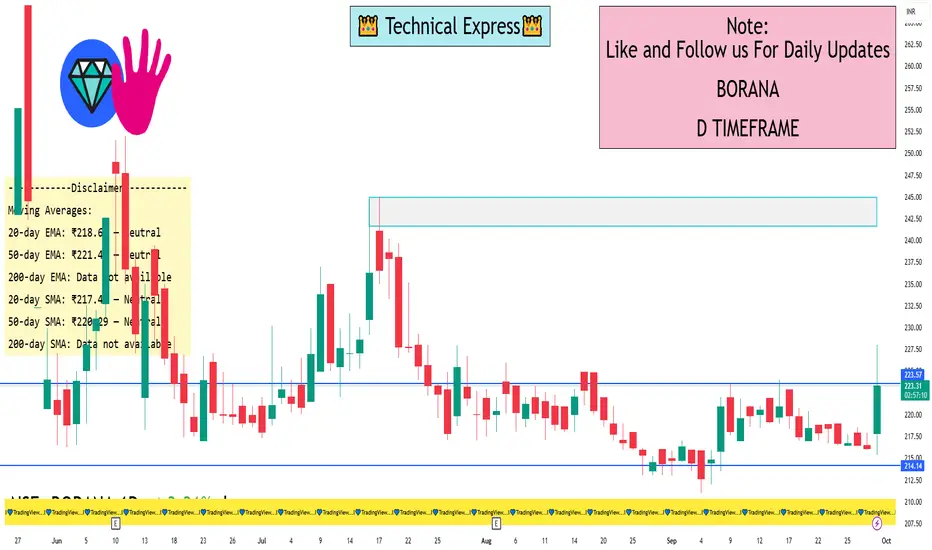
RHIM 1 Day View📊 Technical Overview
Current Price: ₹445.00
Day’s Range: ₹440.00 – ₹453.10
Previous Close: ₹451.45
52-Week Range: ₹376.45 – ₹640.00
🔻 Bearish Indicators
RSI (14): 24.86 — Oversold condition, suggesting potential for a rebound.
MACD: -7.80 — Indicates downward momentum.
Moving Averages:
5-day: ₹444.48 — Slightly above current price.
50-day: ₹469.06 — Bearish crossover.
200-day: ₹478.22 — Further confirmation of downtrend.
Technical Indicators: Strong Sell signals across multiple platforms.
🔧 Support & Resistance Levels
Support: ₹440.00 — Recent low.
Resistance: ₹453.10 — Day’s high.
Pivot Point: ₹495.97 — Indicates potential reversal if breached.
⚠️ Summary
RHI Magnesita India Ltd is currently in a downtrend, with technical indicators signaling a strong sell. The stock is approaching key support levels, and while it is oversold, caution is advised. Traders should monitor for any bullish reversal patterns or volume spikes before considering entry points.