Technical Indicators 1. Introduction to Technical Indicators
Technical indicators are mathematical calculations based on historical price, volume, or open interest data. They are primarily used in technical analysis, a method of evaluating securities by analyzing market statistics rather than intrinsic value.
Indicators help traders:
Identify trends and reversals.
Determine momentum and market strength.
Recognize overbought or oversold conditions.
Generate buy or sell signals.
There are three main categories of technical indicators:
Trend Indicators – Identify the direction and strength of a trend.
Momentum Indicators – Measure the speed and force of price movements.
Volume Indicators – Analyze trading activity to confirm price movements.
Some indicators are leading, giving early signals of potential price movement, while others are lagging, confirming trends after they have started.
2. Trend Indicators
Trend indicators help traders identify whether an asset is moving upward, downward, or sideways. Recognizing trends early allows traders to align their strategies with the market direction.
2.1 Moving Averages (MA)
Moving averages smooth out price data to reveal trends over a specific period. There are two main types:
Simple Moving Average (SMA):
Calculated by averaging the closing prices over a specified period.
Example: A 50-day SMA sums the last 50 closing prices and divides by 50.
Exponential Moving Average (EMA):
Places more weight on recent prices, making it more responsive to price changes.
Applications:
Trend identification: Prices above the MA indicate an uptrend; below indicate a downtrend.
Crossovers: A short-term MA crossing above a long-term MA generates a bullish signal, and vice versa.
Limitations:
Lagging indicator, less effective in sideways markets.
2.2 Moving Average Convergence Divergence (MACD)
MACD measures the difference between two EMAs (usually 12-day and 26-day).
Components:
MACD Line: Difference between the fast and slow EMA.
Signal Line: 9-day EMA of the MACD line.
Histogram: Difference between MACD line and Signal line.
Interpretation:
Crossovers: MACD crossing above Signal line = buy signal; below = sell signal.
Divergence: Price making new highs while MACD fails indicates trend weakness.
Strengths:
Effective for spotting trend reversals and momentum shifts.
Weaknesses:
Lagging indicator; may give false signals in choppy markets.
2.3 Average Directional Index (ADX)
ADX measures the strength of a trend regardless of its direction.
Values above 25 indicate a strong trend.
Values below 20 suggest a weak trend or sideways market.
Applications:
Confirming trend strength before entering a trade.
Pairing with other indicators for trend-following strategies.
Limitations:
Does not indicate trend direction, only strength.
3. Momentum Indicators
Momentum indicators assess the speed of price movements, helping traders identify potential reversals or continuation patterns.
3.1 Relative Strength Index (RSI)
RSI measures the magnitude of recent price changes to evaluate overbought or oversold conditions.
Values above 70 = overbought (possible reversal or pullback).
Values below 30 = oversold (possible rebound).
Applications:
Divergence between RSI and price signals potential trend reversals.
Combining RSI with trend indicators enhances trade accuracy.
Limitations:
Can remain overbought or oversold for extended periods in strong trends.
3.2 Stochastic Oscillator
The stochastic oscillator compares a security’s closing price to its price range over a specific period.
%K Line: Current close relative to the high-low range.
%D Line: 3-period moving average of %K.
Interpretation:
Values above 80 = overbought; below 20 = oversold.
Crossovers of %K and %D lines indicate potential buy/sell signals.
Strengths:
Effective in volatile markets for timing entries and exits.
Weaknesses:
Less effective during strong trends; prone to false signals.
3.3 Rate of Change (ROC)
ROC measures the percentage change in price over a given period.
Positive ROC indicates upward momentum.
Negative ROC signals downward momentum.
Applications:
Identifying early trend reversals.
Confirming breakouts or breakdowns.
Limitations:
Sensitive to price spikes; may give false signals in choppy markets.
4. Volume Indicators
Volume analysis confirms price trends, as strong moves are typically accompanied by high volume.
4.1 On-Balance Volume (OBV)
OBV measures cumulative buying and selling pressure by adding volume on up days and subtracting volume on down days.
Applications:
Divergence between OBV and price can signal reversals.
Confirming trend strength.
Limitations:
Lagging indicator; requires combination with price analysis.
4.2 Chaikin Money Flow (CMF)
CMF measures the volume-weighted average of accumulation and distribution over a specified period.
Positive CMF = buying pressure.
Negative CMF = selling pressure.
Applications:
Identifying accumulation or distribution phases.
Supporting trade entries in trend-following strategies.
Weaknesses:
Less effective during low-volume periods.
5. Volatility Indicators
Volatility indicators help traders gauge market risk and potential price swings.
5.1 Bollinger Bands
Bollinger Bands consist of a moving average (middle band) and upper/lower bands based on standard deviation.
Price near upper band = overbought.
Price near lower band = oversold.
Applications:
Trading range-bound markets using band bounces.
Breakouts indicated when price moves outside bands.
Limitations:
Band breakouts don’t always result in sustained trends.
5.2 Average True Range (ATR)
ATR measures market volatility by calculating the average of true price ranges over a period.
Applications:
Setting stop-loss levels.
Identifying breakout potential.
Limitations:
Does not indicate trend direction, only volatility.
6. Combining Indicators for Strategy
Using a single indicator often results in false signals. Effective traders combine indicators from different categories:
Trend + Momentum:
Example: Use SMA to identify trend direction and RSI to detect overbought/oversold conditions.
Trend + Volume:
Example: Confirm trend strength with ADX and OBV before entering a trade.
Momentum + Volatility:
Example: Use MACD for momentum and ATR to set stop-loss levels.
Rule of Thumb:
Avoid indicators that provide the same information.
Mix leading and lagging indicators for better confirmation.
7. Indicator-Based Trading Strategies
7.1 Trend-Following Strategy
Use moving averages or ADX to identify trends.
Enter trades in the direction of the trend.
Use momentum indicators like MACD or RSI for entry timing.
7.2 Reversal Strategy
Use RSI, Stochastic, or Bollinger Bands to detect overbought/oversold conditions.
Look for divergence between price and indicator for potential reversals.
7.3 Breakout Strategy
Use Bollinger Bands or price channels to identify consolidation.
Volume indicators like OBV or CMF confirm breakout strength.
8. Common Mistakes in Using Indicators
Overloading charts: Too many indicators can confuse signals.
Ignoring market context: Indicators must be interpreted in conjunction with price action.
Blind reliance: No indicator guarantees success; risk management is crucial.
Neglecting timeframes: Indicators behave differently on daily, weekly, or intraday charts.
9. Advanced Indicator Techniques
Divergence Trading: Identifying differences between price and indicators like MACD or RSI to spot potential reversals.
Multiple Timeframe Analysis: Confirm signals from multiple timeframes to reduce false entries.
Weighted Indicators: Adjust indicator sensitivity to reduce lag or noise.
Algorithmic Integration: Using indicators as inputs in automated trading systems.
10. Choosing the Right Indicators
Factors to consider:
Trading style: Day traders vs. swing traders vs. long-term investors.
Market conditions: Trending vs. ranging markets.
Timeframe: Short-term indicators are more sensitive; long-term indicators reduce noise.
Simplicity: Choose a few reliable indicators rather than overwhelming charts.
11. Conclusion
Mastering technical indicators requires practice, observation, and discipline. While indicators provide valuable insights into market behavior, they are most effective when combined with strong risk management and a clear trading plan.
Successful traders:
Use indicators to enhance decision-making, not replace it.
Test strategies thoroughly before applying them in live markets.
Adapt indicator settings to suit different market conditions.
By understanding the nuances of trend, momentum, volume, and volatility indicators, traders can create robust strategies that increase probability and confidence in their trades. This Technical Indicators Masterclass equips traders with the knowledge to analyze markets effectively and navigate complex price movements with precision.
Tradingideas
Momentum & Trend Following Strategies in TradingUnderstanding Momentum in Trading
Momentum refers to the rate at which the price of a financial instrument moves in a particular direction. Traders who adopt momentum strategies aim to buy assets showing upward momentum and sell assets showing downward momentum. The underlying assumption is that price trends, once established, tend to persist due to behavioral biases and institutional flows.
Key Concepts in Momentum Trading
Relative Strength: Momentum traders often compare the performance of an asset against its historical performance or a benchmark. Assets outperforming the market are considered candidates for buying, while underperforming assets may be sold or shorted.
Price Rate of Change (ROC): This measures the percentage change in an asset’s price over a specified period, helping traders identify accelerating trends.
Moving Averages & Crossovers: Traders use short-term and long-term moving averages to spot momentum. For instance, if a 20-day moving average crosses above a 50-day moving average, it signals upward momentum.
Breakouts: Momentum traders look for price breakouts from key resistance or support levels, often indicating the start of a strong directional move.
Volume Confirmation: A momentum move accompanied by higher trading volume suggests conviction and increases the probability of trend continuation.
Behavioral Rationale
Momentum is strongly linked to investor psychology. Behavioral biases such as herding, overconfidence, and delayed reaction to news contribute to the persistence of price trends. Market participants tend to chase rising assets, amplifying momentum, while undervalued or declining assets continue to fall as pessimism dominates sentiment.
Momentum Indicators
Several technical indicators are widely used in momentum trading:
Relative Strength Index (RSI): Measures the speed and change of price movements; helps identify overbought or oversold conditions.
Moving Average Convergence Divergence (MACD): Identifies trend direction and momentum strength.
Stochastic Oscillator: Compares a security’s closing price to its price range over a period, indicating momentum shifts.
Rate of Change (ROC): Quantifies the percentage change in price over a specified time frame.
Momentum strategies are typically short-to-medium-term, ranging from a few days to several months, depending on market conditions and the trader’s time horizon.
Understanding Trend Following
Trend following is a broader trading approach based on identifying and riding long-term directional movements in the market. Unlike momentum trading, which focuses on relative performance and price acceleration, trend following emphasizes sustained price movements regardless of speed. Trend followers aim to enter trades in the direction of the prevailing trend and exit when trends reverse.
Core Principles of Trend Following
Markets Trend More Often Than They Mean-Revert: Trend followers operate on the principle that markets, over medium to long-term periods, exhibit trends in response to macroeconomic factors, sentiment shifts, or institutional positioning.
Trading with the Market: Trend following is inherently reactive. Traders wait for clear signals from price movements rather than predicting reversals or tops and bottoms.
Risk Management and Position Sizing: Since trends can reverse unexpectedly, risk management is critical. Trend followers use stop losses, trailing stops, and controlled position sizes to protect capital.
Time Horizon: Trend-following strategies typically have longer holding periods than momentum strategies, ranging from weeks to months or even years in certain markets, such as commodities or forex.
Trend Following Indicators
Trend-following strategies rely heavily on technical indicators to identify the direction and strength of trends:
Moving Averages: Simple Moving Average (SMA) or Exponential Moving Average (EMA) crossovers are common trend signals. For example, a trader may buy when a shorter-term EMA crosses above a longer-term EMA.
Average Directional Index (ADX): Measures the strength of a trend regardless of direction; values above 25 often indicate a strong trend.
Bollinger Bands: Trend followers use bands to confirm price breakouts or sustained trends.
Parabolic SAR: Identifies potential trend reversals and helps with trailing stops.
Practical Implementation
Step 1: Market Selection
Both momentum and trend-following strategies can be applied across multiple markets, including:
Equities: Individual stocks or stock indices.
Forex: Currency pairs exhibiting strong directional movements.
Commodities: Metals, oil, and agricultural products.
Cryptocurrencies: Digital assets with high volatility and clear trends.
Step 2: Identifying Trends or Momentum
For momentum trading, rank assets based on recent performance, RSI, or ROC indicators.
For trend-following, analyze price charts for moving average crossovers, trendlines, or ADX confirmation.
Step 3: Entry and Exit Rules
Momentum Entry: Buy assets showing positive momentum or breaking above resistance; sell or short assets showing negative momentum.
Trend-Following Entry: Enter positions in the direction of the prevailing trend after confirmation from moving averages or trendlines.
Exit Rules: Use stop losses, trailing stops, or reversal signals to exit positions. Trend followers often ride trends until technical indicators signal a reversal.
Step 4: Risk Management
Risk management is critical for both strategies:
Position Sizing: Determine trade size based on account equity and risk tolerance (e.g., risking 1–2% per trade).
Diversification: Spread risk across multiple assets to reduce exposure to a single market.
Stop Losses: Protect capital from unexpected reversals.
Volatility Adjustment: Higher volatility assets may require tighter risk controls or smaller position sizes.
Advanced Strategy Variations
Dual Momentum: Combines relative and absolute momentum. Traders invest in assets with the strongest performance relative to others while ensuring they are positive in absolute terms.
Trend-Momentum Hybrid: Uses momentum indicators for entry and trend-following techniques for position management. For example, enter on RSI breakout but use moving averages to exit.
Sector Rotation: Momentum traders may rotate capital between sectors or asset classes based on relative performance trends.
Algorithmic and Systematic Approaches: Many hedge funds implement algorithmic momentum and trend-following strategies using quantitative models, high-frequency data, and machine learning for signal optimization.
Performance and Market Conditions
Momentum and trend-following strategies tend to perform differently depending on market conditions:
Trending Markets: Both strategies excel in strong, directional trends. Trend followers benefit from sustained moves, while momentum traders profit from short bursts of strong performance.
Choppy or Sideways Markets: Momentum strategies may generate false signals, while trend-following strategies may suffer from whipsaw losses.
Volatile Markets: Momentum strategies can capture rapid gains, but risk management is crucial to avoid large drawdowns.
Empirical studies have shown that momentum strategies often produce short-term outperformance in equities and commodities, while trend-following strategies are particularly effective in commodity, forex, and futures markets over the long term.
Behavioral and Psychological Considerations
Both momentum and trend-following strategies exploit behavioral biases:
Herding: Investors tend to follow recent winners, reinforcing momentum.
Anchoring: Market participants anchor to past prices, creating delayed reactions that trend followers can exploit.
Overreaction: Short-term overreactions create opportunities for momentum trades.
Discipline Requirement: Traders must overcome fear and greed, sticking to systematic rules rather than attempting to time reversals.
Examples of Momentum & Trend Following
Equities: Buying technology stocks outperforming the S&P 500 for the past 3–6 months (momentum) or holding positions until a 50-day moving average crossover signals a reversal (trend-following).
Forex: Trading EUR/USD when it breaks above a recent high with increasing volume (momentum) or following a long-term uptrend using EMA crossovers (trend-following).
Commodities: Entering oil futures when prices break out from a support/resistance zone (momentum) or riding a multi-month trend using ADX to gauge trend strength (trend-following).
Advantages and Limitations
Advantages
Simplicity: Rules-based approach allows systematic trading.
Adaptability: Works across multiple markets and timeframes.
Behavioral Edge: Exploits common psychological biases in trading.
Scalability: Can be applied to both retail and institutional portfolios.
Limitations
False Signals: Particularly in range-bound markets, leading to potential losses.
Drawdowns: Both strategies can experience significant losses during trend reversals.
Market Sensitivity: Performance may degrade in markets with low liquidity or sudden news shocks.
Discipline Required: Traders must follow strict rules, avoiding emotional decision-making.
Conclusion
Momentum and trend-following strategies are pillars of modern trading methodology. While momentum strategies capitalize on short-term price accelerations, trend-following strategies aim to capture long-term directional moves. Both approaches are grounded in behavioral finance principles, technical analysis, and empirical research, making them effective tools for traders seeking systematic, disciplined approaches.
The success of these strategies depends on rigorous market analysis, sound risk management, and psychological discipline. While they are not immune to losses, their adaptability across markets, scalability, and historical efficacy make them indispensable in both retail and institutional trading.
By combining these strategies intelligently, traders can create robust portfolios capable of profiting in multiple market conditions, harnessing both short-term momentum surges and long-term trends for sustained success.
Behavioral Finance and Trader Psychology:Introduction
The traditional models of finance and economics often assume that individuals are rational decision-makers, consistently acting in their best interests to maximize utility. However, real-world financial behavior frequently deviates from these assumptions. Behavioral finance and trader psychology delve into the psychological influences and biases that affect financial decision-making, challenging the notion of rational actors in the market.
Behavioral Finance: An Overview
Definition and Emergence
Behavioral finance is a subfield of behavioral economics that examines how psychological factors influence financial behaviors and market outcomes. It emerged in the late 1970s as a response to the Efficient Market Hypothesis (EMH), which posits that asset prices reflect all available information and thus always trade at their fair value. Behavioral finance contends that cognitive biases and emotional factors lead to market anomalies and inefficiencies.
Key Concepts in Behavioral Finance
Cognitive Biases: These are systematic patterns of deviation from norm or rationality in judgment, whereby inferences about other people and situations may be drawn in an illogical fashion. Common cognitive biases include:
Confirmation Bias: The tendency to search for, interpret, favor, and recall information in a way that confirms one's preexisting beliefs or hypotheses.
Anchoring Bias: The reliance on the first piece of information encountered (the "anchor") when making decisions.
Overconfidence Bias: The tendency to overestimate one's own abilities, knowledge, or control over events.
Availability Bias: The tendency to overestimate the likelihood of events based on their availability in memory.
Emotional Biases: These biases arise from emotions and feelings that influence decision-making. Examples include:
Loss Aversion: The tendency to prefer avoiding losses rather than acquiring equivalent gains; it's better to not lose $5 than to find $5.
Regret Aversion: The reluctance to make decisions due to the fear of making a wrong choice and the potential for future regret.
Herd Behavior: The tendency to mimic the actions (rational or irrational) of a larger group, often leading to asset bubbles or crashes.
Market Implications
Behavioral finance explains various market phenomena that traditional theories struggle with, such as asset bubbles, market crashes, and anomalies like the January effect or momentum. It suggests that markets are not always efficient and that prices can deviate from their intrinsic values due to collective psychological factors.
Trader Psychology: The Emotional Landscape of Trading
Definition and Importance
Trader psychology refers to the emotional and mental state of a trader, which significantly impacts their trading decisions and performance. Understanding trader psychology is crucial because emotions like fear, greed, and hope can lead to impulsive decisions, overtrading, or holding onto losing positions longer than rational analysis would suggest.
Common Psychological Challenges
Fear and Greed: These are the two primary emotions that drive market behavior. Fear can lead to panic selling during downturns, while greed can result in chasing after high-risk, high-reward opportunities during bull markets.
Overtrading: Driven by the desire to make profits or recover losses, traders may engage in excessive trading, leading to higher transaction costs and potential losses.
Loss Aversion: Traders may hold onto losing positions longer than advisable, hoping the market will turn in their favor, due to the psychological pain associated with realizing a loss.
Confirmation Bias: Traders may seek information that confirms their existing beliefs about a trade, ignoring contradictory evidence, which can lead to poor decision-making.
Strategies for Managing Trader Psychology
Developing a Trading Plan: Having a clear plan with defined entry and exit points can help mitigate emotional decision-making.
Risk Management: Setting stop-loss orders and position sizes can prevent significant losses and reduce emotional stress.
Mindfulness and Emotional Awareness: Practicing mindfulness can help traders recognize emotional reactions and prevent them from influencing trading decisions.
Continuous Learning: Educating oneself about psychological biases and their impact on trading can lead to more rational decision-making.
Integrating Behavioral Finance and Trader Psychology
The integration of behavioral finance and trader psychology offers a comprehensive understanding of financial decision-making. While behavioral finance provides a framework for understanding how biases and emotions affect market outcomes, trader psychology focuses on the individual trader's mental and emotional state. Together, they highlight the importance of psychological factors in financial markets and the need for strategies to mitigate their negative effects.
Conclusion
Behavioral finance and trader psychology underscore the complexity of financial markets and the significant role of human behavior in shaping market outcomes. By acknowledging and understanding the psychological factors that influence decision-making, investors and traders can develop strategies to make more informed and rational financial decisions. This holistic approach not only enhances individual performance but also contributes to the overall efficiency and stability of financial markets.
ESG Investing and Carbon Credit Trading1. Understanding ESG Investing
1.1 Definition of ESG Investing
ESG investing refers to investment strategies that incorporate environmental, social, and governance factors into the analysis of companies and assets. Rather than solely focusing on financial returns, ESG investing evaluates:
Environmental (E): A company’s impact on the natural environment, including carbon emissions, waste management, water usage, and energy efficiency.
Social (S): The company’s relationships with employees, suppliers, customers, and communities. It includes labor standards, diversity and inclusion, community engagement, and human rights.
Governance (G): Corporate governance practices such as board structure, executive compensation, shareholder rights, transparency, and ethical business conduct.
ESG investing can take several forms, such as negative screening (excluding companies that harm society or the environment), positive screening (investing in companies with strong ESG practices), or impact investing (targeting investments that generate measurable social or environmental benefits alongside financial returns).
1.2 Evolution and Global Adoption
ESG investing gained traction in the early 2000s, influenced by growing awareness of climate change, social inequality, and corporate scandals. Key drivers include:
Regulatory pressures: Governments and regulatory bodies worldwide now require companies to disclose ESG risks and sustainability reporting.
Investor demand: Institutional investors, such as pension funds and sovereign wealth funds, increasingly prioritize ESG to mitigate long-term risks.
Corporate accountability: Companies with strong ESG profiles often demonstrate resilience, lower regulatory risks, and better operational efficiency.
The market for ESG investments has expanded exponentially. According to the Global Sustainable Investment Alliance (GSIA), sustainable investment assets exceeded $35 trillion globally in 2023, representing over 36% of total professionally managed assets.
1.3 ESG Investment Strategies
Negative Screening: Avoiding investments in sectors such as tobacco, fossil fuels, weapons, or companies with poor labor practices.
Positive Screening: Selecting companies with best-in-class ESG performance, e.g., renewable energy companies or firms with exemplary governance practices.
Thematic Investing: Focusing on specific sustainability themes like clean energy, water management, or gender equality.
Impact Investing: Targeting investments that generate measurable social or environmental impact in addition to financial returns.
ESG Integration: Incorporating ESG factors into traditional financial analysis to enhance risk-adjusted returns.
1.4 Benefits of ESG Investing
Risk Mitigation: ESG-focused companies are less prone to environmental liabilities, regulatory penalties, and reputational damage.
Long-term Value Creation: Sustainable practices often translate into operational efficiency, customer loyalty, and innovation.
Enhanced Portfolio Diversification: ESG investments may have lower correlations with traditional financial markets.
Alignment with Values: Investors can support ethical and sustainable business practices.
1.5 Challenges in ESG Investing
Data Inconsistency: ESG reporting standards vary across regions and companies, making comparisons difficult.
Greenwashing: Companies may exaggerate their ESG efforts to attract investment without meaningful impact.
Financial Trade-offs: Some ESG investments may underperform in the short term due to higher costs or niche markets.
Measurement Complexity: Quantifying social and governance impact is often subjective.
2. Carbon Credit Trading: An Overview
2.1 Definition and Concept
Carbon credit trading is a market-based mechanism aimed at reducing global carbon emissions. It operates under the principle of cap-and-trade, where a regulatory authority sets a limit (cap) on the total greenhouse gas emissions allowed for companies or sectors. Entities are issued carbon credits representing the right to emit one metric ton of CO2 or equivalent greenhouse gases.
If a company emits less than its allocated credits, it can sell the surplus in the carbon market. Conversely, companies that exceed their limits must purchase additional credits or face penalties. This creates a financial incentive to reduce emissions efficiently.
2.2 Historical Context
Carbon trading emerged from global climate agreements:
Kyoto Protocol (1997): Introduced the Clean Development Mechanism (CDM), allowing emission reductions to be traded internationally.
European Union Emission Trading Scheme (EU ETS, 2005): The first major regional carbon market, setting a benchmark for emissions trading globally.
Paris Agreement (2015): Reinforced carbon markets under Article 6, encouraging countries to collaborate in emission reductions.
2.3 Types of Carbon Credits
Compliance Credits: Issued under government-regulated cap-and-trade programs.
Voluntary Carbon Credits: Bought by companies or individuals to offset emissions voluntarily, often through projects like reforestation, renewable energy, or methane capture.
2.4 Mechanism of Carbon Trading
Cap Setting: Authorities determine the total allowable emissions for sectors or companies.
Credit Allocation: Companies receive carbon credits based on past emissions or regulatory quotas.
Trading: Companies can buy or sell credits depending on their actual emissions relative to their cap.
Verification: Third-party audits ensure reported emissions reductions are accurate and credible.
2.5 Market Participants
Corporations: Major emitters such as power plants, airlines, and industrial manufacturers.
Brokers and Traders: Facilitate buying and selling of carbon credits.
Governments and Regulatory Bodies: Establish rules, issue credits, and monitor compliance.
Environmental Projects: Generate carbon credits by implementing emission-reducing projects.
3. Integration of ESG Investing and Carbon Credit Trading
3.1 ESG and Carbon Markets Synergy
ESG investing and carbon credit trading are inherently linked, particularly through the environmental component. Companies with robust ESG strategies often engage in carbon credit trading to:
Offset unavoidable emissions.
Demonstrate commitment to climate targets.
Improve sustainability credentials for investors.
Investors increasingly assess carbon strategies as part of ESG due diligence. Companies actively participating in carbon markets may be more attractive for ESG-focused portfolios, aligning financial performance with sustainability outcomes.
3.2 Financial Implications
Hedging Climate Risk: By investing in companies that trade carbon credits or adopt low-carbon practices, investors reduce exposure to regulatory or reputational risks.
Revenue Generation: Selling surplus carbon credits provides an additional income stream.
Valuation Impact: Firms with effective carbon management often enjoy higher valuations and lower cost of capital.
3.3 Case Examples
Microsoft: Pledged to become carbon negative by 2030, investing in carbon credits and renewable projects.
Tesla: Generates revenue by selling regulatory carbon credits to other automakers.
BP and Shell: Invest in carbon offset projects to complement ESG commitments and mitigate emissions.
4. Global Trends in ESG and Carbon Markets
4.1 Rising Investor Awareness
ESG investment products, including mutual funds, ETFs, and green bonds, are growing rapidly.
Millennials and Gen Z investors prioritize sustainability, influencing capital flows.
4.2 Regulatory Push
The EU, UK, and US are tightening ESG disclosure requirements.
Mandatory reporting on Scope 1, 2, and 3 emissions enhances transparency and accountability.
4.3 Technological Innovations
Blockchain and digital registries improve the traceability of carbon credits.
Artificial intelligence helps analyze ESG data and monitor compliance.
4.4 Market Growth
The global voluntary carbon market is expected to exceed $50 billion by 2030.
ESG assets under management are projected to surpass $50 trillion by 2025, highlighting a long-term trend toward sustainability-focused finance.
5. Challenges and Criticisms
5.1 ESG Investing Challenges
Subjectivity: ESG ratings vary across agencies, leading to inconsistent assessments.
Greenwashing Risk: Companies may overstate sustainability achievements to attract capital.
Limited Impact: Some ESG investments may not translate into measurable environmental or social improvements.
5.2 Carbon Credit Trading Challenges
Verification Complexity: Ensuring credits correspond to real emission reductions is challenging.
Market Volatility: Carbon prices fluctuate due to regulatory changes or market sentiment.
Ethical Concerns: Over-reliance on offsets can allow continued emissions instead of driving systemic change.
6. Future Outlook
6.1 ESG Investing
ESG integration will become standard practice for asset managers and institutional investors.
Enhanced global ESG reporting standards, such as the International Sustainability Standards Board (ISSB), will improve transparency.
6.2 Carbon Credit Trading
Expansion of voluntary and compliance markets is expected, particularly in Asia-Pacific.
Innovations like nature-based carbon credits and digital carbon registries will enhance credibility and efficiency.
Carbon pricing may become more widespread, influencing corporate strategy and investment decisions.
6.3 Combined Impact
The synergy between ESG investing and carbon credit trading can accelerate the transition to a low-carbon economy. Financial markets will increasingly reward companies that embed sustainability into strategy and operations, making environmental stewardship a core value driver.
Conclusion
ESG investing and carbon credit trading represent transformative trends in global finance, emphasizing the integration of sustainability into investment decisions. ESG investing aligns financial returns with environmental and social responsibility, while carbon credit trading provides a market-driven mechanism for reducing greenhouse gas emissions. Both are critical tools in addressing climate change, promoting corporate accountability, and meeting the growing demand for sustainable investments.
Despite challenges such as data inconsistency, greenwashing, and verification complexities, the long-term outlook remains positive. As regulatory frameworks strengthen, technology improves, and investor awareness rises, ESG investing and carbon credit markets are poised to redefine the role of finance in building a sustainable, resilient global economy.
The interconnection of ESG and carbon trading illustrates a broader shift: capital is no longer just a means of generating profit; it is a lever for societal and environmental impact. Investors, corporations, and policymakers who embrace this integrated approach will shape the future of finance and the health of the planet.

Divergence SecretsThere are two main types of options: Call Options and Put Options.
A Call Option gives the buyer the right to buy an asset at a predetermined price, called the strike price, before the expiry date. Investors buy calls when they expect the price of the underlying asset to rise.
A Put Option, on the other hand, gives the buyer the right to sell an asset at the strike price before expiry. Traders buy puts when they expect the asset’s price to fall.

Part 2 Support and ResistanceAdvantages of Option Trading
a. Leverage:
Options allow traders to control large positions with small capital. Buying one option contract often represents 100 shares, meaning traders can gain significant exposure at a fraction of the cost.
b. Flexibility:
Options can be used for speculation, hedging, or income generation.
c. Limited Risk for Buyers:
When you buy options, your maximum loss is limited to the premium paid.
d. Hedging Tool:
Investors can use options to protect their portfolios from downside risk — for instance, buying a put option as insurance against a market fall.

Part 1 Support and Resistance Option Pricing – The Greeks
Option pricing is influenced by several factors such as the underlying price, time to expiry, volatility, and interest rates. These factors are represented by “Greeks,” which measure the sensitivity of an option’s price to different variables:
Delta (Δ): Measures how much the option price changes with a ₹1 move in the underlying asset.
Gamma (Γ): Measures the rate of change of Delta — i.e., how stable Delta is.
Theta (Θ): Measures time decay — how much value the option loses each day as expiry nears.
Vega (ν): Measures sensitivity to volatility — how much the option price changes with changes in market volatility.
Rho (ρ): Measures sensitivity to interest rates.
Understanding these helps traders build strategies that match their risk tolerance and market view.

Option Trading Participants in Option Trading
There are generally four types of participants in the options market:
Buyers of Calls: Expect the price of the underlying to go up.
Sellers (Writers) of Calls: Expect the price to remain the same or fall.
Buyers of Puts: Expect the price of the underlying to go down.
Sellers (Writers) of Puts: Expect the price to remain the same or rise.
Buyers have limited risk (the premium paid) and unlimited profit potential, while sellers have limited profit (premium received) but unlimited potential risk.

Part 1 Candle Stick PatternKey Terminology in Options
Before diving deeper, understanding these basic terms is essential:
Strike Price: The price at which the option can be exercised.
Premium: The price paid by the buyer to purchase the option.
Expiry Date: The date on which the option contract ends.
In the Money (ITM): When exercising the option gives a profit (e.g., a call option when the stock price is above the strike price).
Out of the Money (OTM): When exercising the option gives a loss (e.g., a call option when the stock price is below the strike price).
At the Money (ATM): When the stock price and strike price are almost the same.
Underlying Asset: The financial instrument (like a stock, index, or currency) on which the option is based.

PCR Trading Strategies What is an Option?
An option is a financial contract that gives the buyer the right, but not the obligation, to buy or sell an underlying asset (such as a stock or index) at a specific price (called the strike price) before or on a certain date (called the expiry date).
There are two main types of options:
Call Option: Gives the holder the right to buy the asset.
Put Option: Gives the holder the right to sell the asset.
The person who sells (writes) the option has the obligation to fulfill the contract if the buyer chooses to exercise it.

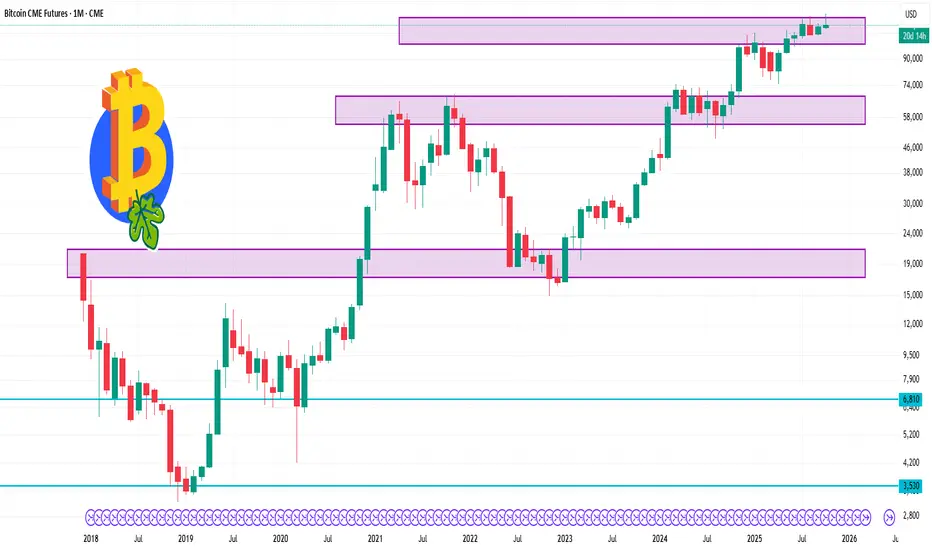
Bitcoin 1 Month Time frame 📊 1-Month Price Range
High: $123,270
Low: $113,150
Current: $116,990
52-Week Range: $59,990 – $127,240
🔍 Technical Overview
The 1-month technical analysis for BTC.1 indicates a neutral market sentiment, with no strong buy or sell signals.
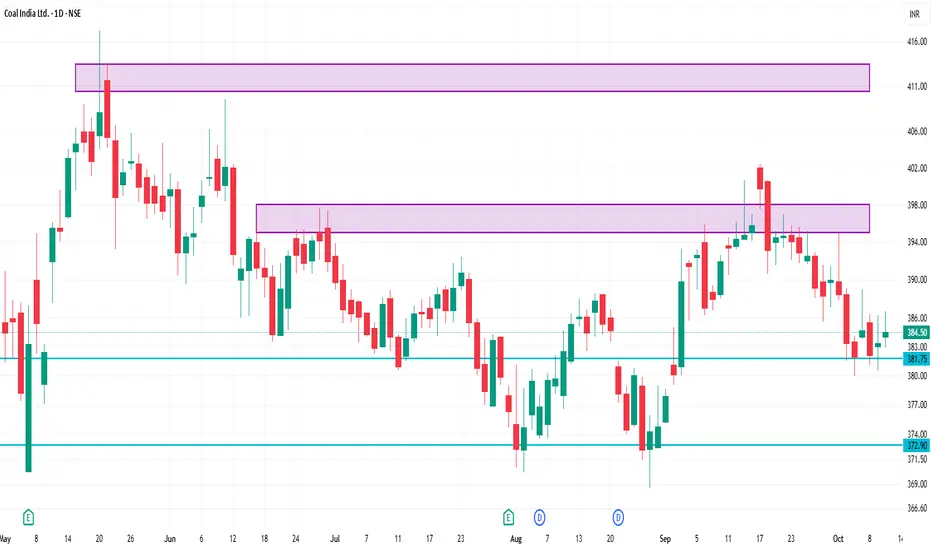
COALINDIA 1 Day Time Frame 📊 Key Intraday Levels
Support Levels: ₹382.95 – ₹383.35
Resistance Levels: ₹386.70 – ₹387.85
Day Range: ₹382.95 – ₹386.70
Previous Close: ₹383.35
Upper Circuit Limit: ₹421.65
Lower Circuit Limit: ₹345.05
52-Week Range: ₹349.25 – ₹502.45
🔍 Technical Indicators
Pivot Points: Central Pivot at ₹389.17, with resistance at ₹391.20 and support at ₹388.55.
Candlestick Patterns: Recent sessions have shown patterns like Harami Bullish and Doji, indicating indecision and possible reversal attempts.
Relative Strength Index (RSI): The 14-day RSI is at 48.52, suggesting a neutral market condition.
📈 Summary
Coal India Ltd is currently trading near its support level of ₹383.35. A breakout above ₹387.85 could signal a bullish trend, while a decline below ₹382.95 may indicate a bearish move. Technical indicators suggest a neutral market condition, with recent candlestick patterns indicating indecision and possible reversal attempts.
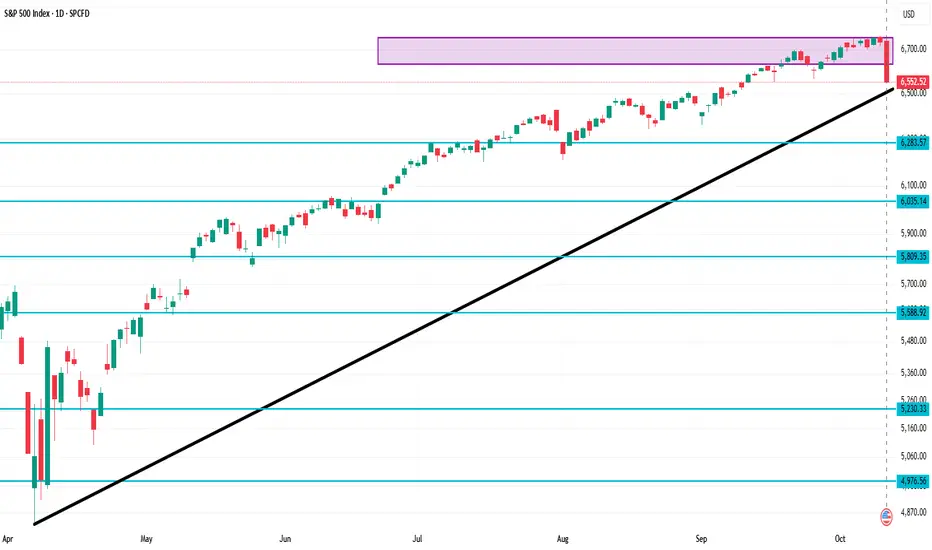
SPX 1 Day Time Frame Earlier today, the index opened at 6,740.49 USD, with a daily high of 6,762.40 USD and a low of 6,550.78 USD.
Key Metrics:
Opening Price: 6,740.49 USD
Day's Range: 6,550.78 – 6,762.40 USD
52-Week Range: 4,835.04 – 6,764.58 USD
Previous Close: 6,735.11 USD
Change: -182.6 USD
% Change: -2.71%
This downturn follows President Trump's recent threats of "massive" tariffs on China, marking the largest single-day loss for the S&P 500 since April 2025.
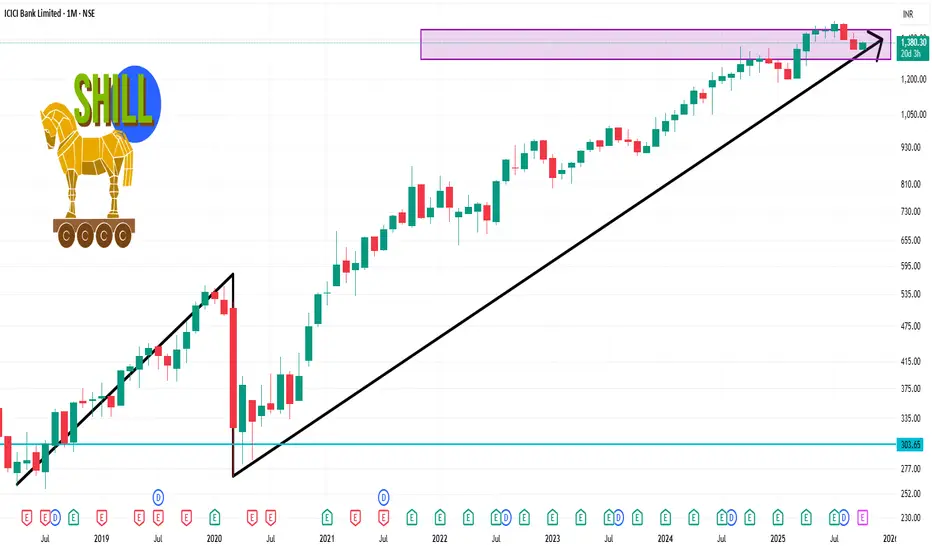
ICICIBANK 1 Month Time Frame 📊 Monthly Technical Levels
Pivot Point: ₹1,374.47
Support Levels:
S1: ₹1,316.13
S2: ₹1,284.27
S3: ₹1,225.93
Resistance Levels:
R1: ₹1,406.33
R2: ₹1,464.67
R3: ₹1,496.53
These levels are derived from standard pivot point calculations and can serve as key reference points for traders.
🔍 Technical Indicators
Relative Strength Index (RSI): Currently at 46.06, indicating a neutral condition, suggesting no immediate overbought or oversold conditions.
Moving Averages: The stock is showing a buy signal across various moving averages, with 8 buy signals and 4 sell signals, suggesting a bullish trend.
Technical Indicators: A strong buy signal is observed, with 10 buy signals and no sell signals, indicating positive momentum.
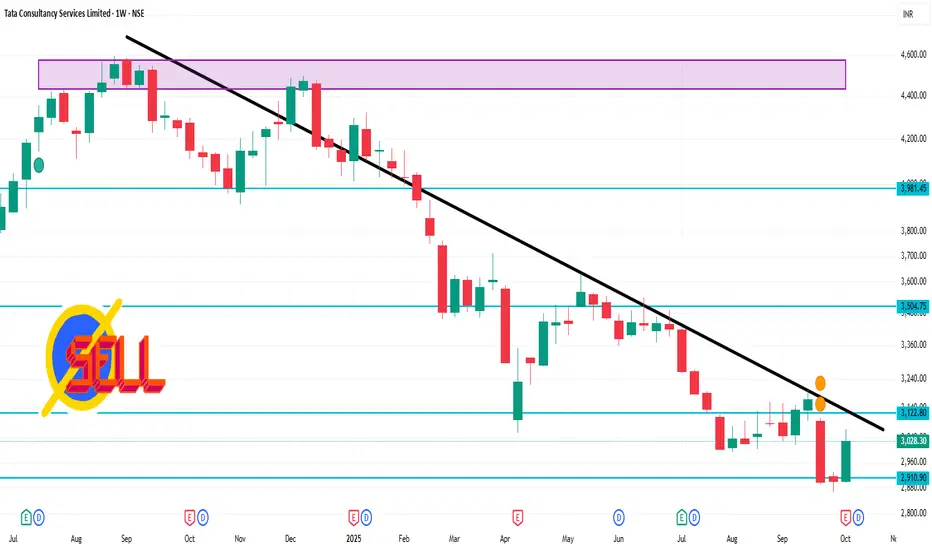
TCS 1 Week Time Frame Weekly Technical Overview
Current Price: ₹3,028.30 on the NSE
52-Week Range: ₹2,866.60 – ₹4,494.90
Volume: Approximately 8.8 million shares traded this week
VWAP: ₹3,032.15
Market Cap: ₹1.095 trillion
Beta: 0.97 (indicating moderate volatility
🔍 Key Technical Indicators
Moving Averages: TCS is trading below its 200-day moving average, suggesting a bearish trend.
RSI: The Relative Strength Index is in the neutral zone, indicating balanced buying and selling pressures.
MACD: The Moving Average Convergence Divergence is showing a bearish crossover, which may signal a potential downward movement.
📈 Outlook
Support Levels: Immediate support is observed around ₹2,950, with a stronger support zone near ₹2,870.
Resistance Levels: Key resistance is at ₹3,100, followed by ₹3,200.
Volatility: The stock's beta of 0.97 suggests that it moves in line with the broader market, with moderate volatility.
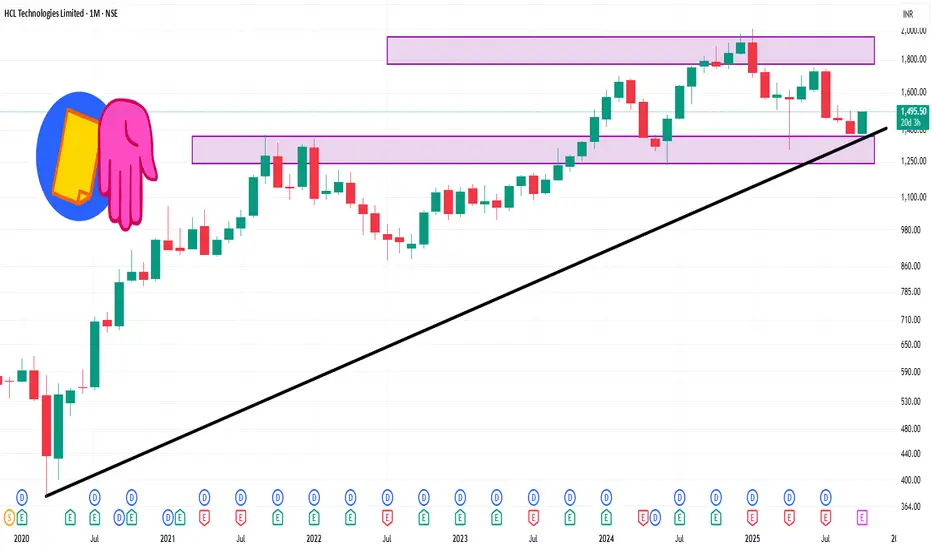
HCLTECH 1 Month Time Frame 📈 1-Month Performance Overview
Current Price: ₹1,495.50
1-Month Change: +4.19%
52-Week Range: ₹1,302.75 – ₹2,012.20
Market Capitalization: ₹4,05,612 crore
P/E Ratio (TTM): 23.88
Dividend Yield: 4.02%
Over the past month, HCL Technologies has shown a steady upward trend, outperforming the Nifty IT Index, which has gained approximately 0.33% during the same period.
📊 Technical Snapshot
1-Month High: ₹1,502.90
1-Month Low: ₹1,380.40
Average Price: ₹1,443.09
Price Change: +2.16%
NAFL 1 Day Time Frame 🚩 Key Price & Range Data
Current / recent close: ₹ 4,741.10
Today’s range: ₹ 4,569.10 – ₹ 4,761.60
52-week range: ₹ 3,180 (low) to ₹ 5,444 (high)
📊 Technicals & Signals (Daily Timeframe)
On Investing.com, the stock shows a Strong Sell signal on the daily timeframe (0 buy, 7 sell).
Moving averages (MA5 up to MA200) predominantly signal Sell.
Pivot / support / resistance levels (classic / Fibonacci) for daily:
- Pivot: ~ ₹ 4,570.90
- Supports: ~ ₹ 4,516.70, ~ ₹ 4,530.80 (S2, S3)
- Resistances: ~ ₹ 4,596.90, ~ ₹ 4,611.00, ~ ₹ 4,637.00 (R1-R3)
According to StockInvest.us:
- Short-term support around ₹ 4,623.17
- Resistance near ₹ 4,749.37
Fibonacci support/resistance levels:
- R1 ~ ₹ 4,764.14, R2 ~ ₹ 4,809.57, R3 ~ ₹ 4,883.10
- S1 ~ ₹ 4,617.07, S2 ~ ₹ 4,571.64, S3 ~ ₹ 4,498.10
Volume accumulation support at ~ ₹ 4,687.50

Algorithmic Trading in India1. Introduction to Algorithmic Trading
Algorithmic trading refers to the use of computer algorithms to automate the process of trading financial securities — such as stocks, derivatives, commodities, or currencies — based on predefined rules and market conditions. These algorithms analyze market data, identify trading opportunities, and execute buy or sell orders with minimal human intervention.
At its core, algorithmic trading combines finance, mathematics, and computer science to create intelligent trading systems that can process information and act faster than any human trader. These systems follow strict quantitative models to determine the timing, price, and volume of trades to achieve optimal results.
In India, algorithmic trading gained popularity after the National Stock Exchange (NSE) introduced Direct Market Access (DMA) in 2008, allowing institutional investors to place orders directly into the market using automated systems. Over time, the technology has become more sophisticated, enabling both institutional and retail participation.
2. Evolution of Algorithmic Trading in India
The evolution of algo trading in India can be divided into distinct phases:
a. Pre-2000: Manual Trading Era
Before 2000, most trades were executed manually on the exchange floor. Brokers used phone calls and physical slips to place orders. This process was time-consuming, error-prone, and inefficient.
b. 2000–2010: Electronic Trading Emerges
With the digital transformation of the NSE and BSE, electronic order matching systems replaced the open outcry method. By 2008, the introduction of DMA and co-location facilities laid the foundation for algorithmic and high-frequency trading (HFT).
c. 2010–2020: Rise of Quantitative Strategies
Institutional investors and hedge funds started employing quantitative trading models to gain an edge in execution and strategy. The Securities and Exchange Board of India (SEBI) also began formulating guidelines to regulate algorithmic trading practices, ensuring fairness and transparency.
d. 2020–Present: Democratization and Retail Adoption
With advancements in technology, lower computing costs, and the rise of retail trading platforms (like Zerodha, Upstox, and Dhan), algorithmic trading tools have become accessible to individual investors. Today, APIs, Python-based strategies, and machine learning models are widely used by Indian traders to automate their trades.
3. How Algorithmic Trading Works
Algorithmic trading operates through a systematic process involving data analysis, model development, order execution, and monitoring. Here’s a simplified overview:
Market Data Collection:
Algorithms collect large volumes of market data in real time, including price, volume, and volatility metrics.
Signal Generation:
Based on mathematical models and indicators, the algorithm identifies trading opportunities. For example, if a moving average crossover occurs, it may trigger a buy signal.
Order Execution:
Once a signal is generated, the algorithm places orders automatically through an API or exchange gateway.
Risk Management:
Algorithms include predefined risk controls like stop losses, position sizing, and exposure limits to prevent large losses.
Backtesting and Optimization:
Before deployment, strategies are tested on historical data to validate performance under various market conditions.
Live Monitoring:
After implementation, algorithms are continuously monitored for slippage, latency, and performance.
4. Regulatory Framework in India
The Securities and Exchange Board of India (SEBI) regulates algorithmic trading to maintain market integrity and prevent unfair practices. Some key regulations include:
Exchange Approval:
Brokers and firms must obtain exchange approval for deploying algorithmic strategies.
Order-to-Trade Ratio:
To prevent market overload, SEBI has imposed limits on the ratio of orders to actual trades.
Risk Controls:
Mandatory controls such as price band checks, quantity limits, and self-trade prevention are required.
Co-location and Latency Equalization:
Exchanges provide co-location facilities (servers near exchange data centers) to minimize latency, though SEBI monitors for potential unfair advantages.
Audit Trail:
All algorithmic trades must have complete audit trails for transparency and accountability.
Retail Algorithmic Trading Guidelines (2022):
SEBI recently proposed a framework for retail algo trading via APIs, ensuring that brokers vet and approve algorithms before deployment.
This regulatory vigilance has allowed India to balance innovation with investor protection.
5. Benefits of Algorithmic Trading
Algorithmic trading has numerous advantages over manual methods:
a. Speed and Efficiency
Algorithms can analyze and execute thousands of trades in milliseconds, far faster than any human could.
b. Elimination of Emotion
By following pre-coded rules, algo systems eliminate emotional biases such as fear and greed, leading to disciplined trading.
c. Lower Transaction Costs
Automation reduces manual intervention, improving execution quality and minimizing brokerage costs.
d. Improved Liquidity
With higher trading volumes and tighter spreads, liquidity in the markets improves, benefiting all participants.
e. Enhanced Risk Management
Predefined risk parameters ensure controlled exposure and prevent large drawdowns.
f. Consistent Strategy Execution
Algorithms ensure consistent and accurate execution of strategies without deviation due to human fatigue or emotion.
6. Popular Algorithmic Trading Strategies in India
Several quantitative strategies are commonly deployed by Indian traders and institutions:
a. Trend-Following Strategies
These rely on indicators like Moving Averages, MACD, and RSI to identify momentum and follow the direction of the market trend.
b. Mean Reversion Strategies
These assume that prices will revert to their mean over time. Bollinger Bands and RSI divergence are typical indicators used.
c. Arbitrage Strategies
Exploiting price differences across exchanges or instruments, such as cash-futures arbitrage or inter-exchange arbitrage, to generate risk-free profits.
d. Statistical Arbitrage
Uses complex mathematical models to identify mispriced securities in correlated pairs or baskets.
e. Market Making
Involves placing simultaneous buy and sell orders to profit from the bid-ask spread while providing liquidity.
f. News-Based or Event-Driven Trading
Algorithms use NLP (Natural Language Processing) to interpret news or social sentiment and execute trades based on real-time events.
g. High-Frequency Trading (HFT)
Involves ultra-fast order execution and minimal holding times to exploit micro price movements, typically used by institutions.
7. Technologies Behind Algorithmic Trading
Algorithmic trading relies on an integration of cutting-edge technologies:
Programming Languages:
Python, C++, Java, and R are widely used for coding strategies and handling data.
APIs and Market Data Feeds:
APIs like Zerodha Kite Connect, Upstox API, and Interactive Brokers API allow real-time market access.
Machine Learning & AI:
Predictive models using neural networks, regression, and reinforcement learning enhance decision-making accuracy.
Cloud Computing:
Cloud-based deployment enables low-latency processing and scalability.
Big Data Analytics:
Helps in analyzing terabytes of market and sentiment data for pattern recognition.
Blockchain Integration (Emerging):
Enhances transparency and security in trade settlements.
8. Challenges and Risks in Algorithmic Trading
Despite its advantages, algorithmic trading comes with its share of risks:
a. Technical Failures
System glitches or connectivity issues can lead to massive losses in seconds.
b. Overfitting
Strategies that perform well on historical data may fail in real markets due to over-optimization.
c. Latency Issues
Even microseconds of delay can make or break an HFT strategy.
d. Market Manipulation Risks
Flash crashes or spoofing (placing fake orders) can disrupt markets.
e. High Costs for Infrastructure
Co-location servers and data feeds can be expensive for smaller firms.
f. Regulatory Complexity
Constantly evolving SEBI regulations require compliance and technical audits, adding to operational overhead.
9. Retail Participation and the Rise of DIY Algo Trading
One of the most exciting developments in India’s market landscape is the growing retail participation in algorithmic trading.
Platforms like Streak, AlgoTest, Tradetron, and Dhan Algo Lab have simplified algo development for individual traders by providing drag-and-drop interfaces, backtesting tools, and prebuilt strategies.
Retail traders can now:
Build and deploy algos without coding.
Use Python notebooks to design custom strategies.
Access historical market data for analysis.
Automate trades through broker APIs.
This democratization of technology is reshaping the retail trading landscape, allowing individuals to compete in efficiency with institutional players.
10. The Future of Algorithmic Trading in India
The future of algorithmic trading in India looks highly promising. Several trends are shaping its trajectory:
a. Artificial Intelligence Integration
AI-powered systems will increasingly predict market behavior, making trading smarter and adaptive.
b. Quantum Computing
The potential for near-instantaneous computation could revolutionize complex trading models.
c. Blockchain-Based Settlements
Blockchain could bring greater efficiency and transparency to clearing and settlement processes.
d. Wider Retail Access
As costs decrease and regulations evolve, retail traders will gain greater access to institutional-grade tools.
e. Cross-Market Integration
Algo systems will expand to commodities, currency markets, and international exchanges, creating a unified global trading environment.
f. Regulatory Innovation
SEBI’s proactive approach ensures that the market remains transparent and competitive, promoting sustainable growth.
11. Conclusion
Algorithmic trading represents the future of financial markets in India. What began as a niche practice among institutional investors has now become a mainstream phenomenon, empowering traders with data-driven precision and unmatched efficiency.
With strong regulatory oversight, robust technological infrastructure, and increasing retail adoption, India’s algorithmic trading ecosystem is poised for exponential growth. However, traders must approach automation with responsibility — focusing on robust strategy design, risk management, and compliance.
In essence, algorithmic trading in India symbolizes a perfect blend of technology and finance, paving the way for smarter, faster, and more efficient markets — where innovation meets opportunity.
Master Technical Indicators1. Understanding Technical Indicators
A technical indicator is a mathematical calculation based on price, volume, or open interest of a security or asset. Indicators are plotted on charts to help traders visualize trends, reversals, and potential entry or exit points.
Traders use these indicators to simplify the complexity of raw price data. Rather than analyzing each candle or tick, indicators smooth out noise and highlight the underlying strength or weakness of a trend. They are particularly effective when used alongside chart patterns, price action, and market sentiment analysis.
Why Are Technical Indicators Important?
They help identify the direction of a trend (up, down, or sideways).
They signal potential entry and exit points.
They assist in determining market strength and volatility.
They provide confirmation for trade setups.
They help in risk management by defining stop-loss and target zones.
2. Types of Technical Indicators
Technical indicators are generally classified into four main categories:
a. Trend Indicators
These show the direction and strength of a market trend.
Examples: Moving Averages, MACD, Average Directional Index (ADX), Parabolic SAR.
b. Momentum Indicators
These measure the speed of price movements, helping traders spot overbought or oversold conditions.
Examples: RSI, Stochastic Oscillator, CCI, Momentum Indicator.
c. Volatility Indicators
They measure the rate of price change or fluctuations, showing how much an asset moves over a specific time period.
Examples: Bollinger Bands, ATR (Average True Range), Donchian Channels.
d. Volume Indicators
Volume-based indicators analyze the strength behind price movements, helping traders confirm trends or reversals.
Examples: On-Balance Volume (OBV), Volume Oscillator, Chaikin Money Flow (CMF).
3. Top Technical Indicators Every Trader Should Master
Let’s dive deep into the most powerful and widely used technical indicators.
a. Moving Averages (MA)
The Moving Average is one of the simplest yet most powerful tools in technical analysis. It smooths price data to identify the direction of the trend.
Types:
Simple Moving Average (SMA) – Calculates the average price over a specific period.
Exponential Moving Average (EMA) – Gives more weight to recent prices, making it more responsive.
How Traders Use It:
Trend Identification:
When price is above the moving average, it indicates an uptrend; below it indicates a downtrend.
Crossovers:
Golden Cross: When the short-term MA crosses above the long-term MA (bullish signal).
Death Cross: When the short-term MA crosses below the long-term MA (bearish signal).
Dynamic Support & Resistance:
MAs often act as support or resistance zones.
Popular Settings:
50-day and 200-day MAs for long-term trends, 9-day and 21-day EMAs for short-term trading.
b. Relative Strength Index (RSI)
Developed by J. Welles Wilder, the RSI measures the magnitude of recent price changes to determine overbought or oversold conditions.
Formula:
RSI = 100 – ,
where RS = Average Gain / Average Loss.
Interpretation:
RSI above 70: Overbought zone (potential sell signal).
RSI below 30: Oversold zone (potential buy signal).
RSI between 40–60: Neutral or consolidation phase.
Pro Tips:
Watch for divergences (price makes a new high, but RSI does not). This often signals a reversal.
RSI can also act as trend confirmation when it stays above 50 (bullish) or below 50 (bearish).
c. Moving Average Convergence Divergence (MACD)
The MACD is a powerful trend-following momentum indicator. It shows the relationship between two EMAs (typically 12-day and 26-day).
Components:
MACD Line: 12-day EMA – 26-day EMA.
Signal Line: 9-day EMA of MACD line.
Histogram: Difference between MACD and Signal line.
How to Use:
Crossover Signals:
Bullish when MACD line crosses above the Signal line.
Bearish when it crosses below.
Zero Line Cross:
When MACD crosses above zero → bullish momentum.
When MACD crosses below zero → bearish momentum.
Divergences:
If price makes new highs while MACD fails to, it signals a weakening trend.
d. Bollinger Bands
Developed by John Bollinger, these bands measure volatility using standard deviations around a moving average.
Structure:
Middle Band: 20-day SMA.
Upper Band: SMA + 2 standard deviations.
Lower Band: SMA – 2 standard deviations.
How to Interpret:
Squeeze: When bands contract, it indicates low volatility and possible breakout soon.
Expansion: When bands widen, it shows high volatility.
Touch of Upper/Lower Band:
Price touching the upper band signals overbought.
Touching the lower band signals oversold.
Pro Tip: Combine Bollinger Bands with RSI or MACD for confirmation.
e. Average Directional Index (ADX)
The ADX, created by Wilder, measures the strength of a trend — not its direction.
Scale:
0–25: Weak or no trend.
25–50: Strong trend.
50–75: Very strong trend.
75–100: Extremely strong trend.
Usage:
A rising ADX indicates strengthening trend momentum.
A falling ADX indicates weakening momentum.
Traders often combine ADX with +DI and -DI lines to detect whether bulls or bears are in control.
f. Stochastic Oscillator
This momentum indicator compares the closing price of an asset to its price range over a set period (usually 14 days).
Formula:
%K = × 100
%D = 3-day SMA of %K.
Interpretation:
Above 80: Overbought.
Below 20: Oversold.
Crossovers between %K and %D lines indicate potential reversals.
Pro Tip: Use with trend direction to avoid false signals — only buy oversold signals in an uptrend and sell overbought signals in a downtrend.
g. Average True Range (ATR)
The ATR measures market volatility by calculating the average range between high and low prices over a given period.
Usage:
Higher ATR: Indicates more volatility (use wider stop-losses).
Lower ATR: Indicates less volatility (use tighter stop-losses).
It helps traders adjust position sizing and risk management strategies.
h. On-Balance Volume (OBV)
The OBV indicator links price movement with volume to measure buying and selling pressure.
Formula:
If today’s close > yesterday’s close → OBV = Previous OBV + Volume.
If today’s close < yesterday’s close → OBV = Previous OBV – Volume.
Interpretation:
Rising OBV confirms upward momentum (buying pressure).
Falling OBV confirms downward momentum (selling pressure).
Divergences between OBV and price can signal reversals.
4. Combining Indicators for Better Accuracy
No single indicator is perfect. The best traders combine multiple indicators to create a confluence of signals that increase trade accuracy.
Popular Combinations:
Trend + Momentum: Moving Average + RSI or MACD.
Volatility + Momentum: Bollinger Bands + Stochastic.
Volume + Trend: OBV + Moving Average.
For example, a trader might go long when:
The price is above the 50-day EMA (uptrend).
RSI crosses above 40 from oversold levels.
OBV is rising — confirming strong buying interest.
5. Common Mistakes Traders Make
Even the best indicators can mislead when misused. Here are some common pitfalls:
Overloading charts with too many indicators:
This creates confusion and conflicting signals.
Ignoring price action:
Indicators should confirm, not replace, price structure analysis.
Using the same type of indicators together:
Combining multiple momentum indicators (like RSI and Stochastic) adds redundancy.
Not adjusting settings:
Default settings may not suit every market; fine-tune them to your asset and time frame.
Trading without confirmation:
Always wait for indicator alignment before entering a trade.
6. Building a Strategy Using Technical Indicators
A robust trading strategy built around indicators should include:
Market Trend Filter:
(e.g., 50 EMA or ADX to determine direction)
Entry Signal:
(e.g., RSI crossing above 30 or MACD bullish crossover)
Exit Signal:
(e.g., RSI reaching overbought or MACD turning bearish)
Stop-Loss and Take-Profit Rules:
(e.g., ATR-based stop-loss for volatility adjustment)
Risk Management:
Risk only 1–2% of capital per trade.
By backtesting your strategy on historical data, you can evaluate its accuracy and profitability.
7. Adapting Indicators for Different Markets
Each market behaves differently. For instance:
Stocks: Indicators like RSI, MACD, and OBV work best due to volume data.
Forex: Moving Averages, ADX, and Bollinger Bands help identify trends in volatile environments.
Crypto: Volatility-based indicators (ATR, Bollinger Bands) are more effective because of rapid price swings.
Adjust your settings and time frames accordingly:
Short-term traders (scalpers/day traders) → 1-min to 15-min charts.
Swing traders → 1-hour to daily charts.
Long-term investors → weekly/monthly charts.
8. The Psychology Behind Indicators
Technical indicators ultimately reflect trader psychology.
When RSI is overbought, it shows euphoria and overconfidence.
When moving averages flatten, it reflects indecision.
High ATR reflects fear and panic; low ATR reflects calmness.
Understanding this emotional rhythm helps traders align technical signals with real-world behavior — the essence of market sentiment analysis.
9. Future of Technical Indicators
With advancements in AI and algorithmic trading, indicators are becoming more adaptive. Machine learning models can now optimize indicator parameters dynamically, improving accuracy. However, human intuition still plays a key role — especially in interpreting false signals and reading macroeconomic trends.
Conclusion
Mastering technical indicators is not about memorizing dozens of formulas; it’s about understanding the story they tell about price, volume, and emotion. The best traders use a balanced approach — combining trend, momentum, volume, and volatility indicators — to develop high-probability trading setups.
To truly master them:
Keep your chart simple.
Focus on 2–3 core indicators.
Always confirm signals with price action.
Backtest your strategy before applying it live.
When used with discipline, patience, and proper risk management, technical indicators can become your guiding compass in the ever-changing ocean of financial markets.
Impact of US Federal Reserve Interest Rate on the Indian EconomyIntroduction
The United States Federal Reserve (commonly known as the Fed) plays a central role in shaping global monetary policy. As the world’s most influential central bank, the Fed’s decisions on interest rates have a ripple effect across global financial markets, influencing currencies, stock markets, trade flows, inflation, and investment decisions worldwide. For emerging economies like India, the impact of US Fed rate changes is particularly significant.
India, being a major developing economy with increasing integration into global markets, is deeply influenced by the movements of the US dollar, capital flows, and investor sentiment — all of which are affected by Fed policies. This relationship underscores how a rate hike or cut by the Fed can either strengthen or strain India’s financial stability, economic growth, and trade balance.
This essay explores how the US Federal Reserve’s interest rate policies affect the Indian economy in multiple dimensions — including the exchange rate, capital markets, inflation, foreign investments, trade, and monetary policy alignment — while also discussing historical trends, recent developments, and possible future scenarios.
Understanding the US Federal Reserve and Its Policy Decisions
The US Federal Reserve determines monetary policy primarily through three tools:
Federal Funds Rate: The benchmark interest rate at which banks lend to each other overnight.
Open Market Operations: Buying or selling government securities to control liquidity.
Reserve Requirements: The portion of deposits that banks must hold as reserves.
When the Fed raises interest rates, it aims to control inflation by making borrowing costlier, reducing consumption and investment in the US economy. Conversely, when it lowers rates, it stimulates economic growth by making credit cheaper.
However, since the US dollar is the world’s dominant reserve currency and global trade is largely denominated in dollars, these decisions extend far beyond the US borders. Emerging markets like India feel the heat (or benefit) almost immediately through movements in capital flows, exchange rates, and commodity prices.
Mechanism of Transmission to the Indian Economy
The Fed’s rate changes affect India through several interconnected channels:
Capital Flows:
Higher US interest rates attract investors to shift funds from emerging markets to the US for better returns. This leads to capital outflows from India, putting pressure on the rupee and Indian financial markets.
Exchange Rate Movements:
As foreign investors withdraw funds, the Indian Rupee (INR) tends to depreciate against the US Dollar (USD). This increases the cost of imports and can worsen India’s trade deficit.
Commodity Prices:
A stronger dollar generally leads to a decline in global commodity prices (such as oil and metals), which can both benefit and hurt India depending on the price elasticity and sectoral dependencies.
Inflationary Impact:
A weaker rupee makes imported goods (especially crude oil) more expensive, contributing to imported inflation.
Stock Market Reactions:
Rate hikes in the US often trigger foreign institutional investors (FIIs) to sell equities in emerging markets. This can cause short-term corrections or volatility in Indian markets.
Monetary Policy Coordination:
The Reserve Bank of India (RBI) often aligns its monetary stance with global trends to maintain stability. If the Fed tightens, the RBI may follow suit to prevent excessive capital flight.
Historical Perspective: Fed Rate Movements and India’s Response
1. The 2008 Global Financial Crisis and Aftermath:
After the 2008 crisis, the Fed reduced rates to near zero and introduced Quantitative Easing (QE) to infuse liquidity into the system. This led to an abundance of cheap money flowing into emerging economies, including India.
India witnessed strong capital inflows, a booming stock market, and currency appreciation during this period.
However, the excess liquidity also created inflationary pressures and asset bubbles.
2. The 2013 “Taper Tantrum”:
When the Fed announced plans to scale back QE, emerging markets faced sudden outflows. India’s rupee depreciated sharply — from around ₹55 to ₹68 per USD — and inflation spiked.
The RBI had to intervene by tightening monetary policy and using foreign exchange reserves to stabilize the rupee.
This episode demonstrated India’s vulnerability to Fed policy shifts.
3. The 2015–2018 Rate Hike Cycle:
The Fed gradually raised rates as the US economy recovered. India faced moderate outflows, but due to strong domestic fundamentals and stable inflation, it managed to withstand the shock better than in 2013.
4. The COVID-19 Pandemic (2020–2021):
During the pandemic, the Fed once again cut rates to near zero and launched massive stimulus programs. This led to large foreign inflows into Indian equity markets, boosting stock valuations and liquidity.
The Sensex and Nifty reached record highs, and the rupee stabilized despite the economic slowdown.
5. The 2022–2023 Rate Hike Cycle:
To combat post-pandemic inflation, the Fed aggressively raised rates. The impact on India was notable — capital outflows increased, the rupee depreciated to record lows near ₹83/USD, and inflationary pressures persisted.
RBI responded with its own rate hikes to maintain balance and defend the currency.
Impact on Key Sectors of the Indian Economy
1. Exchange Rate and External Sector:
The rupee’s value is directly influenced by Fed rate decisions. A stronger dollar reduces the attractiveness of the rupee, leading to depreciation. This has mixed effects:
Positive: Exports (like IT services and pharmaceuticals) become more competitive.
Negative: Imports (especially crude oil, electronics, and gold) become costlier, widening the current account deficit.
2. Inflation and Monetary Policy:
A weaker rupee increases the price of imported goods, pushing inflation higher. To counteract this, RBI may raise domestic interest rates — which can slow down growth and investment.
3. Stock and Bond Markets:
Foreign portfolio investors (FPIs) play a huge role in India’s financial markets.
When US rates rise, they tend to pull out investments from Indian equities and bonds, leading to volatility.
Conversely, when US rates fall, India often witnesses renewed FPI inflows.
4. Banking and Financial Sector:
Higher global rates influence the cost of borrowing for Indian companies with external debt. Firms with significant dollar-denominated loans face higher repayment burdens.
Banks with foreign liabilities may also experience tighter liquidity and reduced profitability.
5. Corporate and Consumer Borrowing:
If RBI raises rates in response to Fed hikes, domestic loan rates increase, affecting business expansion, real estate demand, and consumer spending.
Impact on Foreign Investments (FII and FDI)
Foreign Institutional Investors (FIIs):
FIIs are highly sensitive to interest rate differentials. A higher US yield reduces the relative attractiveness of Indian assets. Sudden outflows can lead to currency depreciation and market instability.
Foreign Direct Investment (FDI):
While FDI is more long-term and less sensitive to short-term rate movements, prolonged tightening cycles can still affect investor sentiment and the cost of capital for multinational corporations investing in India.
Trade Balance and Current Account Deficit (CAD)
When the dollar strengthens due to Fed hikes, India’s import bill rises, especially since the country imports over 80% of its crude oil requirements.
This worsens the Current Account Deficit (CAD), which in turn can pressure the rupee further.
Export-oriented sectors may benefit, but the overall impact on the trade balance is often negative due to high import dependency.
RBI’s Role in Managing the Spillover Effects
The Reserve Bank of India uses multiple strategies to mitigate the impact of Fed rate decisions:
Monetary Policy Adjustments: Aligning repo rate hikes or cuts to maintain interest rate parity and control inflation.
Forex Market Intervention: Selling or buying dollars from its reserves to manage rupee volatility.
Macroprudential Measures: Encouraging domestic capital formation and diversifying external borrowing.
Strengthening Foreign Exchange Reserves: India’s reserves (over $650 billion as of 2024) act as a buffer against external shocks.
Opportunities for India Amid Fed Tightening
While rate hikes pose challenges, they also present strategic opportunities:
Boost for Exporters: A weaker rupee improves export competitiveness.
Domestic Manufacturing Incentives: Costlier imports push local industries to enhance production capabilities under the Make in India initiative.
Long-term Stability: The RBI’s cautious approach helps build macroeconomic resilience and investor confidence.
Challenges Ahead
Despite policy resilience, India faces several ongoing challenges from Fed policy shifts:
Currency Volatility: Persistent depreciation pressures can erode investor confidence.
High Inflation Risk: Imported inflation through oil and commodities can strain household budgets.
Debt Servicing Costs: Higher global interest rates increase repayment costs for companies with external debt.
Portfolio Outflows: Unstable FII flows make Indian markets vulnerable to global risk sentiment.
Future Outlook
As global monetary policy gradually normalizes, India must navigate a complex environment of tightening liquidity, evolving inflation dynamics, and changing investor sentiment.
Short-term: Volatility in currency and equity markets may persist. RBI is likely to continue balancing growth and inflation through calibrated rate moves.
Medium-term: If India maintains fiscal discipline, deepens domestic capital markets, and enhances manufacturing, it can absorb external shocks more effectively.
Long-term: India’s growing economic strength, demographic advantage, and digital transformation position it to emerge as a resilient economy, even amid global monetary tightening cycles.
Conclusion
The US Federal Reserve’s interest rate decisions have profound implications for the Indian economy, influencing everything from currency value and inflation to capital flows and trade dynamics. While India cannot fully insulate itself from global shocks, prudent policy coordination between the RBI and the government has enabled the country to withstand past crises and build a stronger macroeconomic foundation.
Ultimately, the key lies in maintaining a balanced approach — fostering sustainable growth while safeguarding financial stability. As India continues to integrate into the global economy, understanding and anticipating the Fed’s moves will remain essential for policymakers, investors, and businesses alike.

Primary vs Secondary Market1. Introduction to Financial Markets
Before delving into the specifics, it is essential to understand the structure of financial markets. Financial markets are platforms where buyers and sellers trade financial securities such as shares, bonds, and other instruments. They are broadly divided into two categories:
Money Market – Deals with short-term instruments (less than one year) like treasury bills, certificates of deposit, and commercial papers.
Capital Market – Deals with long-term instruments (more than one year), such as equity shares and debentures.
Within the capital market, the primary and secondary markets function as two distinct segments that ensure a continuous cycle of capital mobilization and liquidity.
2. What is the Primary Market?
The primary market, also known as the new issue market, is where new securities are created and sold to investors for the first time. It serves as a channel for companies, governments, and other entities to raise fresh capital directly from the public.
When a company wants to raise funds for expansion, modernization, or new projects, it issues securities such as shares or bonds in the primary market. The funds raised go directly to the issuing entity, making it an essential source of capital formation.
2.1. Functions of the Primary Market
Capital Formation: The primary market helps mobilize savings from investors and channel them into productive investments.
Direct Fundraising: Companies can directly raise money from investors without relying on intermediaries like banks.
Corporate Growth: It facilitates business expansion, modernization, and diversification by providing access to long-term funds.
Government Funding: Governments use this market to issue securities for financing infrastructure and public projects.
2.2. Methods of Raising Capital in the Primary Market
Public Issue (IPO and FPO):
Initial Public Offering (IPO): When a company issues shares to the public for the first time to get listed on a stock exchange.
Follow-on Public Offering (FPO): When an already listed company issues additional shares to raise more capital.
Private Placement:
Securities are sold to a select group of investors such as financial institutions, mutual funds, or high-net-worth individuals rather than the general public.
Rights Issue:
Existing shareholders are given the right to purchase additional shares in proportion to their current holdings, often at a discounted price.
Preferential Allotment:
Shares are issued to specific investors or promoters at a pre-determined price, often used for strategic partnerships or control consolidation.
2.3. Participants in the Primary Market
Issuers (Companies, Governments)
Investors (Individuals, Institutions, Foreign Investors)
Intermediaries (Merchant Bankers, Underwriters, Registrars, Legal Advisors)
Regulatory Bodies (SEBI in India, SEC in the U.S.)
2.4. Advantages of the Primary Market
Helps in raising long-term funds for business growth.
Enhances the company’s public profile after listing.
Encourages public participation in industrial development.
Promotes economic development through capital mobilization.
2.5. Challenges of the Primary Market
High cost of issuing securities (legal, regulatory, and marketing expenses).
Complex regulatory compliance procedures.
Risk of under-subscription if investor sentiment is weak.
Lengthy approval process for public issues.
3. What is the Secondary Market?
The secondary market, commonly known as the stock market or aftermarket, is where existing securities are traded among investors after being issued in the primary market. In this market, investors buy and sell securities such as shares, bonds, and debentures among themselves.
Unlike the primary market, the issuing company does not receive any funds from these transactions. The secondary market provides liquidity, price discovery, and opportunities for portfolio diversification.
3.1. Functions of the Secondary Market
Liquidity Provision: Investors can easily sell their securities whenever they want, making investments more attractive.
Price Discovery: Continuous buying and selling determine the market value of securities through supply and demand.
Marketability: Securities can be traded quickly and efficiently through organized exchanges.
Capital Allocation: Funds move from less productive to more profitable sectors through investor behavior.
Economic Barometer: The performance of the stock market reflects the overall economic condition of a country.
3.2. Types of Secondary Markets
Stock Exchanges – Organized markets like the NSE (National Stock Exchange) and BSE (Bombay Stock Exchange) in India where securities are traded under regulatory supervision.
Over-the-Counter (OTC) Markets – Decentralized markets where trading happens directly between parties without a centralized exchange.
3.3. Key Participants in the Secondary Market
Investors (Retail, Institutional, Foreign)
Stockbrokers and Dealers
Stock Exchanges
Market Makers
Clearing and Settlement Agencies
Regulators (e.g., SEBI)
3.4. Advantages of the Secondary Market
Provides liquidity and easy exit options for investors.
Encourages more participation by reducing investment risk.
Promotes transparency through real-time pricing and regulation.
Enhances capital allocation efficiency.
Supports wealth creation through capital gains and dividends.
3.5. Challenges in the Secondary Market
High volatility leading to speculative trading.
Market manipulation and insider trading risks.
Dependence on investor sentiment and global market movements.
Requires strong regulatory oversight to maintain transparency.
4. Interconnection Between Primary and Secondary Markets
Though distinct in function, both markets are interdependent. The success of one greatly influences the other:
A vibrant secondary market encourages more investors to participate in the primary market, as they know they can later sell their holdings.
The price performance of securities in the secondary market affects the pricing of future issues in the primary market.
Companies with a strong secondary market performance find it easier to raise capital through follow-on public offerings (FPOs) or rights issues.
Thus, both markets work together to maintain liquidity, investor confidence, and capital formation in the economy.
5. Role of Regulatory Authorities
In India, both the primary and secondary markets are regulated by the Securities and Exchange Board of India (SEBI). It ensures transparency, fairness, and protection of investor interests. Key regulations include:
SEBI (Issue of Capital and Disclosure Requirements) Regulations for primary market.
SEBI (Stock Brokers and Sub-Brokers) Regulations and Listing Obligations and Disclosure Requirements (LODR) for secondary markets.
Other important institutions include:
NSE and BSE: For trading and listing.
NSDL and CDSL: For depository services.
Clearing Corporations: For settlement of trades.
6. Importance of Primary and Secondary Markets in Economic Growth
Both markets play a vital role in the development of the economy:
Mobilization of Savings: Channels idle savings into productive investments.
Wealth Creation: Provides opportunities for investors to grow their wealth.
Industrial Growth: Enables companies to access funds for expansion.
Employment Generation: Increased business activity leads to job creation.
Financial Inclusion: Encourages retail investor participation.
Efficient Resource Allocation: Funds are directed toward the most productive uses.
7. Modern Developments in Capital Markets
Technological and regulatory innovations have revolutionized both markets:
Online IPO applications through ASBA and UPI.
Algorithmic trading and high-frequency trading in secondary markets.
Introduction of REITs and InvITs to diversify investment options.
Blockchain and AI-based platforms for greater transparency.
Globalization of capital markets through cross-border listings and foreign investments.
8. Challenges and Future Outlook
While both markets have evolved significantly, challenges persist:
Market volatility due to global uncertainties.
Information asymmetry and insider trading.
Regulatory compliance becoming complex.
Investor awareness and financial literacy gaps.
The future, however, appears promising. With better digital infrastructure, stronger governance, and increased retail participation, both primary and secondary markets are expected to play even greater roles in driving economic growth.
Conclusion
The primary and secondary markets form the twin pillars of the capital market, each performing complementary functions vital for economic prosperity. The primary market fuels growth by providing fresh capital to enterprises, while the secondary market ensures liquidity, investor confidence, and continuous valuation of securities.
A well-functioning primary market cannot exist without a robust secondary market—and vice versa. Together, they ensure that capital moves efficiently from savers to investors, driving innovation, industrialization, and wealth creation. As technology advances and regulatory frameworks strengthen, the synergy between these two markets will continue to shape the financial future of nations across the globe.

Swing Trading SecretsMastering Short-to-Medium Term Market Moves.
1. Understanding the Essence of Swing Trading
Swing trading lies between day trading and long-term investing. Day traders open and close positions within a single day, while investors may hold assets for months or years. Swing traders, however, aim to profit from short-term price swings caused by shifts in market sentiment, news, or momentum.
The main goal of a swing trader is to identify a stock that is likely to move strongly in one direction — up or down — and enter the trade at the beginning of that move. Traders typically use a combination of technical analysis, volume studies, and trend confirmation tools to spot these opportunities.
Key Characteristics of Swing Trading:
Holding period: 2 days to 3 weeks.
Focus on short-term price trends.
Reliance on chart patterns and indicators.
Moderate risk and higher flexibility.
Works well in volatile markets.
Swing trading is ideal for traders who cannot watch the market all day but still want to take advantage of short-term market opportunities.
2. The Secret Foundation: Understanding Market Cycles
The first secret of swing trading mastery is understanding market cycles. Every market moves in repetitive phases — accumulation, uptrend, distribution, and downtrend.
a. Accumulation Phase
This is when smart money (institutional investors) starts buying an asset quietly after a downtrend. The price moves sideways, showing low volatility and volume.
Secret tip: Look for subtle increases in volume and higher lows — signs of accumulation before a breakout.
b. Uptrend Phase
Once accumulation is complete, price begins to rise with increasing momentum. Swing traders thrive here — buying on pullbacks or breakouts.
Secret tip: Use moving averages like the 20-day EMA to confirm trend continuation.
c. Distribution Phase
In this stage, big players start taking profits. The market may move sideways again with false breakouts.
Secret tip: Watch for divergences in RSI or MACD — a classic sign of distribution.
d. Downtrend Phase
Selling pressure increases, creating a bearish phase. Swing traders can profit from short-selling opportunities here.
Secret tip: Trade with the trend — look for pullbacks to resistance levels to enter shorts.
Understanding where the market stands in this cycle is a hidden key to timing your trades effectively.
3. Technical Secrets of Successful Swing Trading
Swing trading is built on the foundation of technical analysis. The most successful swing traders rely on chart patterns, indicators, and price action.
a. Chart Patterns
Recognizing chart patterns can help predict future price moves.
Bullish patterns: Ascending triangle, cup and handle, flag, double bottom.
Bearish patterns: Descending triangle, head and shoulders, double top.
These patterns signal continuation or reversal of trends, guiding entry and exit points.
b. Moving Averages
Moving averages smooth price data and reveal the underlying trend.
20-day EMA: Ideal for short-term trend confirmation.
50-day SMA: Used to identify medium-term trend direction.
Golden Cross: When 50-day SMA crosses above 200-day SMA — strong bullish sign.
c. RSI (Relative Strength Index)
RSI measures momentum.
Buy when RSI is below 30 (oversold) and starts turning up.
Sell when RSI is above 70 (overbought) and begins to fall.
d. MACD (Moving Average Convergence Divergence)
MACD helps identify momentum shifts.
Bullish signal: MACD line crosses above the signal line.
Bearish signal: MACD line crosses below the signal line.
e. Volume Analysis
Volume confirms price movement. A breakout with high volume is more trustworthy than one with low volume.
Secret tip: Combine volume with candlestick patterns to detect genuine breakouts.
4. Price Action Secrets: Reading the Story Behind Candles
Price action is the purest form of market analysis — studying the movement of prices without relying too heavily on indicators.
a. Support and Resistance
Support is where the price tends to bounce up, while resistance is where it usually faces selling pressure.
Secret tip: Strong swing entries occur near these zones with confirmation candles like hammers or engulfing patterns.
b. Candlestick Signals
Certain candlestick formations indicate strong market sentiment:
Bullish engulfing: Reversal signal after a downtrend.
Hammer: Shows rejection of lower prices — potential bottom.
Doji: Indicates indecision — potential reversal ahead.
c. Breakouts and Retests
Breakouts above resistance or below support are strong signals. However, waiting for a retest before entry helps avoid fake moves.
5. Risk Management Secrets: Protecting Your Capital
No swing trading secret is more powerful than proper risk management. Even with the best analysis, losses are inevitable. The key is to limit losses and let profits run.
a. Position Sizing
Never risk more than 1–2% of your total trading capital on a single trade. Calculate your position based on the stop-loss distance.
b. Stop-Loss Placement
Set stop-loss below the most recent swing low (for buy trades) or above swing high (for short trades).
Secret tip: Use ATR (Average True Range) to set dynamic stop-losses based on volatility.
c. Reward-to-Risk Ratio
Always aim for a minimum 2:1 reward-to-risk ratio. This means if you risk ₹1000, your target should be at least ₹2000.
d. Trailing Stop
As the price moves in your favor, use a trailing stop to lock in profits. This ensures you capture bigger moves without exiting too early.
6. Psychological Secrets: Mastering Your Mind
Trading psychology often determines success more than strategy. The secret lies in discipline, patience, and emotional control.
a. Avoid Impulsive Decisions
Don’t trade just because you “feel” the market will move. Wait for confirmation from technical setups.
b. Stick to Your Plan
Have a predefined entry, exit, and stop-loss for every trade. Avoid changing them mid-trade out of fear or greed.
c. Control Overtrading
Swing trading doesn’t require multiple trades daily. Fewer, high-quality trades often produce better results.
d. Embrace Losses
Losses are part of the game. Learn from them instead of chasing revenge trades.
e. Journal Every Trade
Maintain a detailed trading journal — entry reason, outcome, emotions, and lessons learned. This is one of the most underrated swing trading secrets.
7. Secret Strategies That Work
a. Moving Average Crossover Strategy
Use the 20 EMA and 50 EMA.
Buy when 20 EMA crosses above 50 EMA (bullish crossover).
Sell when 20 EMA crosses below 50 EMA (bearish crossover).
Combine this with RSI confirmation for accuracy.
b. Breakout Pullback Strategy
When price breaks a key resistance, wait for a pullback (retest) to enter. This avoids false breakouts and improves entry timing.
c. Fibonacci Retracement Strategy
Use Fibonacci levels (38.2%, 50%, 61.8%) to identify potential pullback zones during a trend. Combine with price action for confirmation.
d. Volume Spike Strategy
Sudden volume increase indicates strong institutional participation. When volume spikes with a bullish candle, it often signals the start of a big swing.
e. Multi-Timeframe Analysis
Analyze higher time frames (like daily or weekly) for trend direction and lower time frames (4-hour or 1-hour) for entries. This alignment increases trade success probability.
8. Swing Trading Tools and Platforms
a. Charting Platforms
TradingView
MetaTrader 4/5
Thinkorswim
b. Scanning Tools
Use screeners to identify stocks showing breakout patterns or high momentum:
Finviz
TrendSpider
StockEdge (for Indian markets)
c. News and Data Sources
Stay updated with earnings announcements, interest rate decisions, and global events — these can influence swing trades significantly.
9. Swing Trading in Indian Markets
In India, swing trading opportunities are abundant due to high market liquidity and volatility in mid-cap and large-cap stocks.
Best Sectors for Swing Trading:
Banking and Financials (HDFC Bank, SBI, ICICI)
IT Stocks (Infosys, TCS, Tech Mahindra)
Energy (ONGC, Reliance Industries)
Auto and Pharma sectors
Secret Tip for Indian Swing Traders:
Focus on F&O stocks with strong volume and price momentum. These tend to show cleaner technical patterns and stronger moves.
10. Common Mistakes and Hidden Lessons
Even experienced swing traders make costly mistakes. Recognizing them early can save your capital.
Common Mistakes:
Ignoring stop-loss or moving it further.
Trading against the trend.
Overusing leverage.
Entering late after a big move.
Lack of patience and consistency.
Hidden Lessons:
Consistency beats intensity.
One good trade can make up for multiple small losses.
Never trade when emotionally unstable.
Backtesting your strategy builds confidence.
11. The Future of Swing Trading: Technology and AI
AI-based tools, algorithmic trading, and real-time data analytics are changing swing trading. Predictive models now identify trend reversals faster than ever. However, human intuition and discipline still remain irreplaceable. The future lies in combining data-driven insights with human strategy.
Conclusion
Swing trading is an art and a science. It demands a sharp eye for patterns, deep understanding of market cycles, strong discipline, and emotional intelligence. By mastering these swing trading secrets, traders can capture lucrative short-term moves while maintaining control over risk.
The true secret, however, lies not in finding the “perfect” strategy — but in consistency, patience, and continuous learning. Markets evolve, but principles of discipline and risk management never change. Whether you trade Indian equities or global markets, swing trading rewards those who respect the process and stay committed to mastering it.

Risk Management vs Position Sizing in Option Trading1. Introduction to Risk Management in Option Trading
Risk management refers to the strategies and techniques traders use to minimize potential losses and protect their capital. In simple terms, it’s the process of deciding how much risk you are willing to take on each trade and how to respond when the market moves against you.
Option trading is inherently riskier than traditional stock trading because of leverage, time decay, and volatility sensitivity. Without a sound risk management plan, even the most skilled traders can wipe out their capital quickly.
Key Objectives of Risk Management
Capital Preservation – Protect your trading capital from large drawdowns.
Consistent Returns – Maintain a stable equity curve with controlled risk exposure.
Psychological Stability – Reduce emotional stress by limiting large unexpected losses.
Longevity in the Market – Survive long enough to benefit from the law of large numbers and experience.
2. Importance of Risk Management in Options
Options are leveraged instruments, meaning small price changes in the underlying asset can result in large percentage gains or losses in the option’s value. This amplifies both potential profits and potential risks.
Consider this scenario:
You buy a call option for ₹100 (premium) on NIFTY.
If NIFTY moves in your favor, the option could rise to ₹200 — a 100% return.
If NIFTY falls, your option could drop to ₹20 or even expire worthless — an 80–100% loss.
Without managing your risk per trade, such swings can lead to emotional trading, over-leveraging, and account blowouts.
Core Components of Option Risk Management
Defining Maximum Risk Per Trade – Most professionals risk 1–2% of total capital per trade.
Setting Stop-Loss Levels – Determine the exit point where losses are capped.
Diversification – Spread exposure across different stocks, sectors, or strategies.
Volatility Consideration – Manage trades based on implied and historical volatility levels.
Risk-Reward Ratio – Ensure that the potential reward is at least twice the risk (2:1 ratio).
Hedging – Use opposite positions (like protective puts) to reduce overall portfolio risk.
3. The Relationship Between Risk Management and Position Sizing
Risk management and position sizing are two sides of the same coin.
Risk management answers “How much can I afford to lose?”
Position sizing answers “How big should my trade be?”
Key Relationship:
Risk per trade defines the maximum acceptable loss.
Position sizing translates that risk into number of contracts.
Together, they ensure that no single trade can cause significant damage to your account, maintaining capital stability and emotional discipline.
4. Why Traders Fail Without These Concepts
Most new option traders focus entirely on predicting market direction, ignoring money management. They trade too large, too often, and without structured risk control.
Common reasons for failure include:
Over-leveraging (too many lots for account size)
No stop-loss or adjustment strategy
Risking inconsistent amounts per trade
Emotional revenge trading after losses
Ignoring volatility and time decay
By applying consistent position sizing and risk management rules, traders can survive losing streaks and remain profitable long-term, even with a win rate as low as 40–50%.
5. Types of Risks in Option Trading
Before applying risk management, traders must understand the different types of risks involved in option trading:
a. Market Risk
The risk of losing money due to adverse price movements in the underlying asset.
b. Volatility Risk
Changes in implied volatility (IV) affect option premiums. A sudden drop in IV can cause losses even if the price moves favorably.
c. Time Decay Risk (Theta)
Options lose value over time, especially as they approach expiry. Holding long options without movement can lead to gradual losses.
d. Liquidity Risk
Low open interest or volume can make it difficult to exit positions at fair prices.
e. Execution Risk
Delays or slippages during trade entry or exit can increase actual losses beyond planned levels.
Understanding these risks helps traders plan position size and protective measures accordingly.
6. Risk Management Techniques in Option Trading
a. Use of Stop-Loss Orders
Set stop-loss levels based on technical indicators, volatility bands, or fixed percentage loss.
Example: Exit if the option premium drops 30–40% below entry.
b. Hedging Positions
Offset risk with opposite positions:
Long stock + long put = protective hedge
Short call + long call (spread) = limited loss
c. Strategy Selection
Use defined-risk strategies like spreads, straddles, and butterflies instead of naked options. This caps potential losses upfront.
d. Diversification Across Trades
Avoid placing all capital on a single stock or index. Diversify across:
Different sectors
Expiry dates
Strategy types (e.g., spreads, iron condors, strangles)
e. Portfolio Risk Management
Monitor total portfolio exposure instead of individual trades.
Limit total open risk to no more than 10–15% of trading capital.
7. Psychological Role of Risk and Position Sizing
Trading psychology plays a significant role in executing these principles. When traders know their maximum loss upfront, it reduces anxiety and prevents panic decisions.
Proper position sizing allows traders to trade objectively, even during volatile periods.
Benefits include:
Increased confidence
Better emotional control
Reduced overtrading
More consistent performance
Advanced Risk Management Tools for Option Traders
Greeks Management – Use delta, gamma, theta, and vega to manage exposure dynamically.
Portfolio Margining – Optimize capital usage by evaluating net exposure.
Scenario Analysis – Simulate market movements and estimate potential losses.
Stop-Loss Automation – Use algorithmic or rule-based systems to exit losing trades swiftly.
Volatility Filters – Avoid trading during excessive volatility or major news events.
8. The Compounding Power of Controlled Risk
Consistent position sizing with controlled risk leads to geometric capital growth.
For example, if you risk 1% per trade with a 2:1 reward-to-risk ratio and maintain 50% accuracy, your capital will grow steadily.
The Math Behind It
Over 100 trades:
50 winners × 2% gain = +100%
50 losers × 1% loss = -50%
Net Gain = +50% with disciplined risk and sizing
This demonstrates that consistent risk management is more important than win rate.
9. Common Mistakes to Avoid
Risking too much on one trade
Ignoring correlation between positions
Overtrading after a winning streak
Refusing to cut losses early
Neglecting volatility effects on options
Avoiding these mistakes ensures steady progress and capital safety.
10. Integrating Risk Management & Position Sizing into a Trading Plan
A professional trading plan should include:
Defined capital allocation for each strategy.
Maximum risk per trade and per day/week.
A clear position sizing formula.
Stop-loss and target guidelines.
Rules for scaling in/out of trades.
Performance review metrics (risk-adjusted returns).
Conclusion
Risk management and position sizing are the twin pillars of success in option trading. While strategy selection determines what to trade, risk management determines how much to trade and how to survive in the long run.
A trader who risks 1–2% per trade and sizes positions properly can withstand market volatility, endure losing streaks, and steadily grow wealth through compounding.
Ultimately, trading is not about predicting the future — it’s about managing uncertainty. The traders who master risk and position sizing don’t just survive — they thrive.