Advanced Trading Methods: Mastering Modern Market Strategies1. The Foundation of Advanced Trading
Before diving into the methods, it’s essential to understand what makes a trading approach “advanced.” Advanced trading involves:
Complex analytical frameworks: Using mathematical and statistical models to identify opportunities.
Data-driven decision-making: Reliance on historical and real-time market data.
Algorithmic execution: Automating trades for efficiency and precision.
Risk-adjusted performance: Focusing on consistent, sustainable returns rather than speculative profits.
Behavioral mastery: Understanding and managing human emotions and biases.
An advanced trader combines multiple dimensions — strategy, analysis, risk management, and psychology — into a cohesive trading system.
2. Algorithmic and Quantitative Trading
a. Algorithmic Trading
Algorithmic trading (or “algo trading”) uses computer programs to automatically execute trades based on predefined criteria such as price, volume, and timing. Algorithms help eliminate emotional bias and execute trades faster than human capability.
Key types of algorithmic strategies:
Trend-following algorithms: Identify momentum patterns using moving averages or breakouts.
Mean reversion algorithms: Assume prices will revert to historical averages after deviations.
Arbitrage strategies: Exploit temporary price differences between related instruments.
Market-making algorithms: Provide liquidity by continuously quoting buy and sell prices.
Statistical arbitrage: Use statistical models to detect short-term mispricings between correlated assets.
Algorithmic trading dominates global market volumes, with institutions using complex systems that analyze thousands of data points in milliseconds.
b. Quantitative Trading
Quantitative (quant) trading relies on mathematical modeling and statistical analysis to forecast price movements. Quant traders design models that identify high-probability trade setups.
Quantitative models include:
Factor models: Evaluate stocks based on fundamental factors like earnings, growth, or volatility.
Machine learning models: Use AI to detect nonlinear relationships in large datasets.
Time-series models: Predict future price movements from historical trends using ARIMA, GARCH, or Kalman filters.
Quantitative trading requires programming knowledge (Python, R, MATLAB) and a strong grasp of probability, calculus, and econometrics.
3. Technical Mastery: Advanced Charting and Indicators
a. Multi-Time Frame Analysis
Professional traders analyze price behavior across multiple time frames to align long-term trends with short-term setups. For instance, a trader may confirm an uptrend on the weekly chart and then enter trades on the 1-hour chart to optimize timing.
b. Advanced Indicators
Ichimoku Cloud: Combines support, resistance, and momentum in one view.
Volume Profile: Analyzes traded volume at each price level to identify high-liquidity zones.
Fibonacci Extensions: Predict potential price targets during strong trends.
Bollinger Band Width: Measures volatility expansion or contraction phases.
Average True Range (ATR): Quantifies market volatility for dynamic stop-loss placement.
c. Harmonic Patterns and Elliott Wave Theory
Advanced traders often use harmonic patterns (like Gartley, Bat, and Butterfly) to identify high-probability reversal zones based on Fibonacci ratios. Similarly, Elliott Wave Theory interprets market psychology through wave structures, forecasting long-term cycles of optimism and pessimism.
4. Price Action and Market Structure
While indicators are helpful, many professional traders rely heavily on price action — pure price movement without lagging indicators.
Key components include:
Supply and Demand Zones: Identify institutional order blocks where price reacts strongly.
Liquidity Pools: Areas where stop-losses cluster, often targeted by large players.
Break of Structure (BOS): A shift in market trend confirmed by price breaking a significant high or low.
Order Flow Analysis: Uses volume and bid-ask data to visualize market participant behavior.
By mastering market structure, traders can anticipate institutional activity instead of reacting to it.
5. Derivative-Based Trading Methods
Advanced traders frequently use derivatives — such as options, futures, and swaps — to manage risk and enhance returns.
a. Options Trading
Options offer strategic flexibility through structures like:
Delta-neutral strategies: Profiting from volatility (e.g., straddles, strangles).
Spreads: Combining multiple options to manage directional exposure and cost.
Covered Calls and Protective Puts: Hedging long-term investments.
b. Futures and Hedging
Futures allow traders to speculate on or hedge against price movements in commodities, indices, and currencies. Advanced traders manage leverage, margin requirements, and roll-over costs to maintain efficient positions.
c. Volatility Trading
Volatility is an asset in itself. Advanced traders use instruments like the VIX index, volatility ETFs, or implied volatility analysis to construct trades that profit from market uncertainty.
6. Statistical and Probabilistic Methods
Trading success depends on probability, not certainty. Advanced traders apply statistical techniques to quantify and manage uncertainty.
Core techniques include:
Monte Carlo simulations: Model potential trade outcomes over thousands of iterations.
Backtesting: Testing strategies on historical data to evaluate robustness.
Optimization and curve fitting: Fine-tuning parameters without overfitting.
Risk-reward ratio and expectancy: Measuring expected profit per trade over time.
Sharpe and Sortino ratios: Evaluating risk-adjusted returns.
Probability-based thinking helps traders focus on edge and consistency rather than outcome-driven emotions.
7. Automated Trading and Artificial Intelligence
AI-driven trading is the frontier of modern finance. Machine learning models can adapt and learn from new data, identifying patterns human traders might miss.
Applications of AI in trading:
Natural Language Processing (NLP): Analyzing news sentiment and social media for market signals.
Reinforcement learning: Algorithms that self-improve through simulated environments.
Neural networks: Detecting nonlinear price relationships and predicting future volatility.
Robo-advisors: Automated portfolio management systems optimizing asset allocation.
AI allows for dynamic, adaptive systems that continuously refine themselves based on performance metrics.
8. Risk Management and Position Sizing
Even the best strategy fails without proper risk control. Advanced traders use sophisticated models to preserve capital.
Risk control techniques include:
Value at Risk (VaR): Estimates potential loss under normal conditions.
Kelly Criterion: Determines optimal bet size to maximize long-term growth.
Drawdown control: Limiting capital losses through daily, weekly, or cumulative limits.
Diversification and correlation analysis: Reducing systemic risk by balancing asset exposure.
Position sizing based on volatility, confidence level, and account equity ensures consistent performance and psychological stability.
9. Behavioral Finance and Trading Psychology
Human emotions — fear, greed, overconfidence, and loss aversion — are the greatest obstacles to advanced trading success.
Advanced traders master:
Cognitive discipline: Following systems regardless of emotional impulses.
Journaling: Tracking trades to analyze patterns and improve decision-making.
Mindfulness and focus: Maintaining calm under market pressure.
Probabilistic mindset: Accepting uncertainty as part of the process.
Professional performance depends not only on technical skill but also on emotional intelligence and mental resilience.
10. Global and Macro Trading Approaches
Global markets are interconnected — interest rates, currency movements, and geopolitical events all impact prices. Advanced traders use macro trading strategies to exploit these relationships.
Examples include:
Interest rate arbitrage: Trading based on central bank policy differentials.
Currency carry trade: Borrowing in low-interest currencies to invest in high-yield ones.
Commodities and inflation plays: Using gold or oil to hedge against inflationary trends.
Intermarket analysis: Studying how equities, bonds, and commodities influence each other.
A strong understanding of macroeconomics enhances timing, positioning, and portfolio management across global markets.
11. Portfolio Construction and Risk Parity
Advanced traders think beyond individual trades — they manage portfolios as integrated ecosystems.
Modern portfolio techniques include:
Risk parity models: Allocating capital based on volatility rather than nominal value.
Dynamic rebalancing: Adjusting exposure as market conditions evolve.
Correlation clustering: Ensuring diversification across uncorrelated assets.
Performance attribution: Measuring which strategies contribute most to returns.
This systematic approach maximizes risk-adjusted growth over the long term.
12. The Role of Technology and Infrastructure
Modern trading success depends on robust infrastructure.
Advanced tools include:
Low-latency servers for high-frequency execution.
API integrations for data feeds and brokerage automation.
Backtesting platforms such as QuantConnect or MetaTrader.
Data visualization tools like Tableau or Python dashboards.
Access to real-time data, high-quality execution, and cloud-based analytics transforms strategy into actionable performance.
13. Continuous Learning and Strategy Evolution
Markets evolve — and so must traders. The best professionals constantly refine their systems.
Steps to long-term mastery:
Research: Stay updated with financial innovation and emerging technologies.
Experimentation: Test new strategies under controlled environments.
Mentorship and community: Learn from experienced traders and data scientists.
Performance review: Regularly evaluate metrics and adapt.
Trading is a lifelong pursuit of improvement and adaptation.
Conclusion
Advanced trading is not about complexity for its own sake — it’s about building a structured, data-driven, risk-managed, and psychologically stable approach to the markets. The journey from intermediate to advanced trader involves mastering the synergy between technology, analysis, and human behavior.
By combining algorithmic precision, quantitative modeling, disciplined psychology, and continuous learning, traders can transform their craft into a professional, scalable, and sustainable enterprise.
In the modern financial landscape, knowledge truly is the most powerful form of capital — and advanced trading methods are the foundation upon which lasting success is built.
Tradingideas
Part 12 Trading Master ClassMastering the Art of Option Trading
Option trading blends mathematics, psychology, and market logic. It’s not just about predicting direction but understanding probabilities, risk management, and timing. Successful traders treat options as tools for strategic advantage — not gambling tickets.
In essence:
Options = Flexibility + Leverage + Protection.
They empower traders to define risk, hedge intelligently, and profit across market cycles.
But to master them, one must study pricing models, volatility behavior, and trade discipline.
Whether you’re a hedger protecting a portfolio or a speculator chasing momentum, options are the bridge between risk and opportunity — making them one of the most powerful innovations in modern financial markets.

Part 11 Trading Master ClassWhat Is Option Trading?
Option trading is a form of derivatives trading, where investors buy or sell contracts that give them the right but not the obligation to buy or sell an underlying asset (such as stocks, indices, or commodities) at a predetermined price before or on a specific date.
Unlike stocks, which represent ownership in a company, options represent a financial contract derived from the price movement of another asset — hence, they are part of the derivatives market.
There are two main types of options:
Call Options: Give the holder the right to buy an asset at a set price.
Put Options: Give the holder the right to sell an asset at a set price.
Each option contract involves:
Strike Price: The agreed-upon price for buying/selling the asset.
Expiry Date: The last date the option can be exercised.
Premium: The price paid to buy the option.

Part 4 Learn Institutional TradingThe Two Sides: Option Buyer vs Option Seller
Every option trade involves two parties — a buyer and a seller (writer). Their goals are opposite:
Role Right / Obligation Risk Reward
Buyer of Call/Put Right, no obligation Limited to premium Unlimited (Call) / High (Put)
Seller (Writer) Obligation Potentially unlimited Limited to premium
Example:
If you sell a call option on Reliance at ₹3,000, and the stock rises to ₹3,200 — you must sell it at ₹3,000, incurring a loss. But if the stock stays below ₹3,000, you keep the premium as profit.
Thus, option sellers have higher risk, but they statistically profit more often due to time decay.

Part 3 Trading Master Class With ExpertsTypes of Option Traders
Different traders use options for different purposes. Here’s how:
Speculators – Trade options to profit from short-term market moves.
Hedgers – Use options to protect their existing investments (like insurance).
Income Traders – Sell options regularly to collect premium income.
Arbitrageurs – Exploit price differences between spot and derivatives markets.
For example, a portfolio manager holding stocks may buy put options to safeguard against sudden market falls. Meanwhile, a retail trader may sell call options to earn regular premium income.

Part 2 Trading Master Class With ExpertsHow Option Trading Works
Let’s take a practical example:
Suppose you buy a Nifty 50 Call Option with a strike price of ₹22,000, expiring in one month, by paying a premium of ₹100 per lot (lot size 50).
If Nifty moves up to 22,500 before expiry — your call option becomes profitable because you can buy at 22,000 (strike) and sell at 22,500 (market price).
If Nifty falls to 21,800 — your option becomes worthless, and you lose only the ₹100 premium.
In short, your risk is limited to the premium paid, but your profit potential is unlimited (for call buyers).
Similarly, for a put option, profits come when the market goes down.

Part 1 Intraday Master ClassIntroduction to Option Trading
Option trading is one of the most fascinating and flexible areas in the financial markets. Unlike traditional stock trading — where you buy or sell shares directly — options give you the right but not the obligation to buy or sell an underlying asset (like a stock, index, or commodity) at a fixed price within a specified time.
Think of options as financial contracts that allow traders and investors to speculate on price movements, hedge existing positions, or earn income — all without actually owning the underlying asset.
For example, if you believe Reliance Industries’ stock will go up, instead of buying the shares directly, you can buy a call option — a cheaper contract that benefits if the stock price rises. Conversely, if you expect a fall, you can buy a put option.
The main advantage? Leverage. You control a large position with a relatively small investment. But this also means risk — because options lose value as time passes or if prices move against your expectation.

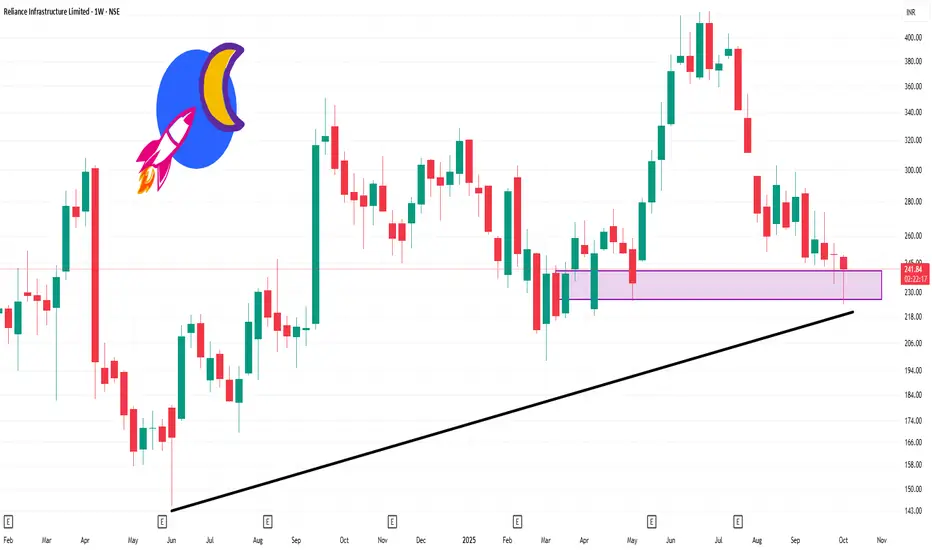
RELINFRA 1 Week Time Frame 📈 Current Price & Recent Performance
Current Price: ₹241.84 (as of October 10, 2025)
1-Week Change: +5.00%
52-Week Range: ₹198.13 – ₹423.40
🔍 Technical Indicators (Weekly Timeframe)
Relative Strength Index (RSI): Indicates a neutral condition, suggesting neither overbought nor oversold conditions.
Stochastic Oscillator: Shows a bullish condition, with readings between 55 and 80.
Rate of Change (ROC): Indicates a bearish condition, with readings below 0.
Commodity Channel Index (CCI): Shows a neutral condition, with readings between 45 and 55.
Money Flow Index (MFI): Indicates a neutral condition, with readings between 45 and 55.
Average True Range (ATR): Suggests a less volatile market, with values less than or equal to the 9-day Simple Moving Average (SMA).
Average Directional Index (ADX): Indicates a weak trend, with values below 20.
📊 Moving Averages & Trend Analysis
Short-Term Moving Averages: Currently below long-term averages, indicating a bearish trend.
Resistance Levels: Key resistance levels identified at ₹239.34 and ₹262.85.
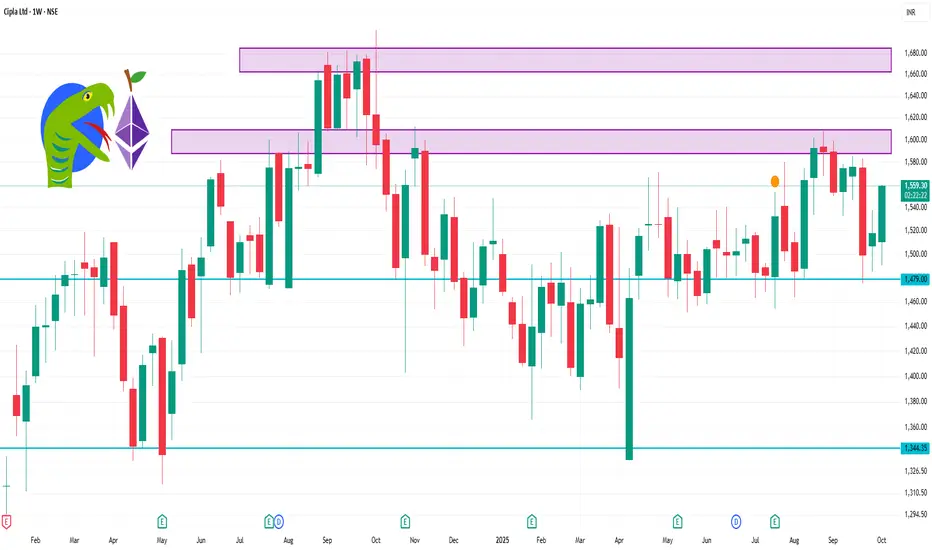
CIPLA 1 Week Time Frame 📈 Weekly Support & Resistance Levels
Support Levels:
S1: ₹1,491.53
S2: ₹1,499.17
S3: ₹1,506.48
S4: ₹1,514.12
Resistance Levels:
R1: ₹1,521.43
R2: ₹1,529.07
R3: ₹1,536.38
R4: ₹1,544.70
These levels are derived from the classic pivot point method and can serve as potential entry or exit points for traders.
Technical Indicators Snapshot
Relative Strength Index (RSI): 77.43 (approaching overbought territory)
MACD: 7.01 (bullish crossover)
Average Directional Index (ADX): 30.49 (indicating a strong trend)
Commodity Channel Index (CCI): 307.2 (overbought)
Williams %R: -0.79 (overbought)
Rate of Change (ROC): 3.81% (bullish momentum)
Moving Averages:
5-day: ₹1,527.76
50-day: ₹1,510.91
200-day: ₹1,542.76
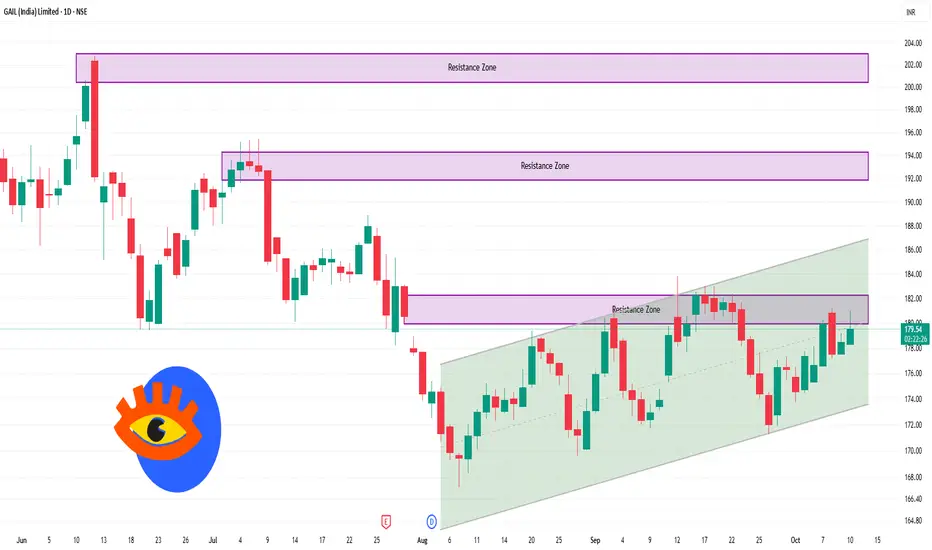
GAIL (India) Ltd 1 Day Time Frame 📊 Key Technical Indicators
Relative Strength Index (RSI): Approximately 58.89, indicating a neutral to bullish momentum.
Moving Average Convergence Divergence (MACD): Around 0.58, suggesting a bullish trend.
Simple Moving Averages (SMA):
5-Day: ₹179.11
50-Day: ₹177.17
200-Day: ₹177.3
These values indicate a bullish sentiment, as the stock is trading above these averages.
📈 Support and Resistance Levels
Immediate Support: ₹177.20
Immediate Resistance: ₹182.50
A breakout above ₹182.50 could signal a continuation of the uptrend, while a fall below ₹177.20 might indicate a bearish reversal.
🧭 Summary
GAIL (India) Ltd. is currently in a neutral to bullish phase on the daily chart. Key indicators like RSI and MACD support this outlook, and the ascending triangle pattern suggests potential upward momentum. However, traders should monitor the support and resistance levels closely to assess the next move.
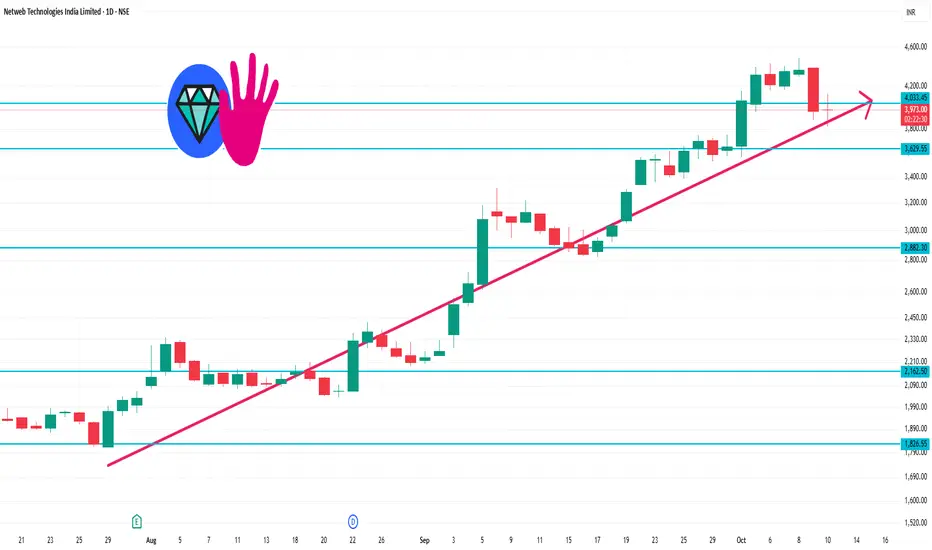
NETWEB 1 Day Time Frame 📈 Current Intraday Levels
Current Price: ₹4,063.60
Day’s High: ₹4,125.9
Day’s Low: ₹3,821.00
VWAP (Volume-Weighted Average Price): ₹4,034.65
Volume Traded: Approximately 2.4 million shares
Market Cap: ₹22,894 crore
52-Week Range: ₹1,251.55 – ₹4,479.00
Circuit Limits: Upper: ₹4,756.30; Lower: ₹3,170.90
The stock has shown a notable rise today, breaking above the ₹4,000 mark and approaching its day high. This movement follows a recent dip to ₹4,014.35, indicating a rebound in investor sentiment
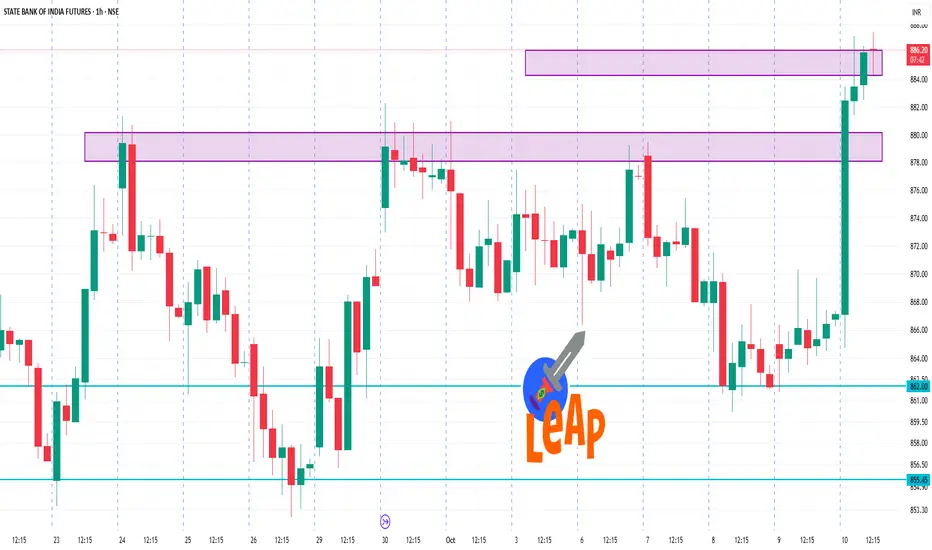
SBIN 1 Hour Time Frame 📈 1-Hour Time Frame Technical Overview
On the 1-hour chart, the technical indicators for SBIN futures are as follows:
Moving Averages: Strong Buy
Oscillators: Neutral
Overall Technical Rating: Strong Buy
This suggests a bullish short-term trend, with moving averages indicating upward momentum.
🔄 Key Levels to Watch
Based on recent intraday analysis, the following levels are noteworthy:
Resistance Levels: ₹880.88
Support Levels: ₹863.38
These levels can serve as potential entry or exit points for traders.
📊 Additional Insights
Open Interest: Approximately 94.62 million contracts, indicating active participation.
Volume: Around 13.07 million contracts traded, reflecting healthy liquidity.
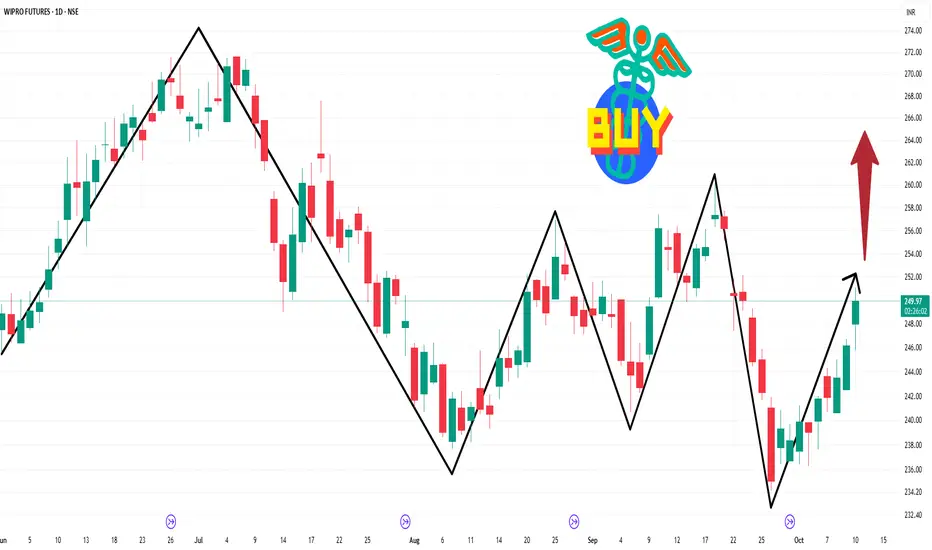
WIPRO 1 Day Time Frame 📈 Current Price & Trend
Price: ₹250.50
Day's Range: ₹246.26 – ₹250.63
Previous Close: ₹246.20
Change: +1.62%
🔍 Technical Indicators
RSI (14): 78.90 (Overbought)
MACD: 1.86 (Bullish)
ADX: 46.59 (Strong Trend)
CCI (14): 237.19 (Overbought)
Moving Averages: All major MAs (5, 10, 20, 50, 100, 200) are in a "Strong Buy" position
📊 Key Levels
Support: ₹242, ₹240, ₹230
Resistance: ₹255, ₹260, ₹265
52-Week High: ₹324.60 (July 2, 2025)
✅ Outlook
The technical indicators suggest a strong bullish momentum. However, with the RSI indicating overbought conditions, a short-term pullback could occur. A sustained move above ₹255 could target ₹265–₹270 in the short term
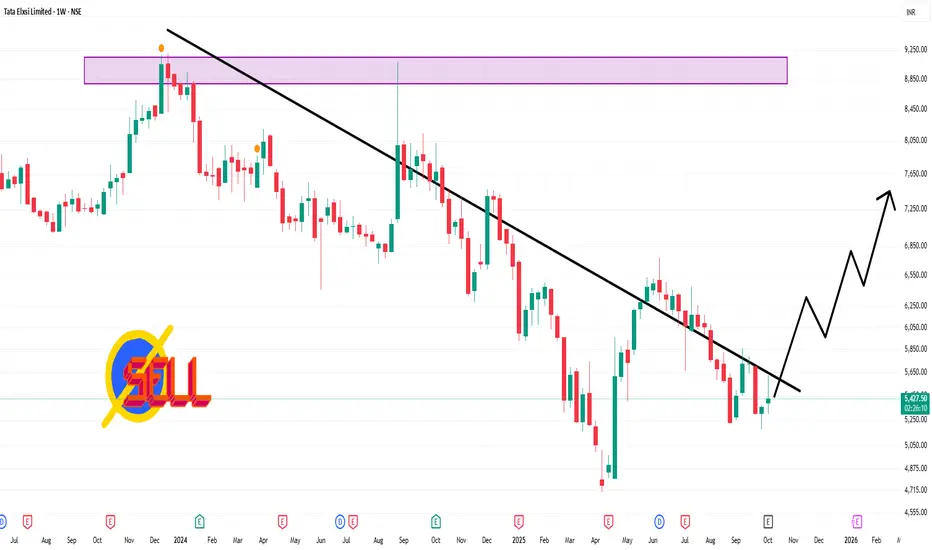
TATAELXSI 1 Week Time Frame 📉 Technical Outlook (Weekly Timeframe)
Technical Rating: The prevailing trend is a strong sell, supported by indicators such as moving averages and oscillators.
Pivot Levels:
Weekly Pivot Point: ₹5,300.33
Support Levels:
S1: ₹5,272.75
S2: ₹5,106.83
Resistance Levels:
R1: ₹5,493.83
R2: ₹5,618.17
Central Pivot Range: ₹5,272.75 – ₹5,300.33 – ₹5,327.92
Relative Strength Index (RSI): The 14-day RSI is approximately 48.6, indicating a neutral condition.
Moving Averages:
50-day MA: ₹5,362.89 (Buy)
200-day MA: ₹5,503.06 (Sell)
5-day MA: ₹5,468.50 (Sell)
10-day MA: ₹5,502.65 (Sell)
20-day MA: ₹5,468.57 (Sell)
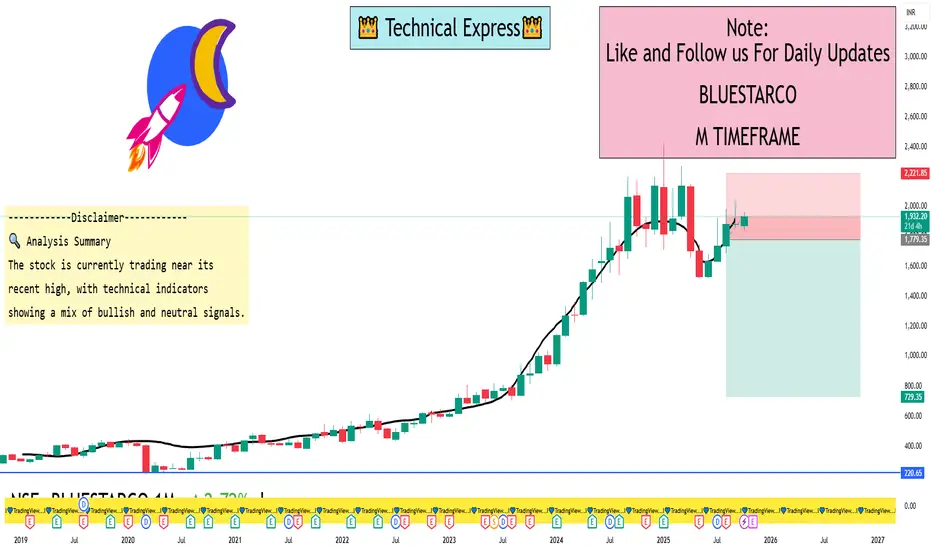
BLUESTARCO 1 Month View📈 Current Price and Trend
Current Price: ₹1,931.10
1-Month Price Change: Approximately +2.62%
52-Week Range: ₹1,521.20 – ₹2,419.95
Recent High: ₹1,964.70 on October 10, 2025
📊 Key Technical Indicators
RSI (14): 47.98 — Neutral, indicating neither overbought nor oversold conditions.
Stochastic RSI (14): 0.13 — Suggests a strong downtrend.
CCI (14): -69.38 — Indicates a downtrend.
MACD (12,26): 8.68 — Bullish crossover, suggesting upward momentum.
ADX (14): 30.75 — Indicates a strong trend.
Williams %R: -38.13 — Bullish, but not yet in the overbought zone.
ATR (14): 19.24 — High volatility.
ROC (12): 1.89 — Positive, indicating upward momentum.
Bull/Bear Power (13): 55.87 — Indicates bullish strength.
🔍 Analysis Summary
The stock is currently trading near its recent high, with technical indicators showing a mix of bullish and neutral signals. The RSI and Stochastic RSI suggest a neutral to slightly bearish short-term outlook, while the MACD, ADX, and Williams %R indicate potential for continued upward momentum. The high ATR value points to increased volatility, which traders should consider when making decisions.
Retail Trading Profits: Success in the Modern Financial Market Understanding Retail Trading
Retail traders participate in financial markets primarily through brokerage accounts, online trading platforms, and mobile applications. Their decisions are often guided by technical analysis, market news, financial statements, and social trading trends. Unlike institutional traders, who have access to advanced analytical tools, high-frequency trading systems, and large capital, retail traders rely on individual research, risk management, and discipline to generate profits.
Retail trading profits are influenced by:
Market Knowledge: Understanding how markets operate, the forces driving price movements, and economic indicators.
Risk Management: Controlling losses through stop-loss orders, position sizing, and portfolio diversification.
Trading Strategy: Choosing approaches such as day trading, swing trading, trend following, or options trading.
Psychology: Maintaining emotional discipline to avoid impulsive decisions driven by fear or greed.
Key Sources of Retail Trading Profits
1. Stock Market Trading
Retail traders often focus on equity markets. Profits arise from buying undervalued stocks and selling them at higher prices or leveraging derivatives like options and futures. Retail traders can target dividends, capital gains, or a combination of both.
2. Derivatives and Options
Options and futures provide opportunities for magnified profits but also carry significant risks. Retail traders can profit from market movements without owning the underlying asset by employing strategies such as:
Call and Put Options: Speculating on price increases or decreases.
Spreads and Straddles: Hedging risk while capitalizing on volatility.
Leverage: Using borrowed capital to amplify returns, which can also amplify losses.
3. Forex Trading
Retail forex trading involves currency pairs. Traders earn profits from exchange rate fluctuations by leveraging global economic news, interest rate decisions, and geopolitical developments.
4. Cryptocurrency Trading
The rise of cryptocurrencies has created volatile markets with potential for high returns. Retail traders profit through short-term trading or long-term holdings, often using technical indicators to identify price patterns.
5. Commodity Trading
Gold, silver, oil, and agricultural commodities provide alternative avenues for retail trading profits. Commodity trading relies on understanding global supply-demand dynamics and macroeconomic trends.
Strategies for Achieving Retail Trading Profits
1. Technical Analysis
Retail traders extensively use charts, indicators, and historical price data to predict market movements. Common tools include:
Moving Averages
Relative Strength Index (RSI)
Bollinger Bands
Fibonacci Retracements
Technical analysis helps traders identify entry and exit points, momentum, and trend reversals.
2. Fundamental Analysis
This involves evaluating the intrinsic value of stocks or assets based on financial statements, earnings reports, economic indicators, and industry trends. Retail traders use fundamental analysis to make long-term investment decisions rather than short-term speculation.
3. Risk Management
Profitable retail traders focus on protecting capital. Effective strategies include:
Setting stop-loss and take-profit levels
Diversifying across asset classes
Avoiding over-leverage
Limiting exposure to single trades
4. Trading Psychology
The psychological aspect of trading is crucial for consistent profits. Retail traders must control emotions, maintain discipline, and avoid chasing losses. Successful traders develop routines, journaling practices, and mental frameworks to stay objective.
Challenges to Retail Trading Profits
Despite the opportunities, retail trading is fraught with challenges:
High Competition: Retail traders compete with institutional investors who have better tools, information, and capital.
Emotional Biases: Fear, greed, and overconfidence can lead to impulsive trades and losses.
Market Volatility: Unpredictable market swings can wipe out gains quickly.
Information Overload: Excessive news and social media chatter can create confusion and poor decision-making.
Overtrading: Frequent trades in search of profits often lead to higher costs and lower net returns.
Best Practices for Maximizing Retail Trading Profits
Develop a Trading Plan: Clearly define goals, risk tolerance, and strategies.
Continuous Learning: Stay updated with market trends, technical tools, and financial news.
Use Demo Accounts: Practice strategies without risking real capital.
Leverage Technology: Use algorithmic tools, trading apps, and analytics to enhance decision-making.
Focus on Discipline: Stick to your plan, control emotions, and maintain realistic profit expectations.
Regular Review: Analyze past trades to learn from mistakes and refine strategies.
Conclusion
Retail trading profits are achievable, but they require a combination of knowledge, strategy, discipline, and risk management. While the potential for financial gain is significant, the challenges are equally formidable. By understanding the markets, employing structured strategies, managing risks, and cultivating strong trading psychology, retail traders can navigate market complexities and improve the probability of long-term profitability.

Technology and Innovation in TradingEvolution of Trading Technology
1. Traditional Trading Systems
Historically, trading took place in physical marketplaces, where brokers and traders shouted bids and offers in open-outcry systems. Transactions were manually recorded, and information flow was slow, leading to inefficiencies and higher transaction costs. Human error was common, and market participation was restricted to those with access to these trading floors.
2. The Advent of Electronic Trading
The 1970s and 1980s witnessed the gradual introduction of electronic trading systems. The New York Stock Exchange (NYSE) and NASDAQ pioneered computerized order matching systems, allowing buy and sell orders to be executed faster and more accurately. Electronic trading reduced human intervention, minimized errors, and increased market liquidity.
3. High-Frequency and Algorithmic Trading
The next major leap came with high-frequency trading (HFT) and algorithmic trading. Using sophisticated algorithms and ultra-low latency networks, HFT firms can execute thousands of trades in milliseconds. Algorithms analyze market data, predict price movements, and execute trades without human involvement, generating substantial profits through speed and precision. Algorithmic trading has also enabled strategies like statistical arbitrage, trend following, and market making, which were previously impossible in manual trading systems.
Technological Innovations in Trading
1. Trading Platforms and Software
Modern trading platforms provide an integrated environment for analysis, execution, and portfolio management. Platforms like MetaTrader, Interactive Brokers, and Thinkorswim offer real-time market data, technical analysis tools, and automated trading options. Cloud-based platforms have further enhanced accessibility, allowing traders to operate from anywhere with an internet connection.
2. Artificial Intelligence and Machine Learning
AI and machine learning are transforming trading by enabling predictive analytics, risk management, and strategy optimization. Machine learning models can detect patterns in historical and real-time data, predict market trends, and suggest optimal trading strategies. AI-driven robo-advisors provide automated portfolio management, offering personalized investment advice at lower costs compared to traditional advisors.
3. Blockchain and Distributed Ledger Technology
Blockchain technology has introduced transparency, security, and efficiency to trading, especially in digital assets. By enabling decentralized trading, blockchain reduces reliance on intermediaries, lowers transaction costs, and prevents fraud. Smart contracts allow for automated execution of trades when certain conditions are met, enhancing trust and reliability in trading systems.
4. Big Data and Analytics
The availability of massive datasets, including market prices, social media sentiment, and economic indicators, has fueled the rise of data-driven trading strategies. Big data analytics enables traders to identify market anomalies, detect trends, and make informed decisions. Sentiment analysis, for example, uses AI to analyze social media and news feeds to gauge market sentiment and predict price movements.
5. Cloud Computing and Connectivity
Cloud computing allows traders and financial institutions to access powerful computing resources without investing heavily in infrastructure. Cloud-based solutions provide scalable data storage, faster processing of complex algorithms, and global connectivity, enabling international trading with minimal latency.
6. Mobile and Online Trading
The rise of mobile trading applications has democratized access to financial markets. Traders and investors can now buy, sell, and monitor assets using smartphones and tablets. Online trading platforms also provide educational resources, market insights, and social trading networks, connecting retail investors to institutional-level tools.
Innovative Trading Strategies Enabled by Technology
1. Algorithmic Trading
Algorithmic trading leverages automated strategies to execute trades based on predefined rules. These strategies can incorporate technical indicators, statistical models, and even AI predictions. Algorithms reduce emotional biases, ensure discipline, and can operate 24/7 in global markets.
2. Quantitative Trading
Quantitative trading relies on mathematical models to identify profitable trading opportunities. By analyzing historical data and market patterns, quantitative traders can develop models that predict price movements and optimize portfolio returns.
3. Social Trading and Copy Trading
Social trading platforms allow investors to follow and replicate the trades of experienced traders. This innovation combines community insights with technology, enabling retail investors to benefit from professional strategies without deep market knowledge.
4. Cryptocurrency and Digital Asset Trading
The emergence of cryptocurrencies has created new trading paradigms. Digital asset exchanges leverage blockchain, smart contracts, and secure wallets to enable 24/7 trading. Technologies like decentralized finance (DeFi) platforms and tokenized assets have further expanded trading possibilities.
Impact of Technology on Market Efficiency
1. Speed and Liquidity
Technological innovations have drastically reduced execution times, increased trade volumes, and enhanced liquidity. High-frequency trading, electronic order books, and global connectivity allow markets to function more smoothly and efficiently.
2. Transparency and Accessibility
Digital platforms provide real-time data, charting tools, and news feeds, making markets more transparent. Retail investors now have access to tools that were once reserved for institutional players, leveling the playing field.
3. Risk Management
Advanced analytics, AI-driven forecasting, and automated stop-loss orders help traders manage risks more effectively. Portfolio optimization algorithms can assess multiple scenarios, ensuring better hedging against market volatility.
4. Reduced Costs
Technology reduces the need for intermediaries, lowers transaction fees, and optimizes operational processes. This makes trading more affordable and accessible to a broader population.
Challenges and Risks
Despite the advantages, technology-driven trading comes with challenges:
System Failures and Latency Risks: Technical glitches in trading platforms can cause significant losses.
Cybersecurity Threats: Increased connectivity exposes traders and institutions to hacking and fraud.
Market Volatility: High-frequency and algorithmic trading can amplify volatility during market stress.
Regulatory Concerns: Rapid technological changes often outpace regulatory frameworks, creating compliance challenges.
Future Trends
Integration of AI and Quantum Computing: Quantum computing promises to revolutionize trading by solving complex optimization problems far faster than current systems.
Expansion of Digital Assets: Tokenized securities and decentralized finance will create new markets and investment opportunities.
Enhanced Personalization: AI and machine learning will provide tailored trading strategies and recommendations for individual investors.
RegTech Innovations: Technology-driven regulatory solutions will enhance compliance, reporting, and risk monitoring.
Conclusion
Technology and innovation have fundamentally reshaped trading, creating faster, more efficient, and more inclusive financial markets. From electronic trading systems to AI-driven algorithms, blockchain, and mobile platforms, these advancements have empowered traders and investors with unprecedented tools and insights. While risks and challenges remain, the ongoing integration of technology promises continued evolution, driving innovation, transparency, and efficiency in global trading markets.
Exploring Financial Market Types in India1. Money Market
The money market in India deals with short-term funds, typically with maturities of less than one year. It is crucial for maintaining liquidity in the economy, managing short-term financing needs, and implementing monetary policy.
Key Instruments
Treasury Bills (T-Bills): Issued by the government, these are short-term debt instruments with tenures ranging from 91 to 364 days.
Commercial Papers (CPs): Unsecured promissory notes issued by corporations to meet working capital requirements.
Certificate of Deposit (CDs): Issued by banks and financial institutions to mobilize short-term funds.
Call Money & Repo Markets: Enable interbank lending and borrowing to manage daily liquidity.
Participants
Reserve Bank of India (RBI)
Commercial Banks
Financial Institutions
Corporate Treasuries
Significance
Ensures liquidity for businesses and financial institutions.
Helps the RBI in controlling short-term interest rates.
Provides a safe investment avenue for risk-averse investors.
2. Capital Market
The capital market deals with long-term funds for investment in productive assets. It is a key driver of economic growth by mobilizing savings and channeling them into corporate and infrastructure development.
Subcategories
Primary Market: Also known as the new issue market, where companies raise fresh capital through IPOs, FPOs, and rights issues.
Secondary Market: Where existing securities are traded among investors. This includes stock exchanges like BSE (Bombay Stock Exchange) and NSE (National Stock Exchange).
Key Instruments
Equity Shares: Ownership in a company with potential dividends and capital appreciation.
Debentures & Bonds: Debt instruments providing fixed returns over a period.
Mutual Funds & ETFs: Pooled investment vehicles investing in equity, debt, or hybrid instruments.
Participants
Individual and institutional investors
Brokers and stock exchanges
Regulatory authority: Securities and Exchange Board of India (SEBI)
Significance
Provides long-term financing for companies and governments.
Facilitates wealth creation for investors.
Ensures price discovery and liquidity in the equity and debt markets.
3. Derivatives Market
The derivatives market in India allows participants to hedge, speculate, or arbitrage on price movements of underlying assets such as equities, commodities, currencies, or interest rates.
Key Instruments
Futures Contracts: Agreements to buy or sell an asset at a predetermined price and date.
Options Contracts: Give the holder the right (not obligation) to buy or sell an asset at a specific price.
Swaps & Forwards: Customized contracts for interest rate, currency, or commodity management.
Participants
Institutional investors (banks, mutual funds, insurance companies)
Retail investors
Corporates for risk management
Significance
Provides tools to manage risk effectively.
Enhances market efficiency through speculation and hedging.
Offers leverage, allowing participants to amplify potential gains.
4. Foreign Exchange (Forex) Market
The forex market in India deals with buying and selling of foreign currencies, playing a crucial role in trade, investment, and international finance.
Key Instruments
Spot contracts: Immediate delivery of foreign currency.
Forward contracts: Future exchange at pre-determined rates.
Currency swaps: Exchange of principal and interest in different currencies.
Participants
RBI and central banks
Commercial banks
Exporters and importers
Forex brokers
Significance
Facilitates international trade and investment.
Helps in managing currency risk.
Maintains exchange rate stability.
5. Commodity Market
India’s commodity market involves trading in physical goods and standardized contracts, including agriculture, metals, and energy. It ensures price discovery and risk mitigation for producers and consumers.
Key Platforms
Multi Commodity Exchange (MCX)
National Commodity & Derivatives Exchange (NCDEX)
Key Instruments
Futures and options in commodities like gold, crude oil, wheat, and sugar.
Participants
Producers and farmers
Traders and exporters
Hedgers and speculators
Significance
Provides price transparency for commodities.
Enables hedging against price volatility.
Supports agricultural and industrial growth.
Regulatory Framework in India
India’s financial markets are governed by robust regulations to ensure transparency, investor protection, and systemic stability. Key regulators include:
SEBI (Securities and Exchange Board of India): Governs equity and derivatives markets.
RBI (Reserve Bank of India): Manages money and forex markets.
Forward Markets Commission (FMC) (now merged with SEBI): Regulates commodity markets.
Ministry of Finance & Ministry of Corporate Affairs: Oversee fiscal and corporate regulations.
Conclusion
The financial markets in India are diverse, interconnected, and dynamic, catering to different investment horizons, risk appetites, and financial needs. From providing liquidity and short-term financing to enabling long-term investment and hedging, these markets play a vital role in the country’s economic development.
With increasing technological integration, reforms, and global participation, India’s financial markets are evolving rapidly, offering new opportunities for investors and businesses while contributing to overall economic growth.
Option Trading Derivatives (FAO)1. Introduction to FAO
FAO stands for Futures and Options, two major categories of derivatives. Derivatives are financial contracts whose value depends on an underlying asset, such as stocks, indices, commodities, currencies, or interest rates. The primary purpose of derivatives is to provide risk management, speculation, and arbitrage opportunities.
Key Features of FAO:
Leverage: Traders can control large positions with relatively small capital.
Hedging: Protect against adverse price movements in underlying assets.
Speculation: Profit from both rising and falling markets.
Liquidity: Popular derivatives are highly liquid, allowing easy entry and exit.
2. Understanding Options
Options are contracts that give the buyer the right, but not the obligation, to buy or sell an underlying asset at a predetermined price (strike price) before or on a specific date (expiry date). There are two primary types of options:
Call Option: Gives the holder the right to buy the underlying asset at a fixed price.
Put Option: Gives the holder the right to sell the underlying asset at a fixed price.
Key Terminology:
Strike Price: Price at which the option can be exercised.
Premium: Price paid to purchase the option.
Expiry Date: Date on which the option contract becomes invalid.
In-the-Money (ITM), Out-of-the-Money (OTM), At-the-Money (ATM): Terms describing the relationship between the strike price and current market price.
Options provide flexibility and multiple strategies for traders, allowing them to maximize profits or minimize losses.
3. Understanding Futures
Futures are standardized contracts that oblige the buyer to purchase and the seller to sell an asset at a predetermined price and date. Unlike options, futures contracts carry an obligation to buy or sell, not just a right. They are widely used in commodities, indices, currencies, and interest rate markets.
Key Features:
Leverage: Futures allow traders to control large positions with a fraction of the total contract value.
Mark-to-Market: Daily settlement of gains and losses ensures liquidity and transparency.
Hedging and Speculation: Corporations hedge against price fluctuations, while traders speculate on market direction.
4. FAO Trading Mechanics
Trading FAO requires understanding market participants, contract specifications, and trading platforms.
Market Participants:
Hedgers: Minimize risk exposure. Example: Farmers selling crop futures.
Speculators: Profit from market movements. Example: Traders buying stock options.
Arbitrageurs: Exploit price differences across markets.
Contract Specifications:
Lot Size: Minimum quantity for trading a contract.
Expiry Cycle: Monthly or weekly expirations.
Margin Requirements: Funds required to maintain positions.
Trading FAO occurs on regulated exchanges, such as NSE, BSE, CME, and ICE, providing standardized contracts, clearing mechanisms, and transparent pricing.
5. FAO Trading Strategies
5.1 Option Strategies:
Covered Call: Holding underlying shares and selling call options to earn premium.
Protective Put: Buying a put option to protect against downside risk.
Straddle: Buying call and put options simultaneously to profit from volatility.
Iron Condor: Combining multiple options to profit from low volatility.
5.2 Futures Strategies:
Hedging: Lock in future prices to mitigate risk.
Speculation: Taking positions to profit from expected price movements.
Spread Trading: Buying and selling related futures to benefit from relative price changes.
6. Risk Management in FAO
Trading derivatives involves high risk due to leverage and market volatility. Effective risk management strategies include:
Setting Stop-Loss Orders: Automatically exit losing trades.
Position Sizing: Allocate only a fraction of capital to each trade.
Diversification: Spread exposure across assets and strategies.
Volatility Analysis: Understand implied and historical volatility for better decision-making.
7. Advantages of FAO Trading
Leverage for Higher Returns: Small capital can control large positions.
Hedging Capabilities: Protect investments from market swings.
Flexibility and Variety: Multiple strategies suit different market conditions.
Transparency and Regulation: Exchange-traded derivatives ensure standardized practices.
8. Challenges and Risks
High Volatility: Prices can move quickly against traders.
Complexity: Advanced knowledge is required for strategy execution.
Margin Calls: Traders may need to deposit additional funds if losses occur.
Liquidity Risk: Not all options or futures are highly liquid.
9. Regulatory Environment
FAO markets are tightly regulated to protect investors:
Securities and Exchange Board of India (SEBI) regulates derivatives trading in India.
Commodity Futures Trading Commission (CFTC) and SEC regulate U.S. markets.
Exchange Rules: Each exchange sets contract specifications, margin requirements, and trading hours.
10. Practical Examples of FAO Trading
Hedging Example: A wheat farmer sells wheat futures to lock in a price before harvest.
Speculation Example: A trader buys Nifty call options expecting an upward movement.
Volatility Trading: Traders implement straddles and strangles during earnings season to profit from price swings.
11. Technology and FAO
Modern FAO trading relies heavily on algorithmic trading, AI analytics, and real-time data. Platforms offer:
Option Chain Analysis: View all available options for a stock or index.
Greeks Monitoring: Delta, Gamma, Theta, Vega – to understand option sensitivity.
Risk Management Tools: Automated alerts and portfolio analytics.
12. Conclusion
Option trading derivatives (FAO) represent a powerful set of financial instruments that combine leverage, flexibility, and risk management. While they provide opportunities for profit maximization, they also carry substantial risks, making knowledge, discipline, and strategy essential. Successful FAO trading requires understanding market mechanics, advanced strategies, and effective risk management to harness the potential of these derivatives responsibly.
Introduction to Stock Market Investing1. Understanding the Stock Market
The stock market is a complex network of exchanges where buyers and sellers trade shares of publicly held companies. It functions similarly to an auction system, with prices determined by supply and demand. Major stock exchanges globally include the New York Stock Exchange (NYSE), NASDAQ, London Stock Exchange (LSE), and in India, the National Stock Exchange (NSE) and Bombay Stock Exchange (BSE).
1.1 Role of the Stock Market
Capital Formation: Companies raise funds for expansion and operations by issuing shares.
Liquidity: Investors can easily buy or sell shares, providing flexibility and access to cash.
Price Discovery: The stock market reflects the perceived value of companies based on performance, future prospects, and investor sentiment.
Economic Indicator: Stock market trends often indicate the economic health of a country.
2. Types of Stock Market Investments
Investing in stocks is not a one-size-fits-all approach. Different investment types cater to varied risk appetites, time horizons, and financial goals.
2.1 Common Stocks
Common stocks represent ownership in a company and provide voting rights in shareholder meetings. Investors earn returns primarily through:
Capital Gains: Selling shares at a higher price than purchased.
Dividends: Periodic earnings distributed by the company.
2.2 Preferred Stocks
Preferred stocks are a hybrid between bonds and common stocks. They provide fixed dividends and have priority over common stocks in case of liquidation but usually lack voting rights.
2.3 Bonds
Though technically not stocks, bonds are debt instruments issued by companies or governments. Investors receive interest and principal repayment. Bonds are considered safer than stocks but typically offer lower returns.
2.4 Mutual Funds and ETFs
For beginners, mutual funds and exchange-traded funds (ETFs) provide a diversified investment portfolio managed by professionals. Mutual funds pool money from multiple investors to buy a mix of stocks, bonds, or other assets. ETFs, traded like stocks, track specific indices, sectors, or commodities.
2.5 Derivatives
Derivatives such as options and futures derive value from underlying assets like stocks. They are advanced tools used for hedging or speculative purposes and carry higher risk.
3. Basics of Stock Market Analysis
Successful investing requires analysis to make informed decisions. There are two main approaches:
3.1 Fundamental Analysis
Fundamental analysis evaluates a company’s intrinsic value by examining:
Financial Statements: Balance sheets, income statements, and cash flow statements.
Profitability Ratios: Return on equity, profit margins.
Growth Prospects: Revenue growth, market share, and industry trends.
Economic Conditions: Interest rates, inflation, and overall economic climate.
The goal is to identify undervalued stocks for long-term investment.
3.2 Technical Analysis
Technical analysis studies price movements and trading volumes using charts and statistical indicators. Key tools include:
Moving Averages: Identify trends over time.
Relative Strength Index (RSI): Measures overbought or oversold conditions.
Support and Resistance Levels: Price points where stocks typically reverse trends.
This approach is often preferred by traders focusing on short-term price movements.
4. Stock Market Strategies
Different investors adopt varying strategies based on their risk tolerance, investment horizon, and financial goals.
4.1 Long-Term Investing
Long-term investors, or “buy-and-hold” investors, focus on companies with strong fundamentals and growth potential. They tolerate short-term market volatility for wealth accumulation over years.
4.2 Dividend Investing
Investors seeking regular income invest in companies with consistent dividend payouts. Dividend reinvestment can significantly boost wealth over time.
4.3 Growth Investing
Growth investors target companies expected to grow faster than the market. These companies may not pay dividends, focusing instead on reinvesting profits to expand operations.
4.4 Value Investing
Value investors look for stocks trading below their intrinsic value. By analyzing fundamentals, they aim to buy undervalued stocks and benefit from price corrections over time.
4.5 Momentum and Day Trading
Active traders use momentum strategies to capitalize on short-term trends, while day traders buy and sell within the same day. These strategies require technical analysis, speed, and discipline.
5. Risk Management in Stock Investing
Investing in the stock market comes with risks. Effective risk management helps protect capital and improve long-term returns.
5.1 Types of Risk
Market Risk: Fluctuations due to economic or political events.
Company Risk: Poor performance or scandals affecting a particular company.
Liquidity Risk: Difficulty in selling shares quickly at desired prices.
Inflation Risk: Rising inflation reducing real returns.
Interest Rate Risk: Changes in interest rates affecting market valuations.
5.2 Risk Mitigation Strategies
Diversification: Spread investments across sectors and asset classes.
Asset Allocation: Balance between stocks, bonds, and cash based on risk appetite.
Stop-Loss Orders: Automatically sell stocks when they fall below a certain price.
Regular Review: Monitor portfolio performance and rebalance periodically.
6. Behavioral Aspects of Investing
Stock market investing is not purely analytical; psychology plays a critical role. Behavioral finance studies how emotions influence decision-making.
6.1 Common Investor Biases
Overconfidence: Believing one can predict the market accurately.
Herd Mentality: Following trends without independent analysis.
Loss Aversion: Fear of losses leading to poor decision-making.
Recency Bias: Giving more weight to recent market events than historical data.
6.2 Developing the Right Mindset
Successful investors cultivate patience, discipline, and long-term thinking. Emotional control during market volatility is key to avoiding impulsive decisions.
7. Tools and Resources for Investors
Investors have access to numerous tools and resources to make informed decisions:
Stock Screeners: Identify potential investment opportunities.
Financial News Portals: Bloomberg, Reuters, and Moneycontrol provide up-to-date market information.
Research Reports: Detailed analysis from brokerage firms.
Investment Apps: Platforms for trading and portfolio management.
8. Regulatory Framework and Investor Protection
Stock markets operate under strict regulations to ensure transparency, fairness, and investor protection. Key regulatory bodies include:
SEBI (India): Securities and Exchange Board of India.
SEC (USA): Securities and Exchange Commission.
FCA (UK): Financial Conduct Authority.
Investor protection measures include disclosure requirements, insider trading regulations, and grievance redressal mechanisms.
9. Advantages and Challenges of Stock Market Investing
9.1 Advantages
Potential for high returns compared to traditional savings instruments.
Liquidity and ease of buying/selling shares.
Opportunity to participate in the growth of leading companies.
Diversification through mutual funds, ETFs, and global markets.
9.2 Challenges
Market volatility can lead to short-term losses.
Requires knowledge and research to avoid poor investments.
Emotional stress due to fluctuating market conditions.
Exposure to macroeconomic and geopolitical risks.
10. Steps to Begin Investing
Starting with stock market investing requires a structured approach:
Set Financial Goals: Determine short-term and long-term objectives.
Learn Basics: Understand financial statements, market indices, and investment types.
Choose Investment Platform: Open a brokerage or demat account.
Start Small: Begin with small investments and gradually increase exposure.
Diversify Portfolio: Invest across sectors and asset classes.
Monitor and Adjust: Review performance and adapt strategies as needed.
Stay Informed: Keep updated with market trends, news, and economic indicators.
Conclusion
Stock market investing offers a powerful avenue for wealth creation but requires knowledge, discipline, and patience. From understanding market mechanics to analyzing stocks, adopting strategies, managing risks, and overcoming behavioral biases, a well-rounded approach increases the likelihood of long-term success. By starting early, investing wisely, and staying informed, investors can harness the full potential of the stock market to achieve their financial goals.
Crypto Asset SecretsUnlocking the Hidden Opportunities in Digital Wealth.
1. Understanding Crypto Assets: Beyond Bitcoin
At the heart of the crypto revolution is Bitcoin, introduced in 2009 by the mysterious Satoshi Nakamoto. However, the crypto universe has grown exponentially to include thousands of digital assets, each with unique functions and investment profiles.
Crypto assets can generally be categorized into three main types:
Cryptocurrencies: Digital currencies like Bitcoin (BTC) and Litecoin (LTC) primarily function as stores of value and mediums of exchange.
Utility Tokens: These tokens power decentralized applications (dApps) and provide access to services within blockchain ecosystems. Examples include Ethereum (ETH) and Chainlink (LINK).
Security Tokens: Represent ownership in traditional assets like equities or real estate, but in digital form, regulated under security laws.
Secret #1: Understanding the specific type of crypto asset is crucial. Investors often make the mistake of treating all digital assets as interchangeable, but their underlying purposes, risk profiles, and regulatory status can vary dramatically.
2. Blockchain Technology: The Foundation of Crypto Assets
The real innovation behind crypto assets is blockchain technology, a decentralized ledger system that allows transparent, secure, and tamper-proof recording of transactions.
Key aspects include:
Decentralization: Eliminates the need for central authorities, reducing the risk of manipulation.
Transparency: Every transaction is recorded on a public ledger, fostering accountability.
Security: Cryptography ensures data integrity, preventing unauthorized changes.
Secret #2: Mastery of blockchain fundamentals provides a competitive advantage. Knowing how blockchain networks operate, their consensus mechanisms (Proof of Work, Proof of Stake), and smart contract functionalities allows investors to assess the true potential and limitations of a crypto asset.
3. The Psychology of Crypto Markets
Crypto markets are notoriously volatile, influenced by a mixture of technological developments, investor sentiment, regulatory announcements, and macroeconomic trends. Unlike traditional markets, crypto often experiences rapid price swings, which can be both an opportunity and a risk.
Secret #3: Emotional discipline is a hidden asset in crypto trading. Market hype can lead to FOMO (Fear of Missing Out), while panic-selling may cause unnecessary losses. Successful investors rely on strategic planning, risk management, and long-term vision rather than impulsive reactions.
4. Advanced Crypto Investment Strategies
While buying and holding popular cryptocurrencies is common, there are several sophisticated strategies to leverage crypto assets:
4.1 Staking and Yield Farming
Many blockchains allow holders to stake their coins, helping to secure the network in exchange for rewards. Yield farming involves providing liquidity to decentralized finance (DeFi) protocols, earning interest or additional tokens.
Secret #4: Staking and yield farming can turn idle assets into income-generating tools, but they carry smart contract and liquidity risks.
4.2 Crypto Arbitrage
Crypto prices can differ across exchanges, creating opportunities for arbitrage trading. Skilled traders exploit these differences to earn profits with minimal market exposure.
Secret #5: Arbitrage requires speed, technical infrastructure, and awareness of transaction fees, making it a secret weapon for professional traders.
4.3 Diversification Across Assets
Unlike traditional portfolios, crypto investors can diversify across various blockchain networks, tokens, and use cases. Balancing between high-risk altcoins and stablecoins can optimize growth while managing volatility.
Secret #6: Diversification in crypto isn’t just about quantity—it’s about understanding the function and ecosystem of each asset, which many retail investors overlook.
5. Security and Custody Secrets
One of the biggest pitfalls for crypto investors is security risk. Unlike banks, cryptocurrency wallets are self-custodied, and loss of private keys means loss of access to funds.
Key security practices include:
Hardware Wallets: Offline storage that prevents hacks.
Multi-Signature Wallets: Require multiple approvals for transactions, enhancing security.
Regular Updates and Vigilance: Phishing attacks, malware, and scams are common.
Secret #7: Knowledge of security practices is as valuable as market knowledge. Investors who neglect custody measures risk losing everything in an instant.
6. Regulatory Landscape: The Hidden Rules
Crypto regulation varies widely across countries, affecting taxation, legality, and trading possibilities. Some regions encourage crypto innovation, while others impose strict restrictions.
Secret #8: Awareness of regulatory shifts is critical. A promising investment in one jurisdiction could face sudden legal constraints in another. Understanding KYC/AML requirements, tax obligations, and cross-border laws is part of long-term crypto strategy.
7. DeFi, NFTs, and Emerging Crypto Opportunities
Beyond traditional cryptocurrencies, the crypto world hosts DeFi (Decentralized Finance), NFTs (Non-Fungible Tokens), and other innovative structures. These ecosystems offer unique ways to create value and income:
DeFi Lending and Borrowing: Earn interest or borrow assets without intermediaries.
NFTs and Digital Collectibles: Represent digital ownership and can appreciate significantly.
Cross-Chain Projects: Enable interoperability between different blockchains, expanding opportunities.
Secret #9: Understanding these emerging sectors allows investors to spot early trends before they hit mainstream attention.
8. Market Analysis Tools and Metrics
Knowledge of market analysis is essential for making informed decisions. Key indicators include:
On-Chain Metrics: Number of active addresses, transaction volume, and token supply data.
Technical Analysis: Chart patterns, moving averages, RSI, and volume trends.
Sentiment Analysis: Social media, news trends, and community activity can predict price movements.
Secret #10: Combining quantitative data with qualitative insights gives investors an edge in anticipating market behavior.
9. Common Mistakes and How to Avoid Them
Even experienced investors fall into traps:
Chasing Hype: Buying based on social media trends rather than fundamentals.
Neglecting Research: Ignoring the technology, team, and roadmap of a project.
Over-Leverage: Using borrowed funds recklessly, which can amplify losses.
Secret #11: A disciplined approach, informed by research and risk management, is what separates successful crypto investors from the majority who fail.
10. The Future of Crypto Assets
The crypto landscape is still evolving. Some of the likely trends include:
Central Bank Digital Currencies (CBDCs): Governments exploring digital fiat currencies.
Institutional Adoption: Greater participation from banks, hedge funds, and corporations.
Integration with Traditional Finance: More bridges between DeFi and conventional markets.
Enhanced Privacy Solutions: Technologies like zero-knowledge proofs improving anonymity.
Secret #12: Staying ahead of the curve requires continuous learning, technical understanding, and strategic foresight. The most profitable opportunities often lie where the market is least developed.
Conclusion
Crypto assets are more than just speculative instruments—they are a new class of digital wealth with enormous potential, hidden risks, and untapped opportunities. By understanding their underlying technology, market psychology, investment strategies, and regulatory landscape, investors can unlock the “secrets” that separate successful participants from those who fail.
The ultimate secret of crypto assets isn’t just knowing which coins to buy—it’s mastering knowledge, discipline, security, and foresight. Those who embrace these principles are the ones who can navigate this volatile, exciting, and revolutionary market with confidence and success.
Decoding Market Movements with Volume ProfileWhat is Volume Profile?
Volume Profile is a graphical representation of the amount of trading volume that has occurred at various price levels over a specified period. Unlike traditional volume bars that are plotted at the bottom of a price chart (showing volume over time), Volume Profile displays volume horizontally across price levels, highlighting where the most trading activity occurred.
This is critical because it helps identify price acceptance and rejection zones — areas where traders were most or least interested in transacting. These zones often become future levels of support and resistance.
Core Components of Volume Profile
Point of Control (POC):
This is the price level at which the highest volume of trading occurred within the selected time frame. The POC acts as a “magnet” for price and often represents a fair value area where both buyers and sellers have agreed most.
Value Area (VA):
This is the range of prices that contains around 70% of the total traded volume. It indicates where the majority of trading took place and is divided into:
Value Area High (VAH): The upper boundary of the value area.
Value Area Low (VAL): The lower boundary of the value area.
Prices moving outside this range suggest either overvaluation or undervaluation in the short term.
High Volume Nodes (HVN):
These are zones with concentrated trading activity. They signify strong price acceptance and tend to act as support or resistance.
Low Volume Nodes (LVN):
These are price levels with very little trading activity, showing price rejection zones. When price revisits these areas, it often experiences quick movement due to a lack of liquidity.
How Volume Profile Differs from Traditional Volume Indicators
Traditional volume indicators, such as the volume histogram or On-Balance Volume (OBV), show how much volume occurred over time but do not indicate at which prices the volume took place. Volume Profile, on the other hand, provides a spatial context — revealing where the big players entered or exited the market.
This distinction is vital because markets are driven by institutional traders who operate at specific price levels. By analyzing these price-based volume concentrations, retail traders can align themselves with “smart money” and anticipate key turning points.
Using Volume Profile in Market Analysis
1. Identifying Market Structure
Volume Profile helps traders classify the market into balance (range-bound) and imbalance (trending) conditions.
In a balanced market, volume is evenly distributed, and the price rotates around the POC.
In an imbalanced market, volume shifts in one direction, signaling a new trend or breakout.
Recognizing these conditions early allows traders to adjust strategies — employing mean reversion in balanced phases and trend-following in imbalanced phases.
2. Spotting Support and Resistance Levels
Volume clusters (HVNs) often become key support and resistance zones. When price moves back toward these areas, it may pause or reverse, as these levels represent heavy institutional interest. Conversely, LVNs are potential breakout zones, where prices move swiftly due to a lack of opposing orders.
For example:
If the price rises above VAH with strong volume, it signals bullish conviction.
If it falls below VAL with heavy volume, it indicates bearish strength.
3. Detecting Institutional Activity
Institutions trade in large volumes, and their footprints are visible on the Volume Profile. When you see a large volume concentration forming abruptly, it’s often the result of institutional accumulation or distribution. Understanding these patterns can help traders anticipate future price moves.
For instance:
Accumulation: Heavy volume at the bottom of a range followed by upward price movement.
Distribution: Heavy volume at the top of a range followed by a downward trend.
4. Volume Profile and Trend Confirmation
When analyzing trends, Volume Profile confirms whether price movements are supported by strong participation.
In an uptrend, increasing volume at higher price levels suggests healthy demand.
In a downtrend, higher volume at lower prices confirms strong selling pressure.
If volume weakens during trend continuation, it may signal an impending reversal.
Integrating Volume Profile with Other Technical Tools
To enhance accuracy, traders often combine Volume Profile with complementary tools such as:
Moving Averages:
Identify overall trend direction, while Volume Profile reveals strong price zones within that trend.
Price Action Analysis:
Combine candlestick patterns (like pin bars or engulfing candles) with volume zones to spot high-probability entries.
Market Profile (TPO Charts):
While Volume Profile shows volume distribution, Market Profile displays time spent at each price level, offering a deeper understanding of market behavior.
Fibonacci Retracements:
When Fibonacci levels align with HVNs or LVNs, the confluence strengthens potential reversal zones.
Volume Profile Across Different Markets
Stock Market:
In equities, Volume Profile reveals where institutional buying or selling occurred. It helps traders determine entry levels during consolidations and exit points during rallies.
Futures Market:
Futures traders rely heavily on Volume Profile to identify fair value zones. Exchanges provide accurate volume data, making this tool extremely effective for intraday and positional analysis.
Forex Market:
Though Forex lacks centralized volume data, many platforms offer tick volume approximations. Even this limited data, when analyzed with price levels, gives valuable market insights.
Cryptocurrency Market:
In crypto trading, where volatility is high, Volume Profile helps traders detect zones of high liquidity and potential breakout points.
Practical Trading Strategies Using Volume Profile
1. Reversion to Mean (POC Bounce) Strategy
Wait for price to move away from POC and show exhaustion.
Enter trade when price starts reverting back toward POC.
Use VAH and VAL as targets and stop-loss zones.
2. Breakout and Retest Strategy
Identify LVN or VAL/VAH breakout levels.
Wait for the price to retest these zones with declining volume.
Enter in the direction of the breakout, using the next volume node as the target.
3. Volume Gap Play
When there’s a visible volume gap between two HVNs, it indicates a low liquidity zone.
If price enters this gap, it usually moves quickly until it reaches the next high-volume area.
4. Intraday Volume Profile Setup
Use smaller time-frame profiles (like 5-min or 15-min sessions).
Identify session POCs and value areas.
Trade pullbacks to these zones in alignment with overall market bias.
The Psychology Behind Volume Profile
Volume Profile doesn’t just show numbers — it visualizes market psychology. Every spike or dip in volume tells a story about traders’ emotions:
High-volume zones reflect equilibrium — agreement between buyers and sellers.
Low-volume zones reflect indecision or rejection — a lack of conviction.
Shifts in volume concentration reveal sentiment transitions, such as greed turning to fear or vice versa.
By interpreting these patterns, traders can anticipate how collective behavior might drive the next market phase.
Advantages of Using Volume Profile
Provides clear visual representation of where the real market interest lies.
Identifies hidden support and resistance levels ignored by conventional indicators.
Helps understand institutional footprints and market intent.
Offers flexibility across all markets and time frames.
Encourages data-driven trading decisions instead of emotional impulses.
Limitations of Volume Profile
Despite its effectiveness, traders must remain aware of its constraints:
It requires accurate volume data — not always available in decentralized markets.
Works best when combined with other technical tools.
Interpretation can be subjective; novice traders might misread key zones.
In fast-moving or news-driven markets, volume analysis may lag behind price action.
Conclusion
The Volume Profile is not just another indicator; it’s a comprehensive framework for understanding how markets truly function. By revealing the invisible dynamics of supply and demand, it allows traders to see beyond surface-level price movements. When integrated with disciplined market analysis, it becomes a strategic advantage — helping identify fair value, detect institutional participation, and forecast future price direction with greater confidence.
In today’s algorithm-driven trading environment, those who understand where and why volume accumulates can anticipate market turns before they happen. Whether you’re a short-term scalper, swing trader, or long-term investor, mastering the Volume Profile can transform your market perspective — turning raw data into actionable insight and uncertainty into opportunity.
Part 2 Intraday Master ClassTraders use options for three main purposes:
Hedging: Investors use options to protect their portfolios from adverse price movements. For example, owning a put option can protect a stock investor from a market downturn.
Speculation: Traders buy or sell options to profit from expected movements in asset prices. Since options require a smaller initial investment compared to buying stocks directly, they offer higher potential returns—but also higher risk.
Income Generation: Many investors sell (write) options to earn premiums regularly. For example, covered call writing is a popular income strategy where investors sell call options on stocks they already own.
While options offer leverage and flexibility, they also carry risks—especially for sellers. The maximum loss for an option buyer is limited to the premium paid, but an option seller’s potential loss can be unlimited if the market moves sharply against them.
