STARHEALTH 1 Week Time Frame 📊 Weekly Price Range (1‑Week History)
High (last week): ~₹469.8
Low (last week): ~₹442.45
(Source: Marketscreener weekly price extremes)
📌 Key Weekly Support Levels
Support zones you may watch on the weekly timeframe:
1. Support 1: ~₹440–₹442 (recent weekly low)
2. Support 2: ~₹430 area (round‑number psychological / pivot cluster)
3. Support 3: ~₹408–₹415 range (broader structural support from pivot supports seen on shorter pivots)
Weakness below ₹430 could open the lower band towards ₹405–₹410.
📌 Key Weekly Resistance Levels
Potential weekly resistance zones to monitor:
1. Resistance 1: ~₹470–₹472 (recent weekly highs & EMA cluster)
2. Resistance 2: ~₹480–₹485 (psychological and medium MA area)
3. Resistance 3: ~₹495+ (upper pivot / longer‑term range top)
A weekly close above ₹480–₹485 would indicate stronger upside pressure.
📈 Technical Indicator Context (Weekly)
RSI and weekly momentum indicators on some platforms suggest neutral‑to‑slightly bullish conditions rather than extreme overbought levels.
Weekly pivot and moving average positions (when available) confirm ₹462–₹470 as an important zone for bullish continuation.
Tradingopportunity

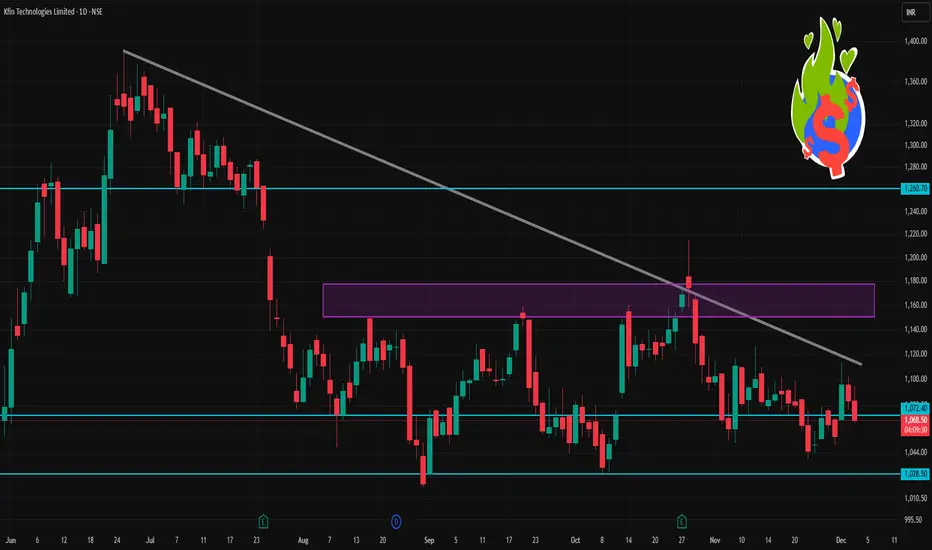
KFINTECH 1 Day Time Frame 📊 Current Snapshot (as of right now)
Reported day’s trading‑range so far: ~ ₹ 1,066.70 (low) to ~ ₹ 1,095.00 (high)
Opening price: ~ ₹ 1,083.80
Previous close: ~ ₹ 1,083.40
Market‑wide context: 52‑week high ~ ₹ 1,641.35, 52‑week low ~ ₹ 784.15
📌 Key Intraday / Short‑Term Levels (Classic Pivot‑Style)
Using the standard pivot‑point formula (Pivot = (High + Low + Close)/3) plus support/resistance calculations.
Here’s what that yields roughly for today — with High = 1,095.00, Low = 1,066.70, Close (yesterday) ≈ 1,083.40:
Level Approximate Price (₹)
Pivot (PP) ~ 1,081.70
Support 1 (S1) ~ 1,068.40
Support 2 (S2) ~ 1,050.40
Resistance 1 (R1) ~ 1,108.90
Resistance 2 (R2) ~ 1,131.00
Interpretation:
If the price stays above PP (~1,082) — bullish bias; otherwise, cautious/bearish.
S1 (~1,068) may act as “first floor”: if price drops near there and holds, watch for bounce.
A break below S2 (~1,050) might lead to deeper correction or volatility.
On upside, a strong move above R1 (~1,109) could challenge R2 (~1,131).
Part 10 Trade Like InstitutionsBear Put Spread – Best for Mild Downtrend with Controlled Risk
Same concept but for bearish conditions.
How it works
Buy a lower strike put.
Sell a farther out-of-the-money put.
When to use
Expect small to moderate fall.
Want low risk and fixed cost.
Risk and reward
Risk: Limited to net debit (premium).
Reward: Limited but predictable.
Example
Buy Bank Nifty 49,000 PE at ₹150
Sell 48,800 PE at ₹70
Net premium = ₹80
Max profit = 200 – 80 = ₹120

Short-Term vs Long-Term Trading1. What Is Short-Term Trading?
Short-term trading focuses on taking advantage of price movements over a few minutes, hours, or days. The trader’s goal is to profit from short bursts of volatility instead of waiting for long-term trends. Short-term trading includes styles like intraday trading, swing trading, scalp trading, and momentum trading.
Key Characteristics of Short-Term Trading
a) Time Horizon
Short-term trades typically last:
Intraday: minutes to hours
Swing trading: 2–15 days
Momentum trades: until trend exhaustion
The focus is on quick entries and exits.
b) Trading Frequency
Short-term traders execute multiple trades within a week or even within a day. This increases opportunity but also exposure to transaction costs.
c) Dependency on Technical Analysis
Short-term trading relies heavily on:
Candlestick patterns
Indicators like RSI, MACD, Moving Averages
Volume analysis
Chart patterns (flags, triangles, breakouts)
Fundamentals matter less because the time horizon is too short for fundamentals to play out meaningfully.
d) High Volatility, High Risk
Short-term moves are unpredictable. News, events, and market sentiment can cause sharp fluctuations. A trader must always have:
Strict stop-loss
Risk-per-trade limits
High emotional discipline
e) Capital Requirement
Short-term traders often use margin or leverage, which magnifies both returns and losses.
f) Psychological Stress
Watching charts for hours, handling rapid moves, and managing multiple positions can be mentally taxing.
Advantages of Short-Term Trading
Quick returns
Regular trading opportunities
Can profit in any market condition (up, down, sideways)
Requires less capital for margin-based strategies
Disadvantages of Short-Term Trading
High risk from volatility
Stressful and time-intensive
High brokerage and taxation costs
Probability of emotional mistakes is higher
2. What Is Long-Term Trading (Investing)?
Long-term trading—often called investing—focuses on holding positions for months, years, or decades. Instead of reacting to daily volatility, long-term traders focus on the broader economic and business growth cycles.
Key Characteristics of Long-Term Trading
a) Time Horizon
Investments typically last:
Short long-term: 6 months–2 years
Medium-term: 2–5 years
Long-term: 5–20+ years
This approach allows the investor to benefit from company growth, compounding, and market cycles.
b) Dependence on Fundamental Analysis
Long-term strategies depend on:
Financial statements (balance sheet, P&L, cash flow)
Company management quality
Sector growth
Economic cycles
Competitive advantages (moats)
Charts may be used for entry timing but fundamentals drive the decision.
c) Lower Trading Frequency
Investors may make only a handful of trades in a year, reducing cost and stress.
d) Lower Risk Through Compounding
Over time, markets tend to move upward due to economic growth. Long-term investing benefits from:
Compounding returns
Dividend reinvestment
Reduced volatility impact
e) Stable and Manageable Psychology
Investors don’t need to watch markets daily. Long-term patience and discipline are more important than speed.
Advantages of Long-Term Trading
Lower stress
Lower brokerage and tax costs
Lower chance of emotional errors
Wealth compounding over time
Better suited for salaried individuals or busy professionals
Disadvantages of Long-Term Trading
Slow returns
Requires patience
Market crashes can test conviction
Needs good research on fundamentals
3. Key Differences Between Short-Term and Long-Term Trading
Aspect Short-Term Trading Long-Term Trading
Time Horizon Minutes to weeks Years to decades
Analysis Mostly technical Mostly fundamental
Risk Level High due to volatility Lower due to long time frame
Capital Requirement Often less initially, but risky with leverage Usually requires more capital but safer
Frequency of Trades High Low
Tax Impact Higher (short-term capital gains tax) Lower (long-term capital gains tax)
Skills Needed Chart reading, speed, intraday discipline Business analysis, patience, strategic thinking
Psychological Pressure High Moderate to low
Return Pattern Frequent small profits (or losses) Slow, compounding returns
4. Which One Is Better?
There is no universal answer—it depends on the individual’s personality, risk appetite, and goals.
Short-Term Trading Is Better If You:
Enjoy analyzing charts
Can handle high stress
Want frequent trading opportunities
Can dedicate time daily
Have strict risk discipline
Accept that losses are part of the game
Short-term trading can generate quick profits but also quick losses.
Long-Term Trading Is Better If You:
Prefer stable growth
Don’t want to sit in front of charts
Believe in company fundamentals
Want to benefit from compounding
Are patient and disciplined
Want to build long-term wealth
For most people, long-term investing is safer and more rewarding.
5. Which Approach Do Professionals Use?
Many experienced market participants use a hybrid model:
Long-term portfolio for wealth creation
Short-term portfolio for opportunities during volatility
This allows them to enjoy stability while also taking advantage of short-term market movements.
6. Final Thoughts
Short-term and long-term trading represent two different philosophies. Short-term traders rely on speed, chart-reading skills, and rapid decision-making, accepting volatility as a regular challenge. Long-term investors rely on patience, fundamentals, and the power of compounding, focusing on the broader picture instead of daily price movements.
Both strategies can be profitable if executed correctly. The key is to choose the one that matches your personality, lifestyle, and financial objectives. A disciplined long-term investor can steadily build wealth, while a skilled short-term trader can generate quicker gains—but with higher risk.
Ultimately, the best traders and investors are those who understand themselves just as well as they understand the market.

Is Dabur on the Verge of a Big Move? The Chart Holds the Answer!Hello Everyone!
I hope you all are doing great in life and in your trading journey! Today, I’ve brought you a stock that’s as sweet as honey. Yes, you guessed it right, I’m talking about India’s best honey and Ayurvedic products selling company — DABUR.
Dabur has always been known for its strong product lineup in the FMCG sector, with their products being staples in every Indian household. Let's dive into the technical setup and trading idea for Dabur and see if it's ready to provide us with some sweet returns!
Looking at the weekly chart of Dabur India Ltd., the stock has been showing clear price action within well-defined zones. Currently, Dabur is testing a historically strong support zone around the 510-495 range, a level that has previously acted as a reliable bounce area. This zone is crucial to watch, as a hammer candle has formed at this support, signaling a potential bullish reversal . If this support holds again, it could provide a strong buying opportunity.
The strong resistance zone near 660 marks the final target for this move, with a possible upside of around 37.94% . The stock is also showing potential for a swing trade as it approaches a reversal from the support. Keep an eye on price action around these levels to manage your risk effectively.
Disclaimer:- This analysis is for educational purposes only. Please trade responsibly and consult a financial advisor before making any decisions.
If you found this analysis helpful, don’t forget to like, follow, and share your thoughts in the comments below! Your support keeps me motivated to share more insights. Let’s grow and learn together—happy trading!

Tata Motors - Poised for a Powerful UpsurgeTata Motors is presenting an exciting setup, and all signs point to a potential strong move upwards, thanks to multiple demand zones aligning perfectly across higher time frames.
Monthly Demand Zone : Tata Motors has firmly entered a high-confluence area, with the monthly and daily demand zones acting as a solid foundation. These zones represent areas where big buyers historically step in, making it a strong base for a bullish reversal. The confluence between the larger time frames adds even more strength to this zone, suggesting a high probability of upward momentum.
Monthly Demand Zone
Daily Demand Zone Reactivity: On the daily chart, the price dipped into a daily demand zone, triggering a sharp bounce. The immediate reaction from buyers shows the validity of this zone, with bulls actively defending it. This reactivity adds further confidence that Tata Motors may have found a strong floor.( visible in lower time frame Charts)
Daily Demand Zone:
Lower time frame Reaction:
Higher Timeframe Trendline Support : Adding more weight to this bullish setup is a long-term trendline support, which has acted as a reliable level for price to bounce from historically. This trendline is now aligning with the demand zones, creating a super-strong support structure. It’s not just the demand zones that are holding; the higher timeframe trendline is also providing a solid foundation for the price to launch upward.
Trend Line support
Gap-Filling Opportunity: There’s also a gap in price that remains unfilled, creating a target area for bulls to aim for. Gaps often act like magnets for price, and with the support from both the demand zones and the trendline, Tata Motors looks set to make its way upward to close this gap
With Tata Motors sitting in a confluence of monthly and daily demand zones, supported by a long-term trendline and a gap-filling opportunity, the setup is ripe for a significant upside move. The alignment of demand zones across multiple timeframes combined with the trendline support creates a compelling case for a bullish rally. This is one to watch for a potential strong uptrend!

Bank Nifty analysis for 6th FEB'2024Bank nifty traded in a range between 46000 to 45600 today buyers were holding support but no momemtum from buyers end today tried twice to break 46000 but failed!
Major support at 45600 if breaks tomorrow seller can take it to 45300 addtion to that banknifty was showing weakness after 2 pm today & traded below trendline support.
Buyer can show momentum above 46100 - 46200, Tomorrow may be trend day or wide range day.
Support : 45300,45000
Resistance : 46100, 46300
Note : Do your own analysis before making any trade or invesment decesion.

Short-Term Trading Opportunity Alert: Reliance in FocusHello Traders!
I’ve got my sights set on Reliance for a short-term trading opportunity. Before you dive in, here’s what you need to know:
Analysis: On the daily and four-hour time frames, we’ve got an intriguing pullback opportunity that could lead to some upward movement.
Caution: Keep in mind, the overall direction of this stock is bearish, so tread carefully.
Trading Opportunity: If you’re keen to seize this chance, consider a long position from the indicated levels.
Derivative Traders: For those in the derivatives market, keep an eye on 2200 or 2300 CE options for November expiry.
Risk Management: Always set stop-loss orders and be prepared for fluctuations in the market.
Takeaway: This isn’t an investment opportunity but a short-term trading play. If you’re comfortable with short-term moves, this might be your playground.
Your Strategy: What’s your take on Reliance? Planning to hop on this ride or staying on the sidelines? Share your thoughts below!
Stay Informed: Follow for updates on this trade opportunity and more.
Happy trading!

Ipcalab looking good for short term Ipcalab looking good for short-term possible target and stoploss in chart

GARWARE TECHNICALS: Shorting opportunity on Daily TFGARWARE Technical is following a down trend on a Daily TF in a channel pattern and recently made a bearish engulfing candle at the resistance.
Looking good to further fall by around 5% in short term period to 2550.

AARTIDRUGS short term investment - trading opportunityAARTIDRUGS short term investment - trading opportunity
Expecting bounce from daily level to give target till sideways boundary
Investment horizon 2-3 months holding
