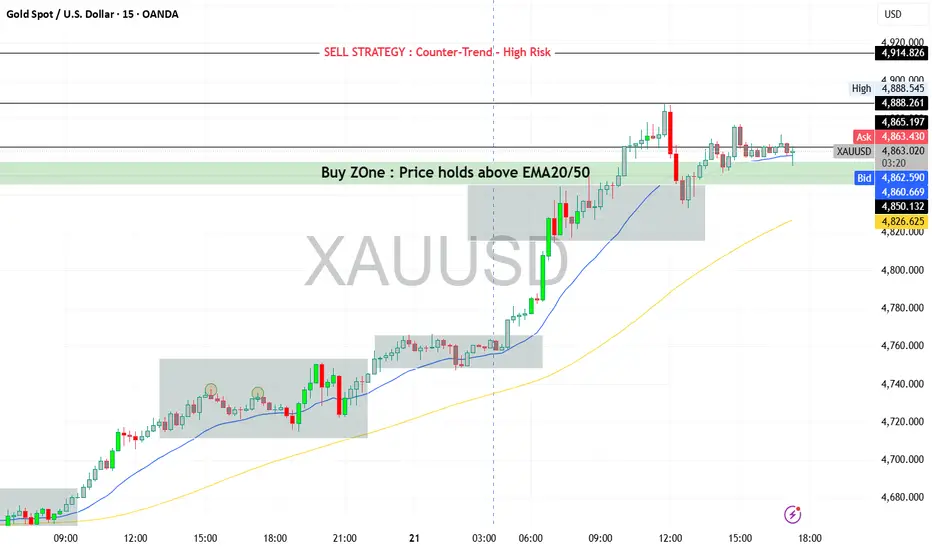
XAUUSD (Gold) | Bullish vs Bearish Scenario | Trading SetupBullish vs Bearish View
Bullish Scenario (Primary Bias – Trend Continuation)
Trend remains strongly bullish as long as price holds above the pivot zone (4858–4845).
Buyers are in control, supported by ADX strength, MACD momentum, and moving average
alignment.
Break and hold above 4888 opens the door for further upside expansion.
Bearish Scenario (Corrective Pullback Only)
Bearish moves are considered corrective, not trend-reversing, unless price falls below 4800.
Overbought conditions may trigger short-term profit booking, but trend remains bullish
above key supports.
Key Levels to Watch
Resistance Levels
4888 – 4895 (Day high / breakout zone)
4914
4939 – 4950 (extension zone)
Support Levels
4858 – Pivot
4845
4829
4803
4773 (strong trend support)
Intraday Trading Strategy (Day Trading Plan)
Strategy Type:
Trend Continuation Buy-on-Dips
Buy Setup
Buy Zone: 4858 – 4845 (pivot support / minor pullback)
Confirmation:
Price holds above EMA20 / EMA50
Bullish rejection candle or continuation pattern on M15–M30
Targets
Target 1: 4888
Target 2: 4914
Target 3 (extension): 4939
Stop Loss
Intraday SL: Below 4825
Aggressive SL: Below 4800 (trend invalidation zone)
Alternative Sell Strategy (Counter-Trend – High Risk)
⚠️Only for experienced traders
Sell Zone: 4914 – 4940
Condition: Clear rejection + bearish divergence on M15/M30
Target: 4880 → 4858
Stop Loss: Above 4955
Preferred Trading Style Today
✔️Buy on dips
❌Avoid chasing price at highs
❌Avoid heavy counter-trend sells
Tradingsignal
Swing Trading and Positional Trading Profits1. Understanding Swing Trading Profits
What is Swing Trading?
Swing trading aims to capture short- to medium-term price swings, typically lasting from a few days to a few weeks. Swing traders operate within broader trends but focus on smaller price movements inside those trends.
The objective is to profit from oscillations, not entire long-term trends.
How Swing Traders Generate Profits
Swing traders earn profits by:
1️⃣ Capturing Retracements and Bounces
Markets rarely move in straight lines. Even in strong uptrends, prices pull back temporarily.
Swing traders buy dips and sell at the next bounce.
Example:
If a stock in an uptrend dips from ₹500 to ₹470 and you buy at ₹470, a bounce to ₹495–₹505 can yield quick profits.
2️⃣ Using Technical Indicators
Swing traders rely heavily on tools like:
Support and resistance zones
Trendlines
Moving Averages (20, 50, 200 EMA)
RSI, MACD, Stochastics
Fibonacci retracement
These indicators help identify high-probability reversal or breakout zones.
3️⃣ Breakout and Breakdown Profits
Swing traders also profit from:
Breakout trades (price crossing resistance)
Breakdown trades (price falling below support)
These movements often lead to rapid price expansion.
4️⃣ Utilizing Momentum
Short-term bursts of momentum—caused by news, earnings, or sector strength—give traders opportunities to capture small but repeated gains.
Profit Characteristics in Swing Trading
🔹 Moderate Profit per Trade
Typical swing trades aim for 3% to 10% per trade depending on volatility.
However, multiple trades per month allow cumulative compounding.
🔹 High Trade Frequency
Most swing traders execute 8–20 trades per month, increasing profit potential.
🔹 Risk and Stop-Loss
Swing trading does involve higher noise and volatility.
SLs are usually small (1.5%–4%), making risk manageable.
🔹 Importance of Timing
Since swings are short-lived, profits depend on:
Entering early at the reversal point
Exiting before momentum fades
A delay of 1–2 days can reduce profitability drastically.
Advantages of Swing Trading for Profit Generation
Faster capital rotation → More opportunities
Lower overnight risk than positional trading
Ideal for volatile markets
Works well with technical analysis
Smaller stop-losses increase risk–reward ratios
When Swing Trading Produces Maximum Profits
Swing trading gives the best results when:
The market is range-bound
The index is consolidating
Stocks move between support and resistance levels
Weekly volatility is strong
During choppy phases, positional trades may get stopped out, but swing traders can profit multiple times in both upward and downward moves.
2. Understanding Positional Trading Profits
What is Positional Trading?
Positional trading is a longer-term approach, where traders hold positions for:
Weeks
Months
Sometimes even a year
Positional traders focus on capturing large directional movements driven by fundamentals, macro trends, sector rotation, or long-term chart patterns.
How Positional Traders Generate Profits
1️⃣ Capturing Major Trends
Instead of small fluctuations, positional traders aim for big moves, often 20%–100% or more.
They enter after confirming a strong trend on:
Weekly charts
Monthly charts
Long-term support breaks or retests
2️⃣ Using Broad Technical and Fundamental Analysis
While swing traders usually rely almost exclusively on charts, positional traders combine:
Fundamental strength (earnings, balance sheet, order book)
Sector analysis
Macro triggers
Long-term chart patterns such as:
Cup and handle
Head and shoulders
Ascending triangles
Bullish or bearish channels
3️⃣ Riding the Trend with Patience
Profits compound over time because:
Stocks need time to form trends
Institutional accumulation happens slowly
Breakouts on weekly/monthly charts have strong follow-through
4️⃣ Limited Trading, Larger Profits
Positional traders may take only 2–6 trades per month, but each has higher profit potential.
5️⃣ Hedging to Protect Capital
Some positional traders hedge using:
Index options
Sector futures
Protective puts
This reduces risk and smoothens long-term profit curves.
Profit Characteristics in Positional Trading
🔹 Larger Profit per Trade
Returns per trade are much higher than swing trading:
20% to 200% depending on the trend
Ideal for wealth building
🔹 Lower Trade Frequency
Because trades are fewer, profits depend heavily on selecting the right stocks.
🔹 Bigger Stop-Loss Levels
Weekly charts require larger SLs—5% to 12% typically—but the reward is much bigger.
🔹 Less Stress
Since traders don’t monitor minute-to-minute fluctuations, positional trading is psychologically easier.
Advantages of Positional Trading for Profit Generation
Compounds capital significantly
Lower slippage and transaction costs
Less screen time required
Captures major market cycles
Ideal when markets are trending strongly
When Positional Trading Produces Maximum Profits
Positional trading performs best during:
Bull runs
Strong sector rotations
Clear upward or downward long-term trends
Major breakouts on weekly/monthly charts
During such phases, swing traders might book profits too early, while positional traders capture the entire move.
Swing vs Positional Trading — Profit Comparison
Feature Swing Trading Positional Trading
Trade Duration Days to weeks Weeks to months
Profit Per Trade 3%–10% 20%–200%
Frequency High Low
Risk Moderate Higher overnight risk
Stop-Loss Small Large
Best Market Condition Range-bound Trending
Capital Rotation Fast Slow
Stress Level Medium Low
Which Style Is Best for You?
Choose Swing Trading if you:
✔ Can monitor markets daily
✔ Prefer faster returns
✔ Are comfortable with technical analysis
✔ Like frequent trading opportunities
Choose Positional Trading if you:
✔ Have a full-time job or limited screen time
✔ Prefer long-term trend riding
✔ Have larger capital
✔ Value stability over frequent trades
Conclusion
Both swing trading and positional trading can be highly profitable—but only when matched with the right trader personality and market conditions. Swing trading provides rapid, repeated gains through short-term price swings, ideal for volatile or sideways markets. Positional trading, on the other hand, aims for larger, long-term profits by capturing major trends and market cycles.
A successful trader often combines both approaches: swing trading during consolidations and positional trading during strong trends. The key lies in disciplined execution, chart analysis, risk management, and adapting strategies as the market evolves.
How Derivatives Hedge RiskWhat Are Derivatives?
A derivative is a financial contract whose value is based on an underlying asset such as:
Stocks
Bonds
Indices
Commodities (oil, gold, wheat, etc.)
Currencies
Interest rates
Crypto assets
Common types of derivatives used for hedging include:
Futures
Options
Forwards
Swaps
Each of these tools functions differently, but all help manage risk.
Why Hedging Matters
Risk in financial markets comes from many sources:
Price volatility
Uncertain interest rates
Currency fluctuation
Commodity cost changes
Market crashes
Global geopolitical shocks
Weather-driven agricultural risks
Economic cycles
If a company or investor does nothing about these uncertainties, they are exposed to losses that could have been prevented. Hedging creates a protective barrier.
For example:
An airline fears rising crude oil prices.
An exporter fears the Indian rupee becoming stronger against the dollar.
A stock investor fears a market correction.
A manufacturer fears steel input cost rising.
All these risks can be hedged using derivatives.
How Derivatives Hedge Risk — The Core Logic
Hedging works on one simple principle:
A loss in the cash market should be offset by a gain in the derivative market.
The purpose is not to generate extra profit but to protect against loss.
Let’s understand this with the major derivative types.
1. Futures Contracts – Locking Prices for Certainty
A future is an exchange-traded contract that locks an asset price today for a future date.
How futures hedge risk:
If you fear that the price of an asset will move against you, you take an opposite position in futures.
Example – Hedging against rising prices
A wheat processor fears wheat prices may rise.
He buys wheat futures today.
If spot prices rise later:
He pays more in the physical market.
But his futures position makes a profit.
The profit offsets the extra cost—risk hedged.
Example – Hedging against falling prices
A farmer fears wheat prices may fall.
He sells wheat futures today.
If spot prices drop:
He gets less money for selling wheat physically.
But he gains on the short futures.
Again, loss in one place is covered by gain in the other.
Futures are powerful hedging tools for:
Commodity producers
Commodity consumers
Stockholders
Index investors
Currency-dependent businesses
Interest-rate-sensitive institutions
They bring price certainty and remove uncertainty.
2. Options – Insurance Against Adverse Movements
An option is a contract that gives the buyer the right—but not the obligation—to buy or sell an asset at a fixed price.
There are two types:
Call option – Right to buy
Put option – Right to sell
Options are the best hedging tool because they provide protection while allowing participation in favourable moves.
Hedging with Put Options (Downside Protection)
Buying a put is similar to buying insurance.
A stock investor buys a put option at a strike price.
If the stock falls heavily:
Loss in the stock is offset by gain in the put option.
If the stock rises:
He loses only the premium, but still enjoys the upside.
This is called a protective put.
Hedging with Call Options (Upside Protection for Short Sellers)
If someone has sold a stock or commodity and fears that prices may rise, they buy a call option as insurance.
If prices rise:
The call increases in value.
Loss in the short position is reduced or offset.
Why options are preferred for hedging:
You control risk with limited premium.
You keep unlimited favourable movement.
They work like financial insurance policies.
3. Forward Contracts – Customized Hedging
A forward contract is like a future but traded privately (OTC), not on an exchange.
They are customized based on:
Quantity
Price
Duration
Delivery terms
Hedging With Forwards – Example
An Indian exporter expecting $1 million in three months fears the USD/INR rate might fall.
He enters into a forward contract with a bank to sell $1 million at a fixed rate.
If the dollar weakens:
He gets less money in the market.
But the forward contract guarantees a fixed rate.
Thus the business avoids currency risk.
Forwards are widely used by:
Exporters and importers
Banks
Large corporations
Commodity producers
They hedge exchange rate risk, interest rate risk, or commodity price risk.
4. Swaps – Exchanging Cash Flows to Reduce Risk
A swap is a contract between two parties to exchange cash flows.
Two common types:
Interest Rate Swaps
Currency Swaps
Interest Rate Swap Example
A company with a floating-rate loan fears rising interest rates.
It enters into a swap to convert the floating rate into a fixed rate.
If market rates rise, the company pays more interest normally,
but gains in the swap compensate the higher payment.
This stabilizes finance costs.
Currency Swap Example
A company with revenue in USD but expenses in INR can exchange currency cash flows using a swap so that currency fluctuations do not hurt the business.
Swaps reduce uncertainty for long-term financial planning.
Real-World Hedging Examples
Airlines and Crude Oil
Airlines hedge oil prices using futures and swaps because fuel cost is uncertain. Hedging ensures predictable expenses.
Farmers and Commodity Prices
Farmers hedge against falling commodity prices using futures and options.
Manufacturing Companies
Steel consumers hedge rising metal prices using futures.
Exporters and Importers
Currency forwards and options reduce FX volatility risk.
Stock Investors
Portfolio managers hedge index risk using index futures or index put options.
Benefits of Hedging with Derivatives
✔ Reduces risk and uncertainty
✔ Protects profit margins
✔ Stabilizes cash flows
✔ Improves planning and budgeting
✔ Protects portfolios from market crashes
✔ Provides insurance-like safety
✔ Allows businesses to focus on operations instead of price fluctuations
Limitations and Risks of Hedging
Hedging has costs (like option premium).
Over-hedging can reduce profits.
Mis-using derivatives can increase risk.
Requires knowledge and discipline.
Mark-to-market losses can occur, even if final protection holds.
But despite costs, hedging is essential for long-term stability.
Conclusion
Derivatives are powerful tools for managing and reducing financial risk. By taking an opposite position in futures, options, forwards, or swaps, businesses and investors can ensure that adverse market movements are offset by gains in derivative markets. This transforms unpredictable markets into manageable environments.
Whether it is an airline hedging fuel costs, an exporter hedging currency risk, or an investor protecting a stock portfolio, derivatives act as a financial shield. They do not eliminate uncertainty, but they convert unknowns into planned, controlled outcomes. That is the true power of hedging.
Part 10 Trade Like InstitutionsBear Put Spread – Best for Mild Downtrend with Controlled Risk
Same concept but for bearish conditions.
How it works
Buy a lower strike put.
Sell a farther out-of-the-money put.
When to use
Expect small to moderate fall.
Want low risk and fixed cost.
Risk and reward
Risk: Limited to net debit (premium).
Reward: Limited but predictable.
Example
Buy Bank Nifty 49,000 PE at ₹150
Sell 48,800 PE at ₹70
Net premium = ₹80
Max profit = 200 – 80 = ₹120

Part 1 Support and Resistance How Option Trading Works
Option trading can take place on exchanges such as the Chicago Board Options Exchange (CBOE) or through online trading platforms provided by brokers. Traders can take one of two main positions:
Buying Options – This involves paying the premium to acquire the right to buy or sell the underlying asset. Buying options limits the trader’s loss to the premium paid but offers theoretically unlimited profit for calls if the asset price rises, or significant profit potential for puts if the asset price falls.
Selling/Writing Options – This involves receiving the premium in exchange for assuming the obligation to buy or sell the underlying asset if the buyer exercises the option. Writing options can generate steady income through premiums but carries high risk, especially if the market moves unfavorably.

Part 11 Trading Master Class What Are Options?
Options are financial contracts that give the buyer the right, but not the obligation, to buy or sell an underlying asset at a predetermined price (called the strike price) before or on a specific date. Unlike shares, which give ownership, options only provide trading rights.
There are two main types of options:
Call Option – gives the right to buy.
Put Option – gives the right to sell.
The buyer of an option pays a premium, while the seller (or writer) receives the premium and must fulfill the contract if the buyer exercises it.

Inflation & Equity Market PerformanceIntroduction
Inflation is one of the most important macroeconomic variables that influences financial markets worldwide. Equity markets, in particular, are highly sensitive to inflationary pressures because inflation affects corporate earnings, consumer spending, interest rates, and investor sentiment. For traders and long-term investors alike, understanding how inflation interacts with equity market performance is crucial in building strategies, managing risks, and identifying opportunities.
This discussion will dive into the dynamics between inflation and equity markets, exploring historical evidence, economic theory, sectoral performance, and practical strategies for navigating inflationary cycles. We will also focus on the Indian context while connecting it with global market behavior.
1. Understanding Inflation
1.1 Definition
Inflation refers to the sustained increase in the general price level of goods and services in an economy over time. It reduces the purchasing power of money, meaning that each unit of currency buys fewer goods and services.
1.2 Types of Inflation
Demand-Pull Inflation – Occurs when demand for goods and services outpaces supply. Example: During economic booms.
Cost-Push Inflation – Caused by rising production costs (e.g., higher wages, energy prices, raw materials).
Built-In Inflation – When businesses and workers expect prices to rise, wages increase, and costs get passed to consumers, creating a feedback loop.
Stagflation – A mix of stagnant growth and high inflation, often damaging for equity markets.
1.3 Measuring Inflation
Consumer Price Index (CPI): Measures retail inflation.
Wholesale Price Index (WPI): Reflects wholesale price trends.
GDP Deflator: Broader measure capturing inflation in all goods and services.
2. The Link Between Inflation and Equity Markets
2.1 Theoretical Framework
Discounted Cash Flow (DCF) Model: Equity valuations are based on the present value of future cash flows. Higher inflation often leads to higher interest rates, which raise discount rates and reduce present values of stocks.
Corporate Earnings: Inflation can squeeze profit margins if companies cannot pass on higher costs to consumers. However, some firms benefit (e.g., commodity producers).
Investor Sentiment: Persistent inflation creates uncertainty. Equity investors tend to become cautious, reallocating funds to safer assets like bonds, gold, or real estate.
2.2 Historical Evidence
U.S. in the 1970s: High inflation led to stagflation and poor equity returns.
India in 2010–2013: High CPI inflation (driven by food and fuel) correlated with weaker equity performance and high volatility.
Post-COVID (2021–2022): Global inflation surged, leading central banks (Fed, RBI) to raise rates. Equity markets corrected sharply, particularly in high-growth tech stocks.
3. Inflation’s Impact on Different Equity Sectors
3.1 Beneficiaries of Inflation
Energy Sector: Oil, gas, and coal companies often benefit when commodity prices rise.
Metals & Mining: Higher input costs increase revenues for miners and producers.
FMCG (Fast-Moving Consumer Goods): Large players with pricing power pass costs to consumers.
Banks & Financials: Rising interest rates can improve net interest margins.
3.2 Losers in High Inflation
Technology & Growth Stocks: Valuations fall as future earnings are discounted at higher rates.
Consumer Discretionary: Higher prices reduce demand for non-essential goods.
Real Estate Developers: Financing costs increase, reducing affordability.
Export-Oriented Businesses: Inflation in the domestic economy can raise costs, hurting competitiveness.
4. Inflation & Monetary Policy – The Central Bank Connection
4.1 Interest Rates and Equities
Central banks, such as the Federal Reserve (US) or Reserve Bank of India (RBI), control inflation through monetary policy. When inflation rises, they typically:
Increase policy rates (Repo Rate in India) → Higher borrowing costs → Reduced spending & investment → Slower growth.
This cools inflation but often pressures equity markets.
4.2 Liquidity Conditions
Quantitative Tightening (QT): Withdraws liquidity → bearish equities.
Quantitative Easing (QE): Injects liquidity → bullish equities.
4.3 Inflation Targeting in India
RBI targets 4% CPI inflation (with 2%–6% tolerance band).
Persistent inflation above 6% often triggers aggressive monetary tightening, negatively impacting Indian equities.
5. Inflation & Valuation Metrics
5.1 Price-to-Earnings (P/E) Ratios
High inflation → low P/E ratios because of lower growth expectations and higher discount rates.
Low/moderate inflation → supportive of higher P/E multiples.
5.2 Earnings Yield vs. Bond Yields
Investors compare stock earnings yield (E/P) with government bond yields.
If inflation pushes bond yields higher, equities look less attractive → rotation from stocks to bonds.
6. Historical Lessons: Global and Indian Perspectives
6.1 Global Case Studies
1970s U.S. Stagflation: Equity markets fell as inflation surged with low growth.
2008 Crisis Aftermath: Inflation was subdued due to weak demand, equities benefited from low rates and QE.
2021–22 Inflation Surge: Tech-heavy Nasdaq corrected sharply as the Fed hiked rates.
6.2 Indian Market Episodes
2010–2013: Double-digit food inflation, rupee depreciation, and high crude oil prices → Nifty struggled.
2014–2017: Low inflation and falling crude oil → equity boom.
2020 Pandemic: Initially deflationary shock, followed by massive liquidity injection → market rally.
2022 RBI Tightening: Nifty saw corrections as CPI spiked above 7%.
7. Sectoral Rotation During Inflation Cycles
Early Inflation Phase: Commodities, energy, and value stocks outperform.
High Inflation Phase: Defensive sectors (FMCG, healthcare, utilities) attract investors.
Disinflation Phase: Technology, financials, and growth-oriented sectors recover.
This sectoral rotation is crucial for traders and investors in building adaptive portfolios.
8. Inflation & Investor Behavior
8.1 Equity vs. Alternative Assets
Gold: Acts as a hedge against inflation.
Bonds: Suffer when inflation rises because real yields fall.
Real Estate: Often seen as inflation-protected asset.
8.2 Risk Appetite
High inflation reduces risk appetite, increasing volatility (India VIX rises).
9. Strategies for Trading & Investing During Inflation
9.1 Long-Term Investors
Focus on companies with pricing power.
Diversify into sectors that benefit from inflation.
Avoid overvalued growth stocks during high inflation cycles.
9.2 Traders
Monitor CPI/WPI releases and RBI/Fed policy meetings.
Use sectoral rotation strategies to capitalize on changing trends.
Hedge equity exposure with gold, commodities, or inflation-indexed bonds.
9.3 Portfolio Hedging Tools
Options Strategies: Protective puts during volatile periods.
Sector ETFs/Mutual Funds: To align with inflationary themes.
Diversification across geographies: Inflation is not synchronized globally.
10. The Indian Context – Looking Ahead
India is particularly sensitive to inflation due to:
Dependence on crude oil imports.
Large share of food inflation in CPI basket.
Impact on rural consumption.
Looking forward:
Moderate inflation (4%–5%) is equity-friendly.
Persistent high inflation (>6%) may trigger RBI tightening, leading to equity corrections.
Global spillovers (U.S. Fed policy, crude prices, geopolitical risks) will continue influencing Indian equity performance.
Conclusion
The relationship between inflation and equity market performance is complex, multi-dimensional, and highly time-dependent. While moderate inflation is healthy and often correlates with rising corporate earnings, high and persistent inflation erodes returns, increases volatility, and shifts investor preference towards defensive assets.
For investors in India and globally, the key is to track inflation trends, understand sectoral impacts, and adapt strategies accordingly. Inflation is not just an economic statistic—it is a force that reshapes market cycles, dictates central bank policy, and influences long-term wealth creation in equities.

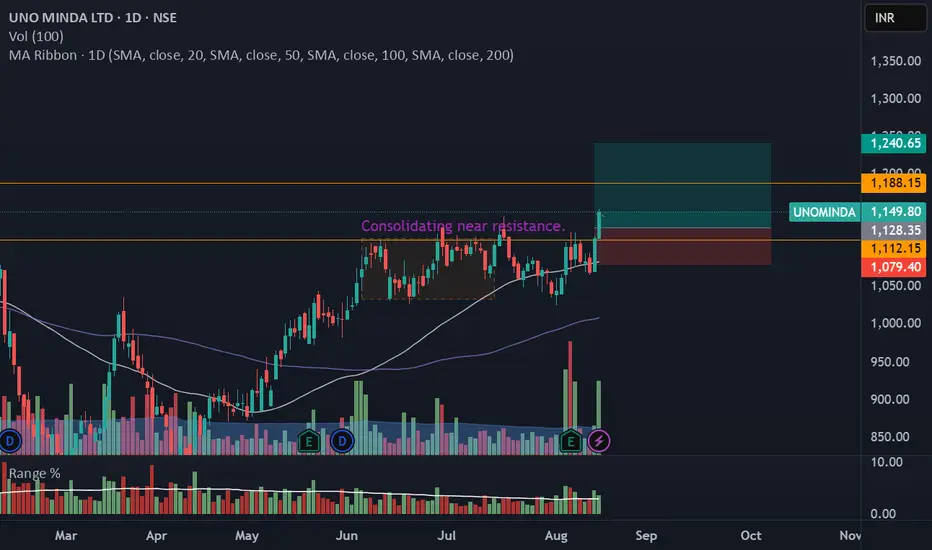
UNOMINDA – Daily Timeframe Breakout Idea (Resistance Zone Break)UNO MINDA LTD. has shown a breakout above a key horizontal resistance level on the daily chart, accompanied by a nearly 1.5 times volume surge near the breakout, as seen earlier, supported by strong momentum.
🔍 Breakout Context:
- Price broke above the ~₹1110 and 1120 horizontal resistance, which had held for over 6 months.
- Breakout supported by more than average volume and just above average range near the resistance zone.
- The price is also trading above both the 50- and 100-day SMAs, indicating strong trend continuation.
- This aligns with a bullish continuation setup.
📉 Trade Plan:
- CMP: ₹1149
- Entry: Near ₹1128
- Target: ₹1240 (~10% upside from CMP)
- Stop-Loss: ₹1079 (Closing Candle)
- Risk-Reward Ratio: ~1 : 2.2
Sensex Monthly expire AnalysisFor the Sensex monthly expiry on 28th March 2024, I anticipate a bullish trend driven by positive economic indicators and corporate earnings. Continued government stimulus measures and favorable global market conditions are likely to support investor sentiment. Key sectors such as technology, healthcare, and renewable energy could outperform, while stable inflation and interest rates may further bolster market confidence. However, cautiousness regarding geopolitical tensions and potential regulatory changes remains prudent. Overall, I expect the Sensex to exhibit resilience and potentially reach new highs during this expiry period, reflecting the underlying strength of the Indian economy.

Anupam Rasayan - Inverse H&S Breakout on Weekly ChartChart patterns are the most loved trading strategy among traders. There are different kind of patterns traded in stock market. One of which is inverse head and shoulder - a trend reversal pattern. Upon formation of this pattern the stock trend get reversed. Generally if the stock is in consolidation phase then this pattern is seen.
Now here I have observed inverse head and shoulder pattern formation in one of the chemical manufacturing company in India named Anupam Rasayan India Ltd. On closely observing the chart, I found that the stock is in downtrend since May 2022 after making a high of 1234 and remain in downtrend till Oct 2023. Now the fresh uptrend in the stock is supported by inverted head and shoulder pattern which signifies that the stock can continue the uptrend in coming months.
The targets for this stock can be found by projecting the depth of head just after the breakout which comes around 1320. Also the stop loss for this trade can be put at the depth of right shoulder which is around 990.
Disclaimer: The stock shared is only for educational purpose and does not hold any buy or sell recommendations.

AXP/ American Express Company Swing Short Trade Setup - AXP is setting up for a supply reaction
- It can surely retrace the whole move it created from the origin
- Inefficiencies created should be filled by expansion and post that a bounce back
- Do not initiate shorts from the mentioned zone like a fool without a reaction

Turned down right from the opening of the new weekGold prices edged lower at the start of the week after posting solid gains from haven flows that were seen outperforming higher government bond yields across most of the globe. The price of precious metals decreased not because gold's upward momentum was over, but because the market needed to consolidate with resistance at 1,985 USD/ounce.
The geopolitical situation and macroeconomic factors of the Middle East may have contributed to the increase in gold prices. The decline in the iShares iBoxx High Yield Corporate Bond Fund ETF reflects the worsening outlook for corporate bonds. This credit squeeze also affected Wall Street stock indexes and increased risks to other assets.
The Middle East situation is unlikely to find a peaceful solution soon, which could maintain demand for gold despite higher Treasury yields. The 2-year Treasury note reached 5.25% last Thursday but fell to 5.10% over the weekend. The 10-year note also hit its highest level since 2007, briefly surpassing 5.0% before settling at 4.95%.
The chart shows that the rise in the 10-year Treasury yield and the USD index has not yet affected the price of gold, but it is worth keeping an eye on in case of sudden movements in those markets.
The sell-off of the iShares high-yield ETF could have broader consequences for stocks as companies face higher borrowing costs.
SELL zone 1982$ - 1980$ - stoploss: 1986$
Buy zone1945$ - 1947$ - stoploss: 1940$

Long term gold. 2050 COMINGCurrently gold is trading around 1980 USD and has increased a total of 7 USD today. It can be seen that after the Fed chairman's speech yesterday, gold's reaction was not too strong but still developed with the highest impressive number in the past two weeks since October 6.
The reason gold prices increased cannot help but mention the fact that the gold market continues to benefit as the Israel-Hamas conflict continues to intensify. Besides, the cooling of the USD also partly supported gold's return.
With gold retesting the level of 1,964 USD/ounce, this precious metal will easily surpass levels in the range of 1,985 - 1,995 USD/ounce.
All resistance zones are not enough to slow down the rise of gold.
Let me know your mind!

BUY GBPUSD | STRATEGY | ANALYSISAll the key points, aspects, and probabilities are clearly mentioned on the Chart. Kindly do your own research before entering. Or DM for daily premium trades.
THANK YOU

GOLD - Scalping StrategyGold prices slightly extended its gains and successfully continued a third day of gains.
TVC:GOLD hovers around $1,900/oz during the Asian session on Wednesday, showing signs of recovery from four consecutive weeks of losses despite a firmer US Dollar (USD).
However, a stronger recovery is unlikely at the moment.
After days of continuous decline, gold finally showed signs of changing the trend. At first, we can look at the problem as follows:
1. Economic data in the US is showing signs of getting better
2. Inflation may not reach the target of the Fed, but it can also be called cooled down
3. The economic data is giving clearer evidence of the US economic scenario will have a soft landing if the FED is ready to QE after this period.
=> From the above points, I think that Gold is still in a downtrend, and this rally may not be as strong as expected.
You can set up sell order at price zone 1905-1907 SL 1913 TP 1900,1895

TATA MOTORS INTRADAYTata Motors is trading in a very narrow range and we expect a breakout soon on 15 mins chart.
A short position below 302 for a small target of 298 from where it is expected to rebound.
If we see a bullish breakout then we can buy for a target of 315 followed by 323.
Ultimately the momentum is still bullish and just we need to wait for a right entry level.
All the cases have been market on the chart.

NIFTY SETUP FOR TOMORROWNifty shows a potential upside for tomorrow session. A perfect W bottom with clear diversion on TDI. The diversion is strong as the first leg of the diversion is outside the Bollinger band followed by the second inside leg. If it breaks the trend line we can expect the 61.8% levels tomorrow.

DLINK BULLISH SETUPD Link looks positive as it is have a strong support near 98 level. One can add this stock for a short term purpose.
Entry- 98- 99
Target- 107-114
Stoploss- 95.8 Closing Basis
