Cochinship AnalysisCochin Shipyard Limited (COCHINSHIP) Bullish Bet
The chart presented indicates the formation of an Inverse Head and Shoulders pattern, which is considered a bullish reversal pattern.
Left Shoulder: Formed around early August 2025.
Head: Formed during mid-August 2025 at a lower price level.
Right Shoulder: Formed towards late August 2025.
Neckline: Around the ₹1,750–1,765 range.
This suggests a potential trend reversal from bearish to bullish.
Current Price (CMP): ~₹1,745.70
Neckline Resistance: ~₹1,765
Breakout Target (based on pattern projection): ₹1844 / 1918 / 1992 / 2097+++
Support Levels:
Immediate Support: ₹1,700
Strong Support: ₹1,650
1. Trendline Break: The long-term downward trendline appears to be broken, indicating reduced selling pressure.
2. Volume Confirmation (not visible in chart): Ideally, a breakout above neckline with strong volumes will confirm the bullish reversal.
3. Potential Upside: If price sustains above neckline (~₹1,765), the stock may aim for ₹2,000–2,220 in the short to medium term.
Tradingtips

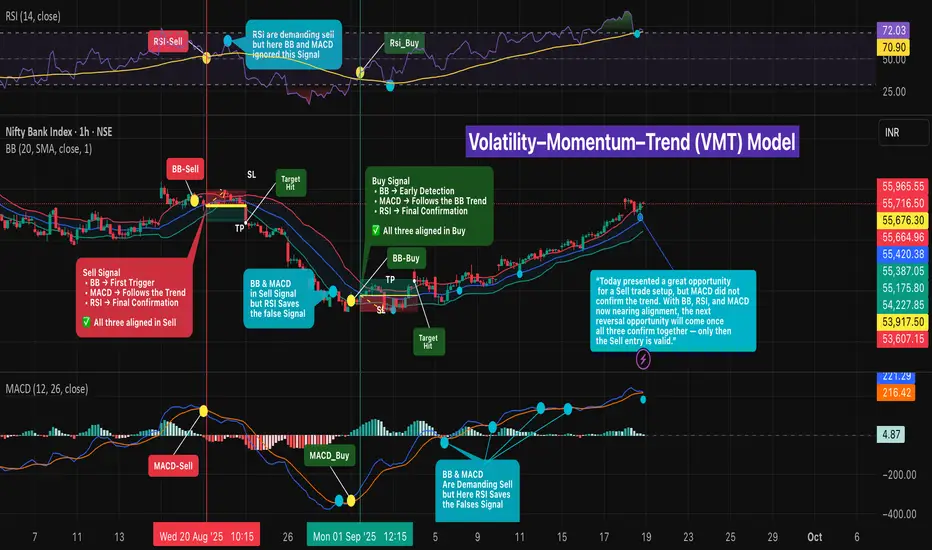
Volatility–Momentum–Trend (VMT) Model🔎 Intro / Overview
Three-indicator confirmation using Bollinger Bands (BB) , MACD , and RSI to align trend and price action.
BB often detects the move first (least lag), MACD follows the BB trend (mid reaction), and RSI confirms last (most lag).
This staged confirmation helps reduce false signals and keeps entries disciplined.
___________________________________________________________
📔 Concept
• Bollinger Bands (BB) → Early detector at volatility extremes.
– Buy : Price first moves outside the lower band , then a candle closes back above lower band → early bullish alert.
– Sell : Price first moves outside the upper band , then a candle closes back below upper band → early bearish alert.
• MACD → Momentum confirmer.
– Buy : MACD crossover above its signal line supports the bullish shift.
– Sell : MACD crossunder below its signal line supports the bearish shift.
• RSI → Final confirmation (filters traps).
– Buy : RSI crosses above its moving average, confirming bullish momentum.
– Sell : RSI crosses below its moving average, confirming bearish momentum.
✅ Only when BB + MACD + RSI all align in the same direction is the signal confirmed.
Notes:
- BB often reacts first (fastest, but prone to false starts).
- MACD provides mid-reaction confirmation.
- RSI lags but acts as the strongest filter against false trades.
Notes: Sometimes BB reacts immediately; MACD/RSI can prevent traps. At times BB+MACD demand a trade but RSI rejects (good filter); other times RSI demands but BB+MACD filter it.
___________________________________________________________
📌 How to Use
🔴 Sell Signal
1) BB: Price first extends outside upper band in an up-move, then a candle closes back under the upper band → BB sell signal.
2) MACD: Crossunder of MACD line below signal line.
3) RSI: RSI crosses below its moving average → final confirmation.
✅ All three aligned = Valid Sell.
🟢 Buy Signal
1) BB: Price first extends outside lower band in a down-move, then a candle closes back above the lower band → BB buy signal.
2) MACD: Crossover of MACD line above signal line.
3) RSI: RSI crosses above its moving average → final confirmation.
✅ All three aligned = Valid Buy.
___________________________________________________________
🎯 Trading Plan
• Entry → Only when all three confirm in the same direction.
• Stop Loss → - Stop-Loss → Near the structure swing that formed when BB first detected the signal (e.g., recent swing high for shorts / swing low for longs).
• Target → At least 1R ; scale/exit remainder using ATR, Fibonacci levels, or box trailing to ride trend.
___________________________________________________________
📊 Chart Explanation
Symbol/TF: BANKNIFTY · 1H
1) 20 Aug · 10:15 — SELL
• BB detected first, MACD mid-reaction (after ~2 candles), RSI confirmed last → Entry @ 55,676.30
• Target @ 55,387.05
• Stop-loss @ 55,965.55
• 🎯 Target hit on 22 Aug · 09:15 .
• Remaining lots can be trailed using ATR , Fibonacci levels , or Box Trailing to ride the extended trend
2) 29 Aug · 10:15 — FILTERED SELL
• BB and MACD demanded sell, but RSI did not confirm → No trade; RSI saved a false signal.
• 🦋 “The aqua dots represent false signals. At times, BB detects early entries but RSI and MACD do not confirm. Sometimes BB and MACD align, but RSI rejects the move. Other times BB and RSI confirm, yet MACD signals false. ✅ Only when all three align together is the signal valid.”
3) 01 Sep · 13:12 — BUY
• All three aligned long
• Entry @ 53,917.05
• Target @ 54,121.50
• Stop-loss @ 53,712.60
• 🎯 Target hit.
• Remaining lots can be trailed using ATR , Fibonacci levels , or Box Trailing to ride the extended trend
👉🏼 “A Sell setup looked promising today, but MACD did not confirm the trend ❌. With BB, RSI, and MACD now nearing alignment, the next reversal opportunity will be valid only when all three confirm together ✅.”
___________________________________________________________
👀 Observation
• BB provides the earliest cue; MACD validates momentum shift; RSI filters late-stage traps.
• Most reliable signals occur near key structure (support/resistance) with confluence.
• Not all alignments are equal—strength improves with decisive closes and supportive volume.
___________________________________________________________
❗ Why It Matters?
•A rule-based, three-step confirmation reduces noise and emotions.
•It clarifies when to enter , when to skip , and how to manage risk consistently across changing market conditions.
___________________________________________________________
🎯 Conclusion
BB → detect , MACD → follow , RSI → confirm .
When all three align, entries are clearer and risk is defined.
🔥 Patterns don’t predict. Rules protect. 🚀
___________________________________________________________
⚠️ Disclaimer
📘 For educational purposes only.
🙅 Not SEBI registered.
❌ Not a buy/sell recommendation.
🧠 Purely a learning resource.
📊 Not Financial Advice.
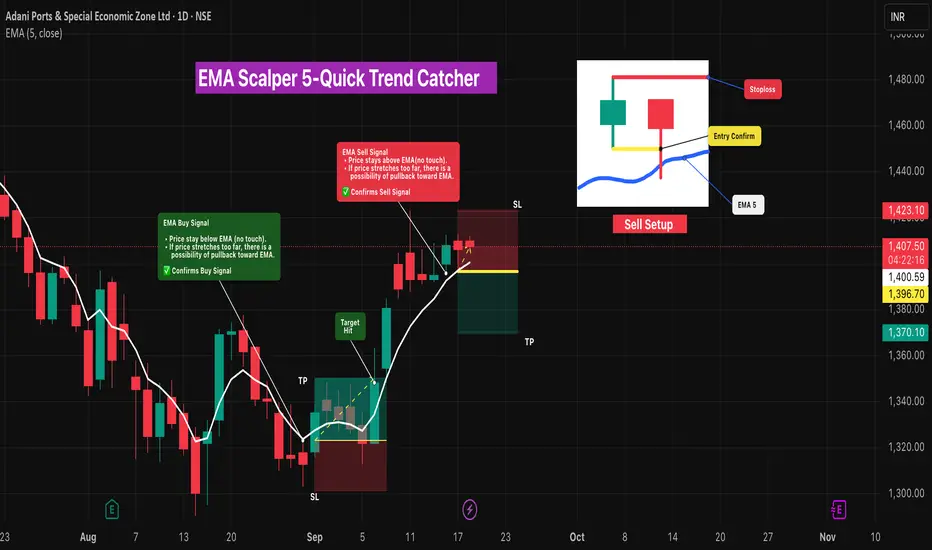
EMA Scalper 5-Quick Trend Catcher🔎 Intro / Overview
This idea uses a single EMA (Length 5) as a trend confirmation tool.
- When price stays below EMA (no touch), it signals bullish continuation.
- When price stays above EMA (no touch), it signals bearish continuation.
If price stretches too far from EMA, expect a possible pullback toward the line.
This EMA Scalping Strategy focuses on quick entries and exits 🎯.
- Best suited for intraday scalping where small, quick moves are captured. ⚡
___________________________________________________________
📌 How to Use
- In a downtrend , when price stays far below EMA(5) with no touch, then the next candle breaks the previous high → immediate Buy entry .
- In an uptrend , when price stays far above EMA(5) with no touch, then the next candle breaks the previous low → immediate Sell entry .
- EMA acts as a fast trend filter, confirming momentum while defining risk–reward levels.
- Once the signal is confirmed, entry is validated only if the next candle breaks the price level — otherwise, the signal is devalidated.
___________________________________________________________
🎯 Trading Plan
- Entry → When the next candle breaks the previous candle’s high , enter long (for immediate Buy).
- Stoploss → Swing Low for Buy / Swing High for Sell.
- Target → 1R (equal to stop distance).
___________________________________________________________
📊 Chart Explanation
ADANIPORTS
1️⃣ Buy Signal →
- Entry @ 1323.15
- Stoploss @ 1301.40
- Target @ 1345.70 → 🎯 Target Hit
2️⃣ Sell Signal →
- Entry @ 1396.70
- Stoploss @ 1423.10
- Target @ 1470.10
Trade continue in live
___________________________________________________________
👀 Observation
- EMA(5) gives fast and responsive trend signals.
- Works best in strong trending markets.
- False signals may occur in choppy sideways markets — use structure confirmation.
___________________________________________________________
❗ Why It Matters?
- Provides clear Buy/Sell confirmation with less lag.
- Defines structured entry, SL, and TP rules.
- Simple, rule-based system to avoid emotional trading.
___________________________________________________________
🎯 Conclusion
The EMA(5) Signal Strategy is a simple yet effective way to confirm trend and capture moves.
By combining breakout entries with disciplined SL/TP, traders can maintain risk–reward balance and trail winners effectively.
🔥 Patterns don’t predict. Rules protect. 🚀
___________________________________________________________
⚠️ Disclaimer
📘 For educational purposes only.
🙅 Not SEBI registered.
❌ Not a buy/sell recommendation.
🧠 Purely a learning resource.
📊 Not Financial Advice.
How FII & DII Flows Impact Nifty & BankNifty Daily Moves!Hello Traders!
Every evening, traders check the data: FII (Foreign Institutional Investors) bought or sold ₹X crores, DII (Domestic Institutional Investors) did the opposite.
But how do these flows actually affect the daily moves of Nifty and BankNifty? Let’s break it down.
1. FII Flows Drive Short-Term Sentiment
FIIs have massive capital, and their buying or selling often leads to sharp moves.
When FIIs are heavy buyers, indices like Nifty and BankNifty usually see strong rallies because of large inflows.
When they sell aggressively, the market often corrects, especially in large-cap stocks where they hold big stakes.
2. DII Flows Provide Stability
DIIs include mutual funds, insurance companies, and pension funds.
They act as a counterbalance to FIIs.
When FIIs sell in panic, DIIs often buy the dip, providing support to the market.
This is why sometimes, even with heavy FII selling, Nifty doesn’t crash as much as expected, DIIs are absorbing the supply.
3. Sector Impact – Why BankNifty Moves More
FIIs and DIIs both invest heavily in banking and financial stocks.
That’s why BankNifty often reacts more sharply to their flows compared to other sectors.
FII buying in banks = sharp rallies.
FII selling in banks = bigger drag on BankNifty.
4. Daily Data vs Long-Term Trend
Daily FII/DII numbers show short-term sentiment but don’t decide long-term trends alone.
Sometimes FIIs sell for weeks due to global issues, but strong domestic growth attracts them back eventually.
It’s important to watch whether the flows are consistent in one direction or just short-term adjustments.
Rahul’s Tip:
Don’t overreact to just one day’s FII/DII numbers. Look at the trend over several sessions.
Combine this data with charts of Nifty and BankNifty for a clearer picture.
Smart traders use flows as confirmation, not as the only reason to take trades.
Conclusion:
FII and DII flows are like the push and pull forces in the market.
FIIs bring speed and sharp moves, while DIIs bring balance and stability.
By tracking both, you can understand why Nifty and BankNifty move the way they do, and plan your trades with more confidence.
If this post made FII/DII flows clearer for you, like it, share your views in the comments, and follow for more real-world trading education!
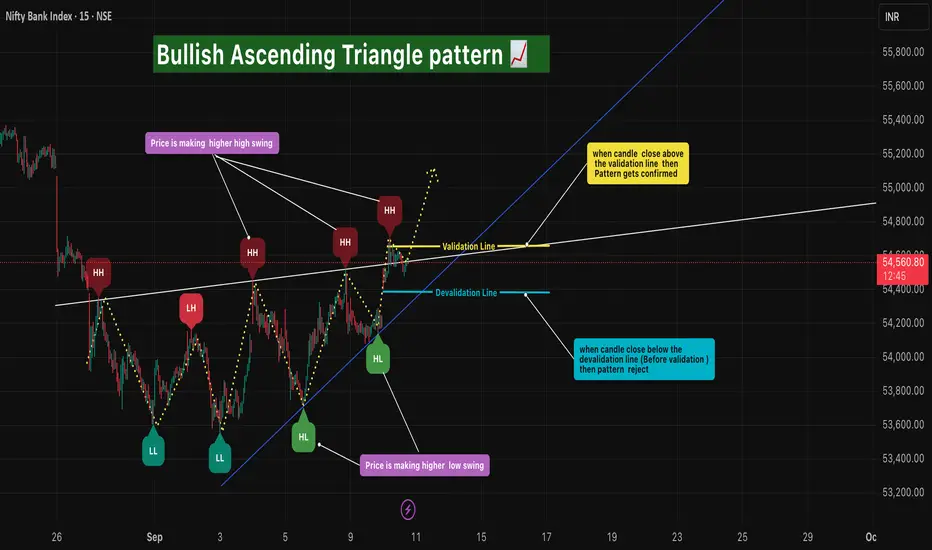
Bullish Ascending Triangle pattern🔎 Intro / Overview
The Bullish Ascending Triangle is a continuation pattern that signals strength in an uptrend 📈.
It forms as price creates Higher Highs and Higher Lows in sequence, compressing toward a breakout level.
This structure shows buyers stepping in at higher levels while sellers gradually weaken, often leading to a bullish breakout.
___________________________________________________________
📌 How to Use
Identify a prior uptrend → the base condition for Ascending Triangle.
Price consolidates by forming Higher Lows and retesting the same resistance level.
Validation → Mark the close of candle that break upper trend line
Devalidation → Swing Low ( when any candle break the upper trend line).
Entry → Confirmed only when price closes above the Validation level .
Stop Loss → Swing Low (Candle break the upper trend line ).
Target → Equal to the measured height of the triangle or 1R multiples.
___________________________________________________________
🎯 Trading Plan
Entry → On breakout close above Validation level.
Stop Loss → Swing Low (Candle break the upper trend line ).
Target → Conservative 1R, Moderate 2R,
Remaining lots → Trail using ATR, Fibonacci, or structural swing highs.
___________________________________________________________
📊 Chart Explanation
Price starts in an uptrend.
Forms a sequence of Higher Highs and Higher Lows .
Resistance holds flat at the top, forming the Ascending Triangle shape 🔺.
Breakout above the Higher High Validation line triggers entry ✅.
Swing Low = Devalidation ⛔.
Target 1 achieved 🎯, trailing used for further upside 🚀.
___________________________________________________________
👀 Observation
Works best as a continuation pattern in established uptrends.
A strong bullish breakout candle adds conviction.
Sideways/choppy markets may cause false breakouts → validation rules filter them.
Volume confirmation strengthens the setup.
___________________________________________________________
❗ Why It Matters?
Represents buyer dominance with sellers weakening over time.
Provides a clear breakout entry with strict SL and TP.
Helps traders capture trending moves while minimizing false signals.
Rule-based framework improves discipline and consistency.
___________________________________________________________
🎯 Conclusion
The Bullish Ascending Triangle Pattern is a reliable continuation signal for trend traders.
By combining Higher Highs, Higher Lows, and breakout confirmation, traders can enter with confidence, manage risk, and trail profits effectively.
🔥 Patterns don’t predict. Rules protect. 🚀
___________________________________________________________
⚠️ Disclaimer
📘 For educational purposes only.
🙅 Not SEBI registered.
❌ Not a buy/sell recommendation.
🧠 Purely a learning resource.
📊 Not Financial Advice.
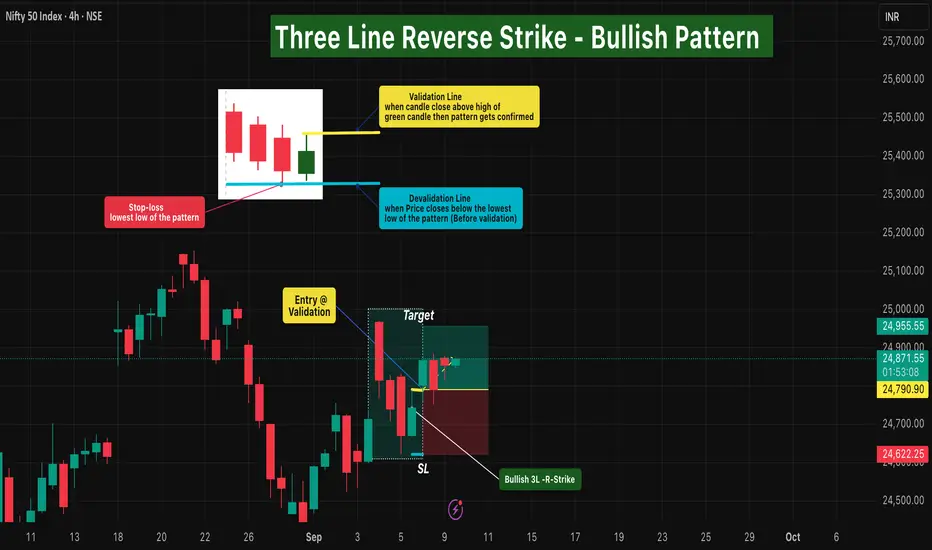
Three Line Reverse Strike - Bullish Pattern (NIFTY-4H)🔹 Intro / Overview
The Three-Line Reverse Strike (Bullish Pattern) is a rare yet powerful reversal setup.
It forms when three consecutive strong bearish candles 🟥 🟥 🟥 are immediately followed by a strong bullish candle 🟩
This sudden shift shows sellers losing control and buyers stepping in with conviction.
“3 Bears fall… 1 Bull strikes back stronger 🐂"
___________________________________________________________
📖 How to Use
✅ Validation Line → High of the Bullish candle.
❌ Devalidation Line → Lowest Low of the entire 4-candle pattern(Before Validation).
- Entry → Confirmed when any current candle closes above the Validation line.
- Stop-Loss → Lowest Low of the pattern.
- Target → 1x the stop-loss distance.
- Trailing → Remaining lots can be managed using ATR, Fibonacci levels, Box Trailing, or swing structure for extended upside.
____________________________________________________________
🎯 Trading Plan(educational only)
Entry → On close above Validation line (Bullish High).
Stop Loss → Lowest Low of the pattern.
Target → First TP at 1R (Entry–SL distance).
Remaining lots → Trail with volatility tools to capture extended trends.
____________________________________________________________
📊 Chart Explanation
- This is a positional setup 🕰️:
- 3️⃣ Strong Bearish candles show seller dominance.
- 1️⃣ Strong Bullish candle reverses momentum and forms the setup.
- Validation → High of the Bullish candle.
- Devalidation → Lowest Low of the (3 Bearish + 1 Bullish) sequence.
-Lowest Low ⛔, Target = 1R 🎯, trailing for extended move 🚀.
____________________________________________________________
👀 Observation
- Most effective after prolonged downtrends or near support zones.
- Works best with confirmation from volume and EMA trend filters.
- Provides a clear visual shift from bearish momentum to bullish reversal.
____________________________________________________________
❗ Why It Matters?
- Shows sellers exhausting after consecutive pressure.
- Buyers step in aggressively with a strong bullish candle.
- Gives a structured entry, SL, and TP framework.
- Reduces noise by relying on a clear multi-candle sequence.
____________________________________________________________
🎯 Conclusion
The Three-Line Reverse Strike – Bullish Pattern highlights a powerful momentum shift.
By applying strict Validation, Devalidation, and disciplined stop-loss rules, traders can capture strong reversals while limiting risk.
🔥 Patterns don’t predict. Rules protect.
____________________________________________________________
⚠️ Disclaimer
📘 For educational purposes only.
🙅 Not SEBI registered.
❌ Not a buy/sell recommendation.
🧠 Purely a learning resource.
📊 Not Financial Advice.
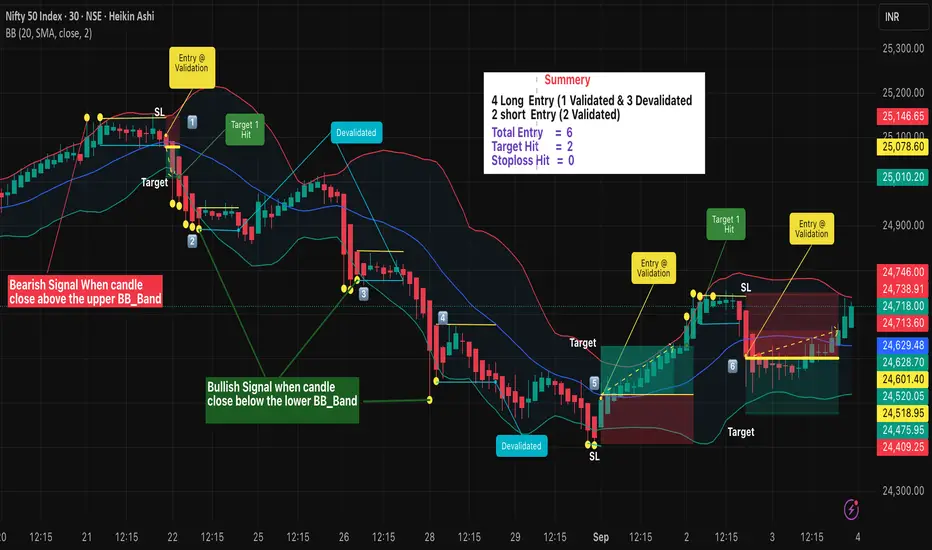
Heikin Ashi with Bollinger Bands – Rule-Based Reversal Strategy🔹 Intro / Overview
The Bollinger Bands are one of the most widely used indicators for identifying overbought and oversold market conditions.
They consist of an upper band, middle band (SMA), and lower band that expand and contract based on volatility.
In this setup, we focus on Bullish and Bearish signals generated when price closes outside the bands.
Heikin Ashi Chart In this idea Apply Boolinger band on Heikinashi chart to capture reversal signals.Heikin Ashi candles help reduce market noise, providing smoother price action and clearer trend signals.
When combined with Bollinger Bands, they offer disciplined entries, defined stop losses, and structured target management.
---
📖 How to Use
🔴 Bearish Signal - Appears after a uptrend
- Trigger → Candle closes above the Upper Band. (Signal candle)
- Candle High = Devalidation line.
- Candle Low = Validation line.
- Entry Confirmed → When price closes below the validation line.
- ❌ No Entry → If price moves above the devalidation line before validation.
🟢 Bullish Signal - Appears after a downtrend
- Trigger → Candle closes below the Lower Band. (Signal candle)
- Candle High = Validation line.
- Candle Low = Devalidation line.
- Entry Confirmed → When price closes above the validation line.
- ❌ No Entry → If price moves below the devalidation line before validation.
- 👉🏼 RESET → if Another New Trigger Comes Before Validation-Devalidation, the system RESET Validation and devalidation line to new values.
---
🎯 Trading Plan
- Entry → On validation close (Bearish: below signal Candle Low, Bullish: signal Candle above High).
- Stop Loss (SL) → Signal candle low for Bullish, signal candle high for Bearish.
- Target → 1R (equal to risk: Entry–SL distance).
- Remaining Lots → Trail with ATR, Fibonacci, Box Trailing, or structure-based stops for extended moves.
---
📊 Chart Explanation
1️⃣ 🛑Bearish Signal →
- Candle validated as price closed below the validation line .
- 🎯 Target 1 achieved, remaining lots managed with trailing methods. Exit may occur at swing bottom with best trailing method.
2️⃣ 🟢 Bullish Signal →
- ❌ Candle Devalidated as price closed below the devalidation line . . no Entry
3️⃣ 🟢Bullish Signal →
- ❌ Candle Devalidated as price closed below the devalidation line . . no Entry
4️⃣ 🟢Bullish Signal →
- ❌ Candle Devalidated as price closed below the devalidation line . . no Entry
5️⃣ 🟢Bullish Signal →
- Candle validated as price closed above the validation line
- 🎯 Target 1 achieved, remaining lots managed with trailing methods. Exit may occur at swing top with best trailing method.
6️⃣ 🛑Bearish Signal →
- Candle validated as price closed below the validation line .
-Still active during trading hours, monitoring continues.
---
👀 Observation
- Bearish signals are more effective during strong uptrends when volatility peaks.
- Bullish signals work best at market bottoms or oversold conditions.
- Early invalidations prevent false entries.
- Trailing stops allow scaling out while capturing bigger moves.
---
❗ Why It Matters?
- Provides rule-based trading using Bollinger Bands, not just blind signals.
- Validation & devalidation ensure disciplined entries.
- Helps traders avoid chasing moves by waiting for confirmation.
- Enhances risk management with clear SL & trailing systems.
---
🎯 Conclusion
The Bollinger Band Strategy offers structured bullish & bearish setups.
By combining validation lines, devalidation rules, and trailing systems, traders can capture high-probability trades while avoiding false signals.
🔥 Patterns don’t predict. Rules protect. 🚀
⚠️ Disclaimer
📘 For educational purposes only · 🙅 Not SEBI registered · ❌ Not a buy/sell recommendation · 🧠 Purely a learning resource · ❌ Not financial advice.
Hammer Candlestick Reversals - Bullish & Bearish Setups🔹 Intro / Overview
In this idea, we focus on the Hammer candlestick pattern — both Bullish and Bearish variations.
The Hammer is a powerful reversal signal formed with a small body, a long shadow, and defined highs/lows.
When combined with EMA High–Low Band Confirmation and swing structure, it creates rule-based trading opportunities with clear validation and devalidation rules.
---
📖 Bullish & Bearish Hammer Intro
🟢 Bullish Hammer → Appears after a downtrend / at swing low . Buyers step in strongly, rejecting lower prices.
- EMA Band should be above the candle.
- Candle High = Validation line.
- Candle Low = Devalidation line.
- Entry → Close above the High.
- Stop-Loss → Candle Low.
- Target → 1x risk, with remaining lots trailed (ATR, Fibonacci, Box Trailing).
🔴 Bearish Hammer → Appears after a uptrend / at swing high . Sellers take control after rejecting higher prices.
- EMA Band should be below the candle.
- Candle Low = Validation line.
- Candle High = Devalidation line.
- Entry → Close below the Low.
- Stop-Loss → Candle High.
- Target → 1x risk, with remaining lots trailed.
---
📌 How to Use
🟢 Bullish Hammer Spotted
- Validation → Close above the Hammer’s high.
- Devalidation → Close below the Hammer’s low. (before validation)
- SL → Hammer Low.
- Target → 1x risk, remaining lots trail with ATR/Fibonacci.
🔴 Bearish Hammer Spotted
- Validation → Close below the Hammer’s low.
- Devalidation → Close above the Hammer’s high. (before validation)
- SL → Hammer High.
- Target → 1x risk, remaining lots trail with ATR/Fibonacci.
---
🎯 Trading Plan
- Entry → On validation close (Bullish above High, Bearish below Low).
- Stop Loss → Defined by Hammer candle (Low for Bullish, High for Bearish).
- Target → First TP = 1R, Remaining lots trailed for extended moves.
---
📊 Chart Explanation
1️⃣ 🟢 Bullish Hammer Spotted
- Candle validated as price closed above the high.
- 🎯 Target 1 achieved, remaining lots managed with trailing methods. Trailing Exit could be at swing top with best trailing
2️⃣ 🛑 Bearish Hammer →
- Candle validated as price closed below the low.
- 🎯 Target 1 achieved, remaining lots managed with trailing methods. Trailing Exit could be at swing bottom with best trailing
3️⃣ 🛑 Bearish Hammer →
- ❌ Devalidated
- Candle devalidated as price closed above the high.
4️⃣ 🛑 Bearish Hammer →
-Candle validated as price closed below the low.
⛔ Stop-Loss hit
- stop loss ensures risk management and discipline in trading.
5️⃣ 🛑Bearish Hammer →
-Candle validated as price closed above the low.
- 🎯 Target 1 achieved, remaining lots managed with trailing methods. Trailing Exit could be at swing bottom with best trailing
---
👀 Observation
- Bullish Hammer → Works best after prolonged downtrend at support zones.
- Bearish Hammer → Stronger after extended uptrends or near resistance zones.
- EMA Band → Confirms market bias and filters false signals.
- Risk Management → Defined SL + structured TP protect capital and maximize reward.
---
❗ Why It Matters?
- Clear rules: Validation, Devalidation, Entry, SL, and TP.
- Combines price action (Hammer) with EMA Band confirmation.
- Ensures disciplined trading instead of emotional decisions.
- Allows both conservative and aggressive management via trailing.
---
🎯 Conclusion
The Bullish & Bearish Hammer patterns, when combined with EMA High–Low Band confirmation, provide a structured reversal trading strategy.
By following strict entry, SL, and TP rules, traders can filter false setups and capture strong reversals at swing highs and lows.
🔥 Patterns don’t predict. Rules protect. 🚀
---
⚠️ Disclaimer
For educational purposes only · Not SEBI registered · Not a buy/sell recommendation · Not financial advice — purely a learning resource.

Bearish Hammer with EMA High-Low Band - Rule Based Entry 🔹 Intro / Overview
The Bearish Hammer candlestick is a signal of potential downside reversal.
It forms when buyers push price higher, but sellers regain control and close the candle near its low.
When combined with EMA High–Low Band confirmation, it creates a disciplined setup to identify short trade opportunities with clear rules.
---
📖 How to Use
✅ Validation → A valid signal occurs when the close price is below the low of the Bearish Hammer.
❌ Invalidation → If the close price crosses above the high of the Bearish Hammer, the signal is invalid. (Before validation )
EMA Band Confirmation:
- The Bearish Hammer must be above the EMA High–Low Band.
- The EMA High-Low band should not touch the Bearish Hammer.
- This ensures the setup aligns with bearish conditions.
✅ Bearish Hammar High must be swing high
---
🎯 Trading Plan
Entry → Enter short when the close price is below the Hammer’s low (validation line).
Stop-Loss (SL) → The high of the Bearish Hammer candle(Swing High)
Target (TP):
- First Target → 1R (equal to the risk defined by Entry–SL distance).
- Remaining Lots → Trail using ATR, Fibonacci levels, Box Trailing, or structure-based stops.
---
📊 Chart Explanation
- The Bearish Hammer shows rejection of higher prices, with a small body near the low and a long upper shadow.
- The EMA High–Low Band sits below the candle, and the Hammer forms above the band (no touch), confirming the setup.
- Validation occurs when the next close is below the Hammer’s low.
- Invalidation occurs if price closes above the Hammer’s high(before Validation)
---
👀 Observation
Bearish Hammer Behavior → Most effective after an uptrend or at resistance zones.
EMA Role → Ensures trade alignment with broader market bias.
Risk Management → SL above Hammer high, TP at least 1:1, with trailing options for extended downside moves.
---
❗ Why It Matters?
- Shows buyers losing strength.
- Sellers step back in and dominate.
- EMA Band ensures cleaner filtering of weak signals.
- Provides a strict framework for entry, SL, and targets.
---
🎯 Conclusion
The Bearish Hammer, combined with EMA High–Low Band confirmation, creates a structured short setup.
Using strict validation, devalidation, and risk management, traders can filter false signals and ride potential bearish moves with confidence.
🔥 Patterns don’t predict. Rules protect.
---
⚠️ Disclaimer
For educational purposes only · Not SEBI registered · Not a buy/sell recommendation · Not financial advice — purely a learning resource.

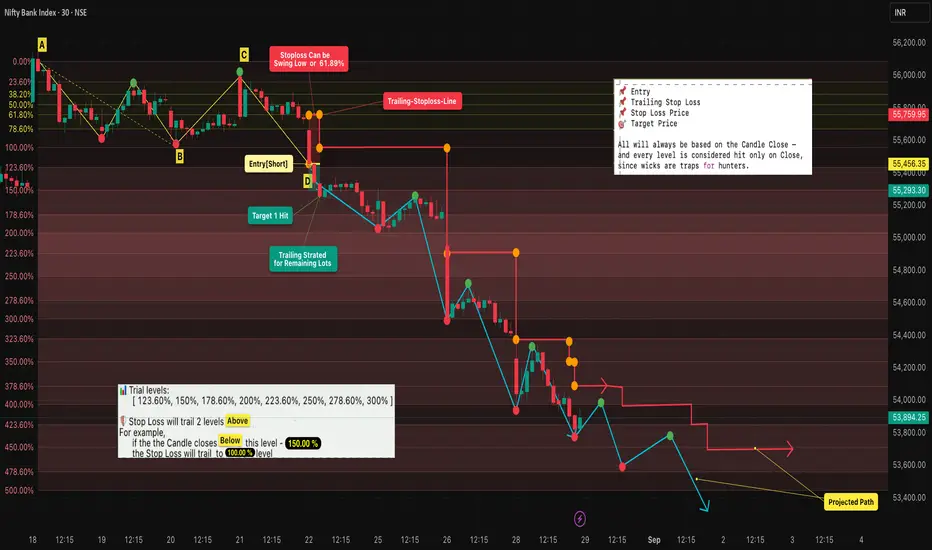
Fibonacci Trailing : Lock Profits & Ride Trends [BANKNIFTY]🔹 Intro / Overview
Managing trades after entry is just as critical as spotting the entry itself.
In this idea, we apply Fibonacci retracements with a trailing stop system to capture profits while staying disciplined.
A well-structured trailing plan helps traders:
✅ Lock in gains early
🛡️ Protect capital against reversals
📊 Stay rule-based instead of emotional
📈 In this case study, BANKNIFTY aligned well with Fibonacci retracement levels , showcasing how these concepts can work in practice as an educational example.
---
📖 Concept
- A swing High (A) to Low (B) defines our Fibonacci retracement zones.
- Retracements (C) test Fibonacci levels but don’t confirm entry until structure is validated.
- Entry (D) occurs only after a successive close confirms the short trade.
- Stop Loss (SL) is placed at the 61.8% retracement (closer and more protective than the far swing).
- Trailing: SL trails forward only , two Fib levels behind price. It manages the remaining position after booking partial profits.
---
📊 Chart Explanation (Step-by-Step)
1️⃣ Swing Definition
📍 A = Swing High
📍 B = Swing Low
2️⃣ Retracement Testing
- C → first retracement (no confirmation) - Here there's a retracement but due to the candle closes below the 38.20% level so devalidation doesn't occured.
3️⃣ Entry Point
✅ At D, successive closes confirm → short entry taken
4️⃣ Stop Loss (SL)
📉 Set at 61.8% retracement for tighter risk management
5️⃣ Targets & Trailing
🎯 Target 1 hit → exit one lot, secure partial profits
🔄 Remaining lots managed with trailing system:
• SL adjusted only forward , never backward
• SL trails as price moves down:
• 150% → SL to 100%
• 178.6% → SL to 123.6%
• 200% → SL to 150%, etc.
6️⃣ Projected Path
🔍 Blue/red paths illustrate how price could move while trailing locks in gains
---
🔍 Observations
📌 Entry validated on structure → reduces false signals
🎯 Booking partial profits builds confidence and ensures realized gains
🔄 Trailing maximizes potential while staying safe
📊 Fib-based progression keeps decisions mechanical, not emotional
---
✨ Why It Matters
✔ Turns static Fibonacci into a dynamic strategy
✔ Prevents giving back profits when trends reverse
✔ Adds confidence and discipline in trade management
✔ Teaches how to scale out smartly
---
✅ Conclusion
Fibonacci retracement alone gives levels — but combining it with a trailing stop system transforms it into a complete trade plan.
By booking partial profits and trailing the rest:
🛡️ You protect capital
🚀 You ride trends longer
🤝 You trade with discipline instead of emotion
---
⚠️ Disclaimer
For educational purposes only · Not SEBI registered · Not a buy/sell recommendation · No investment advice — purely a learning resource
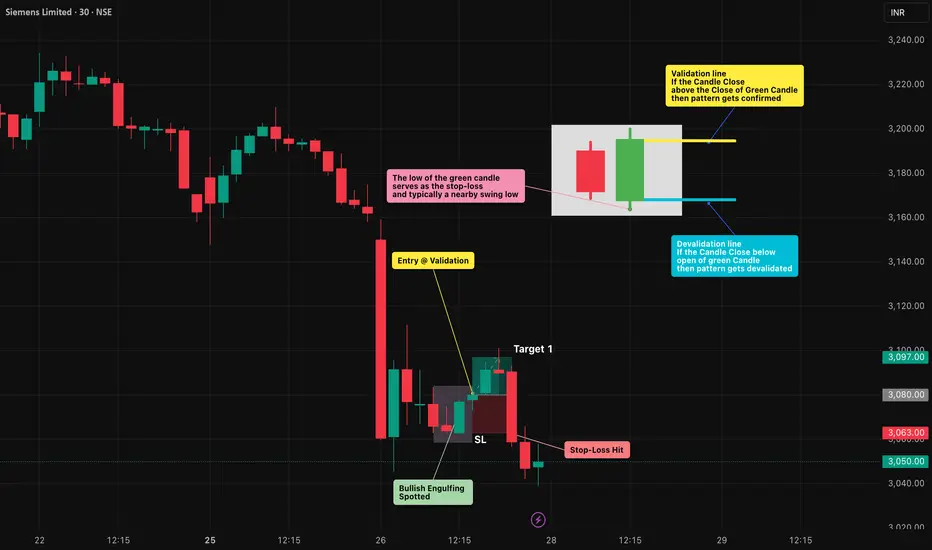
Bullish Engulfing Pattern: Spotting Reversals with Discipline🔎 Intro / Overview
Managing risk is just as important as finding an entry. The Bullish Engulfing is one of the most effective candlestick patterns to identify potential reversals. When traded with discipline, it signals a shift from seller pressure to buyer control, helping traders time their entries with confidence.
📔 Concept
A Bullish Engulfing occurs when:
The first candle is a small red candle that continues the downtrend.
The next candle is a large green candle whose body completely engulfs the red candle’s body .
👉 This shows a clear psychological shift — sellers push lower (red candle), but buyers step in strongly (green candle) and reclaim control.
📌 How to Use
✅ Validation → The candle must close above the close of the green candle.
❌ Invalidation → If price closes below the open of the green candle before confirmation.
Trading Plan:
Entry → After confirmation of the green candle’s close.
Stop-Loss (SL) → Below the low of the green candle.
Take-Profit (TP) :
Conservative → 1R (Entry → SL distance)
Moderate → 2R
Aggressive → Book partial at 1R and trail the rest using tools like ATR, Fibonacci levels, or structure-based stops to ride any extended upside move.
📊 Chart Explanation
On the chart, the first small red candle shows sellers continuing the downtrend. The next large green candle completely engulfs the red candle’s body and closes higher — signaling that buyers have taken control.
The pattern was validated at the close of the green candle , where the long entry was taken. The low of the green candle is used as the stop-loss level, while the targets are mirrored in reverse using the same distance.
In this example, Stop-loss was quickly achieved . From there, traders can apply trailing stop methods to lock in profits and manage further upside targets.
👀 Observation
Most effective at support zones or after a prolonged downtrend .
A high-volume green candle adds conviction to the signal.
In sideways/choppy markets , it can produce false signals — always filter with structure and indicators.
❗ Why It Matters?
The red candle shows seller pressure .
The green candle shows buyer strength .
This clear shift in control creates a rule-based setup with defined entry, SL, and TP.
🎯 Conclusion
The Bullish Engulfing is a strong sign of reversal — but only when combined with structure, confirmation, and disciplined risk management.
🔥 Patterns don’t predict. Rules protect.
⚠️ Disclaimer
For educational purposes only · Not SEBI registered · Not a buy/sell recommendation · No investment advice — purely a learning resource
Bearish Engulfing Pattern: Spotting Reversals with Discipline🔎 Intro / Overview
Managing a trade after entry is just as important as finding the right setup. The Bearish Engulfing is one of the most reliable candlestick patterns to spot potential reversals. When traded with discipline, it helps you recognize momentum shifts early and manage risk objectively.
📔 Concept
A Bearish Engulfing occurs when:
The first candle is a small green candle that continues the uptrend.
The next candle is a large red candle whose body completely engulfs the green candle’s body .
👉 This shows a clear psychological shift — buyers push higher (green candle), but sellers step in aggressively (red candle) and erase those gains.
📌 How to Use
✅ Validation → The candle must close below the open of the red candle.
❌ Invalidation → If price closes above the close of the red candle before confirmation.
Trading Plan:
Entry → After confirmation of the red candle’s close.
Stop-Loss (SL) → Above the high of the red candle which is also a swing high.
Take-Profit (TP) :
Conservative → 1R (Entry → SL distance)
Moderate → 2R
Aggressive → Book partial at 1R and trail the rest using tools like ATR, Fibonacci levels, or structure-based stops to ride any extended downside move.
📊 Chart Explanation
On the chart, the first small green candle represents buyers continuing the uptrend. The next large red candle completely engulfs the green candle’s body and closes lower, signaling that sellers have taken control.
The pattern was validated at the close of the red candle , where the short entry was taken. The high of the red candle is used as the stop-loss level, while the targets are mirrored in reverse using the same distance.
In this example, Target 1 was quickly achieved . From there, traders can apply trailing stop methods to lock in profits and manage further downside targets.
👀 Observation
Works best when the pattern forms at major resistance levels or after a sustained uptrend .
A high-volume red candle strengthens the reliability of the signal.
In sideways or choppy conditions , false signals are common — always confirm with structure and indicators before acting.
❗ Why It Matters?
The green candle shows buyer optimism .
The red candle shows seller dominance .
This clear flip in control creates a rule-based setup with defined entry, SL, and TP.
🎯 Conclusion
The Bearish Engulfing is a strong sign of reversal — but it’s powerful only when combined with structure, confirmation, and disciplined risk management.
🔥 Patterns don’t predict. Rules protect.
⚠️ Disclaimer
For educational purposes only · Not SEBI registered · Not a buy/sell recommendation · No investment advice — purely a learning resource
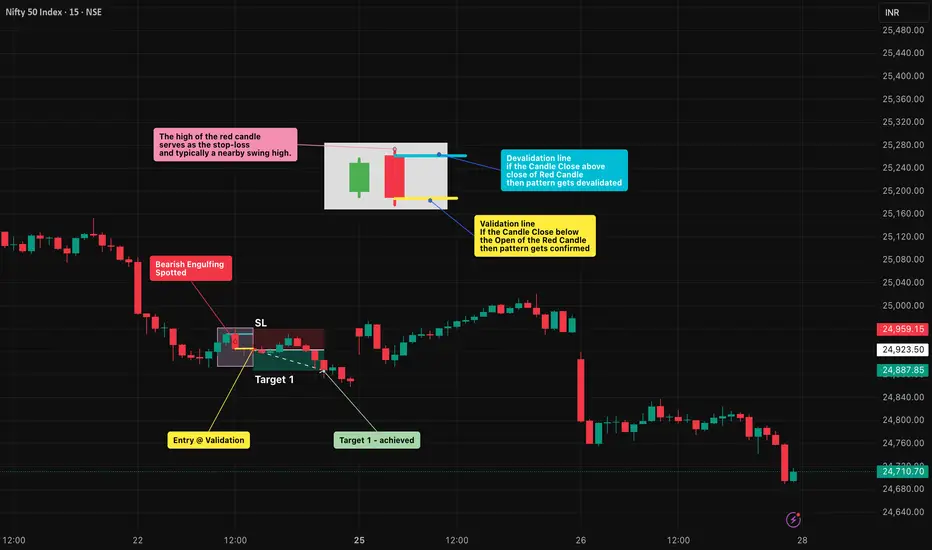
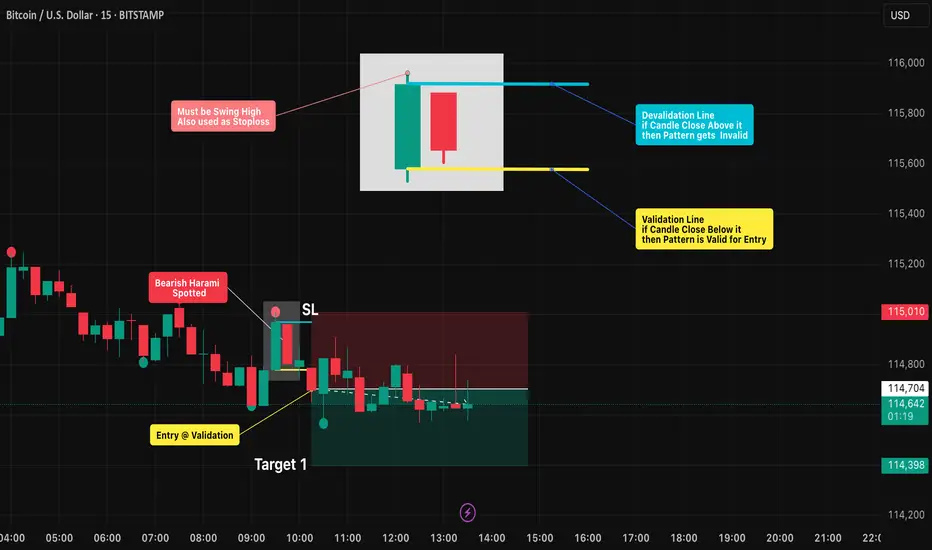
Bearish Harami Pattern: Spotting Reversals with Discipline🔻Bearish Harami Pattern: Spotting Reversals with Discipline
Intro / Overview
The Bearish Harami is a candlestick reversal pattern that often appears at the end of an uptrend.
It signals a possible shift where bullish momentum weakens and sellers begin to step in.
The first candle’s high must be a swing high , and this level can also be used as a stop-loss reference.
To trade it effectively, spotting the formation is not enough — strict validation and invalidation rules are key to avoid false signals.
✨ Concept
A Bearish Harami is a two-candle pattern:
- First candle (Green🟢): A strong bullish candle showing buyer dominance.(Swing high)
- Second candle (Red🔴): A smaller bearish candle whose body is fully inside the prior green candle’s body (wicks ideally inside).
This forms the “harami” structure, where the red candle looks like it is “inside the green candle,” suggesting a pause in bullish pressure and potential reversal.
📖 How to Use
1️⃣ Identify the pattern: Look for a large green candle followed by a smaller red candle contained within it.
2️⃣ Validation Point: The setup is validated if price closes below the open of the green candle within the next few candles.
3️⃣ Invalidation Point: The setup is invalidated if price closes above the close of the green candle before validation occurs.
4️⃣ Stop-Loss & Targets:
- Stop-loss (SL): Place at or just above the swing high (first green candle high).
- Target (TP): 1x, 2x, or more times the distance between entry and stoploss.
5️⃣ Enhance Reliability: Combine with resistance levels, trendlines, moving averages, or other candlestick signals to filter out weak setups.
📊 Chart Explanation – Step by Step
✔ The Bearish Harami pattern was spotted after a clear uptrend.
✔ The following candle closed below the green candle’s open → Validation confirmed ✅.
✔ A short entry was taken on the same candle.
✔ A Bearish Harami pattern has also been drawn and highlighted on the chart.
🔍 Observation
- If Target 1 is achieved → book 2 lots , and trail the remaining position with a stop-loss.
- Harami is only a potential reversal → confirmation is necessary.
- Breakdown below the green candle’s open = sellers in control 🔻.
- Breakout above the green candle’s close = setup failure ❌.
- Patience is key — wait for confirmation before entering.
📌 Why It Matters?
The Bearish Harami helps traders by:
- Reducing false reversal trades with strict rules.
- Providing clear entry/exit levels with discipline.
- Enforcing risk management via pre-defined SL & TP.
✅ Conclusion
The Bearish Harami becomes powerful when traded with discipline.
By marking the open and close of the green candle, traders can clearly separate a valid short trade from a failed setup.
With a stop-loss at the swing high and take-profits at 1x, 2x, or more, while trailing further lots, the Harami offers a structured, rule-based strategy.
⚠️ Always remember: the pattern shows possibility → price confirmation makes it probability .
⚠️ Disclaimer
For educational purposes only · Not SEBI registered · Not a buy/sell recommendation · No investment advice — purely a learning resource
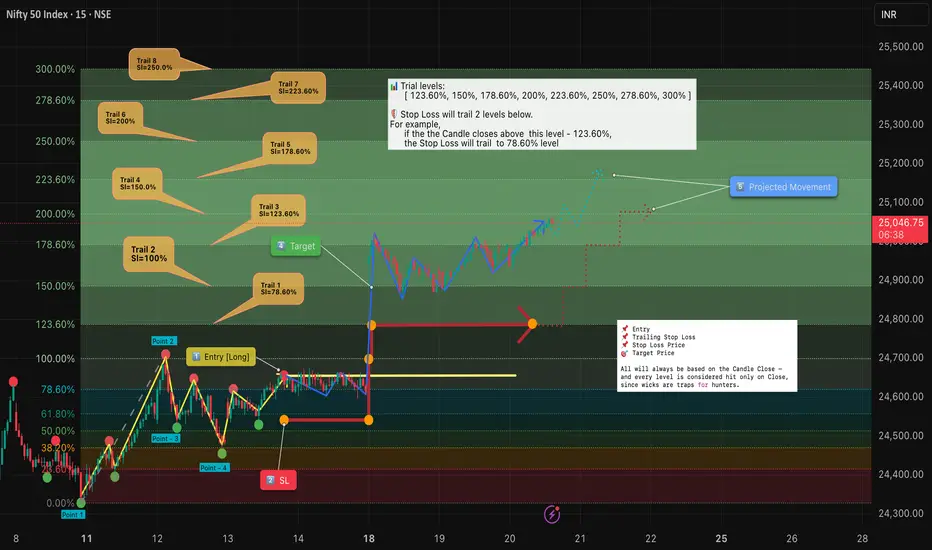
Trailing Stops: Protect Profits & Ride the Trend with Discipline🔹 Intro / Overview
Managing a position after entry is just as important as identifying the entry itself.
Here, we are specifically discussing trailing stops using Fibonacci retracements .
A well-structured trailing stop helps traders:
✅ Lock in profits
🛡️ Reduce risk
📊 Stay objective in the face of market noise
This idea shows how trailing stops can be applied in a structured way to complement Fibonacci retracements and trend management.
📖 Concept
📍 A trailing stop is a dynamic stop-loss that adjusts as price moves in your favor.
🔄 Instead of staying fixed, it “trails” price at a chosen distance — capturing more upside while capping downside.
🧩 Traders often trail stops using swing lows/highs, moving averages, or volatility measures like ATR .
📊 Chart Explanation (Step-by-Step)
1️⃣ Entry Criteria
✅ Successive closes above 78.6% confirm the long entry.
2️⃣ Stop Loss (SL)
📉 Placed at the previous swing low for structure-based protection.
⏩ SL adjustments move forward only with trailing rules — never backward.
3️⃣ Trailing Levels
👉 SL always trails two levels below the current trail level if the candle closes above it.
📈 Trail 1: 123.60% → SL moves to 78.60%
📈 Trail 2: 150.00% → SL moves to 100.00%
📈 Trail 3: 178.60% → SL moves to 123.60%
📈 Trail 4: 200.00% → SL moves to 150.00%
📈 Trail 5: 223.60% → SL moves to 178.60%
📈 Trail 6: 250.00% → SL moves to 200.00%
📈 Trail 7: 278.60% → SL moves to 223.60%
📈 Trail 8: 300.00% → SL moves to 250.00%
4️⃣ Target Points
🎯 At Target 1 , book one lot to secure profits.
📊 Remaining positions can be trailed further with the next levels.
5️⃣ Projected Path
🔍 Dotted blue/red projections illustrate potential movement under this trailing system.
🔍 Observations
📌 Objective Entry : Requires successive closes above 78.6%, reducing false signals.
🎯 Partial Profit Booking : Taking one lot off at Target 1 ensures realized gains.
🔄 Two-Level Trailing : Locks in profits while leaving room for trend continuation.
📊 Rule-Based Framework : Clear Fibonacci-based progression keeps decisions mechanical and consistent.
✨ Why It Matters
✔ Prevents turning winning trades into losers.
✔ Builds confidence by removing emotions from exit decisions.
✔ Lets profits run while maintaining protection.
✅ Conclusion
Trailing stops are not about perfection — they’re about discipline .
By systematically adjusting stops as the market moves, traders:
🛡️ Protect capital
🚀 Let profits run
🤝 Remove emotions from decision-making
When combined with Fibonacci retracements , trailing stops provide a structured framework to manage trades effectively after entry.
⚠️ Disclaimer : For educational purposes only · Not SEBI registered · Not a buy/sell recommendation · No investment advice — purely a learning resource
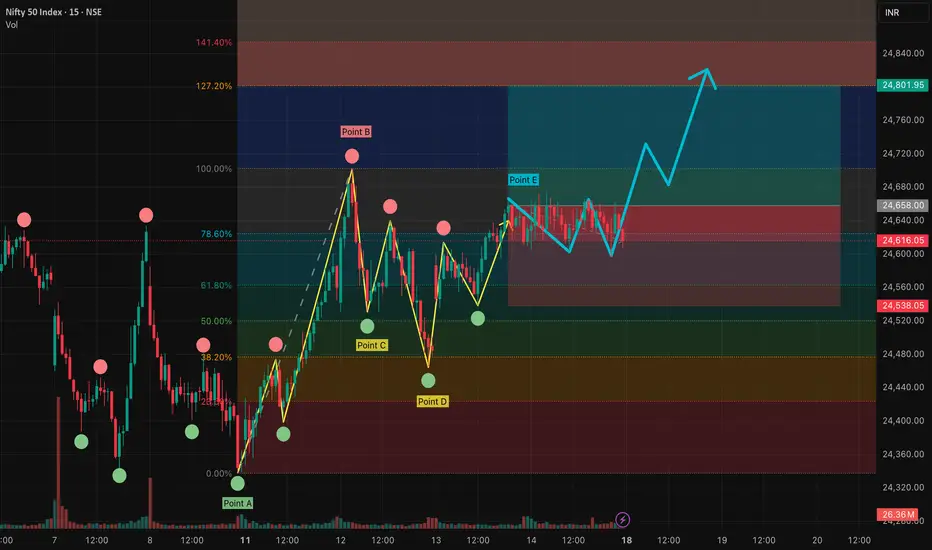
Fibonacci Retracement Explained: Smarter Entries & Exit Zones🔹 Intro / Overview
Fibonacci retracement highlights potential support and resistance zones during pullbacks. By mapping ratios between swing highs and lows, traders can structure trades, plan entries, and manage risk — not predict the market.
📖 How to Use
1️⃣ Identify Swing Points – Draw from recent swing low ➝ swing high (or reverse for downtrend)
2️⃣ Watch Key Levels – 23.6%, 38.2%, 50%, 61.8%, 78.6%
3️⃣ Confirm with Price Action – Candle closes above/below key levels = stronger signal
4️⃣ Plan Stops & Targets – Use Fibonacci zones or swing points
5️⃣ Enhance Reliability – Combine with trendlines, moving averages, or candlestick patterns
📊 Chart Explanation (Step-by-Step)
The chart demonstrates a possible long setup using Fibonacci retracement:
Point A (Swing Low) : Starting point of the retracement
Point B (Swing High) : Endpoint establishing Fibonacci ratios
Point C (Chart Confirmation) : Swing low confirming levels are relevant
Point D (Potential Invalidation) : Price dips near 38.2%–61.8%; closes below could invalidate
Point E (Entry Zone) : Successive closes above 78.6% confirm entry
🔍 Observations
Price respected multiple Fibonacci zones (38.2%, 50%, 61.8%)
Swing highs/lows defined the structure
Yellow path = past trend movement
Blue path = potential reaction for illustration only
📌 Trade Management
Stops : Just beyond Fibonacci zones or swing points
Targets : Next Fibonacci level or previous swing high/low
Reliability increases when combined with other confirmations
✨ Key Takeaways
✔ Fibonacci is a guide, not a prediction
✔ Candle closes near levels strengthen entries
✔ Stops & targets can flex with Fibonacci or swing structure
✔ Always use confluence for decision-making
✅ Conclusion
Fibonacci retracement is a visual framework to time entries and exits with discipline. Combine it with other tools for stronger setups.
⚠️ Disclaimer: For educational purposes only. Not financial advice.
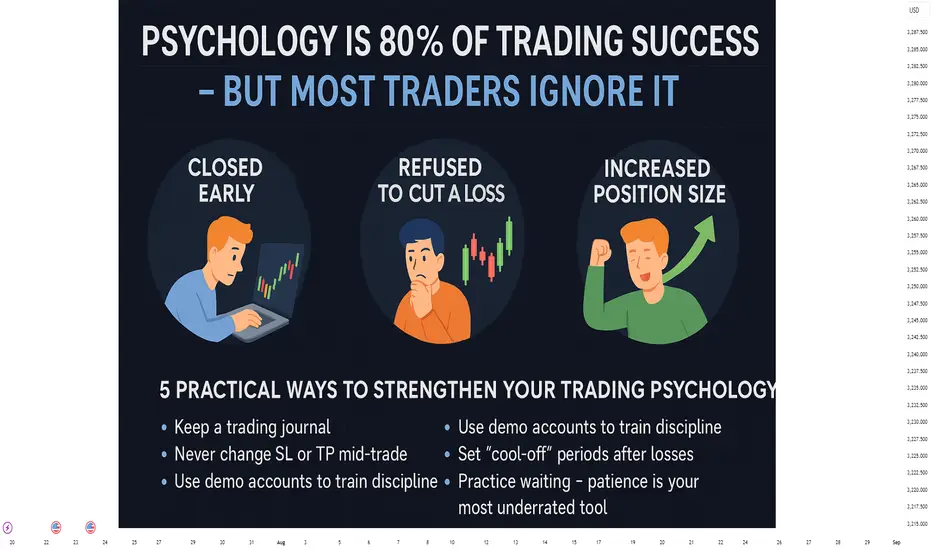
Psychology Is 80% of Trading Success But Most Traders Ignore ItPsychology Is 80% of Trading Success – But Most Traders Ignore It
“Have you ever entered a perfect trade… and still lost?”
Right direction.
Clear technical setup.
Trend confirmation was there.
Yet you closed early.
Or held a losing trade too long.
Or jumped back in out of revenge after a loss.
It wasn’t your system’s fault.
It was your psychology.
💡 Most traders don’t fail because of bad analysis – they fail because of poor emotional control
Let’s walk through some common real-life situations every trader has experienced at least once:
🎯 1. You closed your trade early – afraid the market might reverse
Case study:
A trader entered a long position on XAUUSD at a support zone (2360), aiming for TP at 2375.
But when price reached 2366, he closed out early – afraid to “lose profits.”
The market later hit his original TP perfectly.
➡️ This is classic loss aversion – the fear of losing what you’ve already gained.
🎯 2. You refused to cut a loss – hoping the price would come back
Case study:
A trader shorted EURUSD expecting a pullback, but price broke resistance and continued up.
Instead of cutting the loss, he widened his stop loss, holding onto hope.
The result? A bigger loss than planned.
➡️ This is denial – a refusal to accept you’re wrong, leading to emotional attachment to the trade.
🎯 3. You increased your position size after a winning streak
Case study:
After two strong wins, a trader feels confident and increases position size on the next trade…
Even though the setup isn’t as strong.
That trade ends in a loss – wiping out earlier profits.
➡️ This is overconfidence bias – a dangerous psychological state after wins.
📊 Technical skills only account for 20% – the remaining 80% is mastering yourself
You might:
Understand price structure
Use advanced indicators
Follow a solid trading system
But if you:
Break your stop loss rules
Scale up recklessly
Enter trades impulsively
Then your edge vanishes.
Success becomes inconsistent.
🧠 5 Practical Ways to Strengthen Your Trading Psychology
✅ Keep a trading journal – especially track your emotions
Ask: “Did I follow my plan? Or was I trading to ‘feel better’?”
✅ Never change SL or TP mid-trade
Stick to your original plan. Discipline builds consistency.
✅ Use demo accounts to train discipline, not to prove profitability
Treat each demo trade as if real money is at stake.
✅ Set mandatory “cool-off” periods after consecutive losses
For example: 2 losses = no trades for 24 hours.
✅ Practice waiting – patience is your most underrated tool
Pro traders often wait days for a valid setup. That’s not inactivity – that’s control.
🔁 Trading is not a search for the perfect system – it’s a journey of mastering your own mind
A strategy with only 55% win rate can still be highly profitable
…if paired with discipline, risk management, and emotional control.
But…
A system with 70% accuracy can still blow your account
…if your psychology breaks down under pressure.
🎯 Final Thoughts:
The financial markets reward those who can control themselves – not just those who analyze well.
You don’t need to be smarter than others.
You don’t need to master 10 indicators.
But you must be able to stay calm, act rationally, and follow your rules.
Knowledge lets you see the opportunity – but psychology determines if you survive it.
The Importance of Trading in a Higher Timeframe Context!Hello Traders!
Are you stuck in choppy price action and fakeouts on smaller timeframes? It might be because you’re ignoring the higher timeframe structure . Today, let’s understand why trading in alignment with higher timeframe context is critical for consistent and confident trades.
Why Higher Timeframe Analysis Matters
Bigger Picture Clarity: Higher timeframes (like Daily or Weekly) show the overall market structure — trend direction, key levels, and momentum.
Avoid Fake Breakouts: What looks like a breakout on the 5-min or 15-min chart could be a mere wick or pullback on the higher timeframe.
Supports Better Risk-Reward: Identifying entries aligned with higher timeframe trends allows better positioning with less chop.
Stronger Levels Hold Better: Support/resistance from higher timeframes are more respected and reliable.
Improves Confidence: When your intraday trade aligns with the larger trend, you’ll trust your entry and avoid premature exits.
How to Use Higher Timeframe in Your Trades
Start from Top-Down: Begin with Weekly → Daily → 1 Hour → then your entry timeframe (15-min/5-min).
Mark Key Levels: Identify strong support/resistance, swing highs/lows, and trendlines from higher charts.
Align Direction: Look for trades in the direction of the higher timeframe trend. Avoid counter-trend setups unless there's a confirmed reversal.
Watch for Confluence: If a smaller timeframe entry matches a higher timeframe level or pattern, it adds confluence and strength to the setup.
Rahul’s Tip
“Smart traders zoom out before they zoom in.” Always trade in the direction of strength. Let the higher timeframe guide your intraday story.
Conclusion
The higher timeframe is your GPS — it gives direction, structure, and clarity. Without it, you’re just reacting to noise. Start integrating top-down analysis into your daily routine, and you’ll see a big shift in your trade quality.
Do you check higher timeframes before trading? Let’s talk in the comments!

FOMO vs Discipline – Real Reason Traders Blow Accounts!Hello Traders!
Ever jumped into a trade just because it was flying — only to see it reverse the moment you entered? That’s FOMO (Fear of Missing Out) in action. And if you're not careful, it’s one of the fastest ways to blow up your account. Today, let’s break down the difference between FOMO-driven trades and Disciplined trades , and why only one will help you survive in this game.
FOMO Trading – The Trap Most Fall Into
Chasing Green Candles: You see a big breakout and jump in without a plan or proper setup.
No Stop-Loss, Just Hope: You enter based on emotion, not analysis — and hope the market will favor you.
Revenge Mode On: After a loss, you double your next position to "recover" faster.
Result: A few big red trades later, your account is wrecked.
Disciplined Trading – The Only Way to Last Long-Term
Defined Entry & Exit: You wait for your setup, confirm with structure or volume, then take the trade.
Stop-Loss is a Must: Risk is pre-decided, and you’re okay walking away from a losing trade.
Patience > Urgency: You sit out when the market is unclear, and strike only when odds are in your favor.
Result: Smaller, more consistent wins — and capital stays protected.
Rahul’s Tip
Markets will test your emotions every day. The trader who waits for the right pitch — like in cricket — is the one who survives. You don’t need to catch every move. You just need to catch the right one.
Conclusion:
FOMO makes you act fast, Discipline makes you act smart. In trading, slow and steady doesn’t just win the race — it helps you stay in the race . Train your mind to follow your system, not your emotions.
Which side are you currently on — FOMO or Discipline? Drop your thoughts in the comments! Let’s talk.

How to Trade Nifty Weekly Expiry with OI Shift Setup!Hello Traders!
Weekly expiry in Nifty is full of quick moves, sharp reversals, and big traps. To stay ahead of the curve, you need to track where the real money is moving — and that’s where the OI Shift Setup (Open Interest Shift) comes in. This simple but powerful method helps you read the options data live and take trades with strong conviction.
What is OI Shift?
OI (Open Interest): It shows where option writers are building or exiting positions. A sudden spike or unwinding can signal a shift in sentiment.
Shift in Support & Resistance: When Put writers shift to higher strikes and Call writers shift lower , it tells you the market range is changing.
Live Clues from Smart Money: This gives you an edge in real-time — letting you ride the move before it becomes obvious.
How to Use the OI Shift Setup on Expiry Day
Step 1 – Watch 15-Min Option Chain Updates: Look for sudden changes in highest OI build-up or unwinding.
Step 2 – Identify the Range Shift:
Example – If 22,000 PE OI drops and 22,100 PE OI rises, support has shifted up = bullish signal.
Step 3 – Combine with Price Action: Breakout from VWAP, range, or previous day high/low = confirmation.
Step 4 – Take Entry with SL Below Breakout Candle: Ride the momentum but stay risk-managed.
When This Setup Works Best
During 9:30 AM – 12:30 PM: Fresh OI gives early trend signs.
During Range Breakouts: Especially when new OI builds just before the breakout.
During Reversal Traps: If OI shifts opposite to price move, expect a false breakout and trap.
Rahul’s Tip
Let OI shift be your expiry compass. It’s not about predicting – it’s about reading the market in real-time. React smartly and follow the flow.
Conclusion
The OI Shift Setup is a must-know tool for expiry traders. Once you master how to spot range shifts through live OI data and combine it with price action, your expiry trading will become much more strategic and consistent.
Have you tried trading with OI shifts? Let’s discuss in the comments below!

What is 'Hot Money Flow' and How to Use It in Your Trades!Hello Traders!
Ever noticed how certain stocks or sectors suddenly get all the attention — with volume, price action, and buzz? That’s called Hot Money Flow . It’s the smart money rotating quickly into momentum plays — and as traders, learning how to follow it can give you a serious edge.
Let’s break it down in simple terms and learn how to ride the wave instead of missing it.
What is Hot Money Flow?
It refers to fast-moving capital that flows into stocks or sectors showing strength, momentum, or fresh news.
Smart money (like institutions, FII, or big traders) quickly shifts funds to chase short-term gains in active names.
It creates high volume, fast price movement, and short-term volatility — perfect for intraday or swing trades.
How to Identify Hot Money Flow
High Relative Volume (RVOL): Stocks trading at 2x or more their average volume show active interest.
Sector Rotation Clues: If multiple stocks from the same sector are moving together, hot money may be flowing there.
News Triggers: Stocks reacting to news, results, or budget-related triggers often attract hot money.
Breakouts with Volume: A clean breakout supported by volume is a classic hot money setup.
How to Trade with Hot Money Flow
Act Fast, But Smart: These trades don’t last forever. Enter with a clear plan — don’t chase after the move is done.
Use Tight Stop Losses: Hot money reversals can be sharp. Risk management is key.
Monitor Sector Leaders: If leaders break down, the rest may follow — stay alert.
Exit Early or Trail SL: Lock profits quickly or trail SL — these trades are momentum-based, not long-term.
Rahul’s Tip
Hot money creates waves — your job is to ride them, not fight them. Follow volume, news, and sectors — and trade like a sniper, not a machine gun.
Conclusion
Hot Money Flow is a powerful clue that shows where action is happening. If you learn to spot it early — using RVOL, sector activity, and breakouts — you’ll position yourself ahead of the crowd. Just remember, speed and discipline matter most in this game.
Have you ever caught a hot money move early? Let’s discuss in the comments below!

NVDA’s Final Act: A Breakout Waiting to HappenNVDA appears to be nearing the completion of its corrective phase, setting the stage for a potential move to new highs. The current pattern resembles a falling wedge, indicative of an ending diagonal formation, which often signals a reversal and the start of an upward trend.
The structure of the corrective channel, along with the termination of the diagonal pattern, suggests a high likelihood of a running flat formation. Buyers are likely to intensify demand pressure as the price approaches the lower boundary of the trendline. A trend reversal may occur if there is a decisive breakout above the Wave 4 level of the ending diagonal.
Buying opportunity with minimal stop is possible after the reversal from lower side of the channel. Targets can be 112 - 120 - 132 - 140.
I'll be sharing more details shortly.

Patience vs. Speed: What Makes a Successful Trader?Hello Traders!
Today, let's dive into the age-old debate of Patience vs. Speed in trading. Both traits are critical to success, but knowing when to exercise each is what separates great traders from the rest. Let’s explore how balancing patience and speed can elevate your trading game.
Patience: The Key to Long-Term Success
Patience is a cornerstone of successful trading. It involves waiting for the perfect setup, sticking to your trading plan, and not being swayed by short-term market movements. Here’s how patience can benefit you as a trader:
Better Entry Points : Waiting for the right setup, such as the perfect breakout or the ideal pullback, helps you enter trades with a higher probability of success.
Avoid Emotional Decisions : With patience , you are less likely to make impulsive trades out of fear or greed.
Long-Term Gains : Traders with patience know that trading is a marathon, not a sprint. They focus on long-term growth, rather than trying to catch every small price move.
Speed: The Edge in Fast-Moving Markets
On the other hand, speed is crucial for traders who operate in fast-paced environments. Whether it's scalping , day trading , or reacting to breaking news, speed can help you capitalize on fleeting opportunities. Here's why speed matters:
Quick Action on Signals : Speed allows you to quickly act on technical signals or breaking news. By executing trades faster than others, you can capitalize on short-term volatility.
Maximizing Profits in Short-Term Moves : Speedy traders can take advantage of small price movements to secure profits before the market moves against them.
Faster Adaptation : Speed enables traders to adjust their strategy quickly in response to new market conditions.
Striking the Balance: Patience and Speed
The best traders understand that both patience and speed have their place in their strategy. Here’s how to strike the right balance:
Patience for Setup : Take your time to wait for the best possible entry point. Don’t rush into trades without confirming the setup.
Speed for Execution : Once the trade setup is confirmed, don’t hesitate. Execute the trade quickly to lock in the opportunity.
Know When to Act : Some trades require quick action, while others need more patience to develop. The key is knowing when to exercise each quality.
Conclusion: Mastering Patience and Speed
Successful trading is not about choosing one over the other, but about knowing how to balance patience for finding the right opportunities with the speed to act on them when the time comes. With the right balance, you can become a more efficient and profitable trader.
What do you think? Do you prefer patience or speed in your trades?
Let’s discuss in the comments below!

Leverage Trading vs. Cash Trading: Understanding Risk and RewardHello Traders!
In today’s post, we’ll explore the difference between Leverage Trading and Cash Trading , and how to understand the Risk vs. Reward dynamics in each. Both methods have their pros and cons, and it's essential to choose wisely depending on your trading goals and risk tolerance. Let’s break down both types:
Leverage Trading:
Leverage allows you to control a larger position with a smaller amount of capital by borrowing funds from a broker. This can amplify your potential profits, but it also increases your risk significantly. With leverage, you can earn higher returns on small price movements, but if the market moves against you, your losses can quickly escalate.
Risk: With leverage, even a small adverse move can lead to significant losses, sometimes more than your initial investment.
Reward: If the market moves in your favor, the potential for higher profits is substantial, as you're controlling a larger position.
Margin Call: If the market moves against your position, you might receive a margin call, requiring you to add more capital to maintain your position.
Cash Trading:
Cash trading, also known as spot trading , involves buying and selling assets using your own capital, without borrowing funds. This method is less risky compared to leverage trading because you’re not exposed to margin calls or the risk of losing more than your investment. However, your potential returns are limited to the capital you have available.
Risk: The risk is limited to your initial investment, and you can never lose more than what you’ve invested in the trade.
Reward: The returns are generally more moderate compared to leverage trading, but this can be a safer and more controlled approach.
Stability: With cash trading, you don’t have to worry about margin calls, making it a more stable and less stressful option for risk-averse traders.
Key Takeaways:
Leverage can offer higher rewards, but it also exposes you to higher risks.
Cash trading is safer, with limited risk, but the profit potential is more modest.
Always assess your risk tolerance and choose the appropriate trading method based on your goals.
Managing risk is critical in both types of trading. Use stop losses and risk management strategies to protect your capital.
Conclusion:
Both leverage trading and cash trading have their unique benefits and drawbacks. If you’re comfortable with higher risk and have a good understanding of the markets, leverage can provide great rewards. But if you prefer a more conservative approach with less risk, cash trading might be the better option. Always trade within your means and manage your risk effectively.
