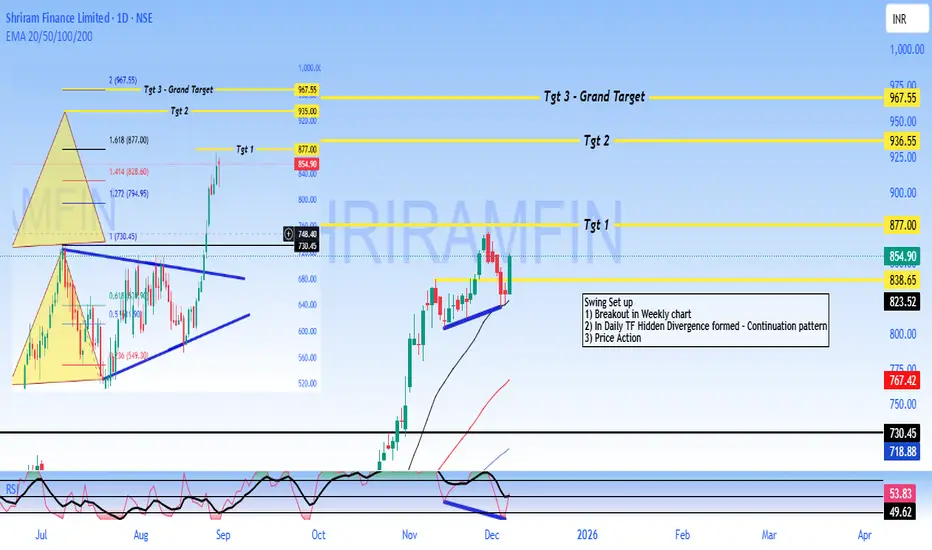
SHRIRAM - Buy - SwingTrading #Shriram Finance Limited - #Technical Analysis
Price: 854.90
#Technical Setup
Pattern: Continuation pattern with bullish hidden divergence following weekly breakout
Key Levels:
- Target 1: 877.00
- Target 2: 936.55
- Target 3: 967.55
- Support: 838 - 825 (critical)
- Major Support: 730.45
#Outlook
The chart shows a swing trading setup with upside potential toward 877 - 967 if support at 838 holds. A break below 825 would invalidate the bullish structure.
DISCLAIMER
This is NOT investment advice. This analysis is for educational purposes only. Trading involves substantial risk of loss. Always conduct your own research and consult a SEBI-registered financial advisor before making investment decisions. Past performance and technical patterns do not guarantee future results. The author assumes no responsibility for any losses incurred.
Tradingtipsforbeginners
#Bajaj Finance Limited - BUY - Technical Analysis#Bajaj Finance Limited - #Technical Analysis
Price: 1,048.00
#Swing Trading Setup
Pattern: #Range #breakout with #consolidation above breakout zone. #Triangle/Box pattern breakout with target hit. Currently forming double bottom pattern.
Key Technical Points:
1. Range breakout & consolidating above breakout area
2. EMA's sorted & aligned - price trading above all EMAs
3. Triangle/Box pattern breakout - target achieved, now forming double bottom
4. Classic divergence in recent bounce area confirming retracement completion
Target Levels:
- Target 1: 1,103.80
- Swing Target 2: 1,155.00
- Grand Target: 1,225.00
Support: 1,026 - 1,018 (critical zone)
#Outlook
Strong bullish structure with potential upside of 10-17% toward targets. The double bottom formation suggests the retracement phase is complete. Price sustaining above ₹1,048 confirms continuation toward higher targets.
⚠️ DISCLAIMER
This is NOT investment advice. For educational purposes only. Stock trading involves substantial risk. Past performance doesn't guarantee future results. Always do your own research and consult a SEBI-registered financial advisor before investing. Author assumes no responsibility for losses.
#BajajFinance #StockMarket #NSE #TechnicalAnalysis #SwingTrading #IndianStockMarket #Trading #FinTwit #ChartAnalysis #StocksToWatch #TradingView #MarketAnalysis

Indian Metals & Ferro Alloys - Buy - Swing Trading#Indian Metals & Ferro Alloys Ltd - #Swing Trade Setup
Current Price: 1,348.10
Technical Setup
Swing Trade Configuration:
✅ **All-Time High Breakout** - Stock has broken out from its previous ATH
✅ **Sorted EMAs** - Moving averages aligned in bullish formation
✅ **Consolidation Above ATH** - Price sustaining above breakout zone
✅ **Range Breakout** - Successfully broken and retested key resistance
Key Observation
Accumulation After ATH Breakout & Range Breakout After Retest
The stock is showing classic post-breakout behavior with accumulation building above the all-time high. The successful retest of the breakout level (962- 1,049 zone) has provided an excellent entry opportunity for swing traders.
Price Targets
Target 1: 1,418
Target 2: 1,498
Target 3: 1,614
Target 4: 1,829
Stop Loss: Below 1,049
Disclaimer: This analysis is for educational purposes only and should not be considered as financial advice. Trading and investing in stocks involves risk. Please conduct your own research or consult with a SEBI-registered financial advisor before making any investment decisions. Past performance is not indicative of future results.
#SwingTrading #StockMarket #TechnicalAnalysis #IndianStocks #BreakoutTrading #NSE #RetestOpportunity #TrendIsYourFriend #IMFA #MetalStocks

BIL - Buy - ATH Breakout#Bhartiya International Limited - Technical Analysis Report
Current Price: 879.85
Market Overview
Bhartiya International is displaying strong bullish momentum after successfully retesting its 2017 high breakout level. The stock is currently sustaining above recent highs, indicating robust buyer interest and potential for further upside.
Technical Setup
Swing Trade Configuration:
- Entry Zone: Current levels around 880
- Stop Loss: 851.50 (below recent consolidation)
- Risk-Reward: Favorable with multiple upside targets
Price Targets:
- Near-term: 961 / 1018 / 1099 / 1253
- Long-term: 1330 / 1720
Key Technical Observations
1. **2017 High Breakout Retest:** The stock has successfully broken out and retested the 2017 high resistance, which has now converted into support. This is a classic bullish pattern indicating strength.
2. **50-period EMA Support:** Price is sustaining above the 50 EMA, confirming the uptrend remains intact.
3. **Hidden Divergence:** The chart shows hidden divergence on lower timeframes, typically indicating trend continuation - a bullish signal for swing traders.
4. **Higher Highs Formation:** The stock is consistently making higher highs, demonstrating strong momentum and buyer dominance.
Trading Strategy
The setup favors swing traders looking for medium-term gains. The retracement and previous all-time high methodology suggests a structured approach to profit booking at each target level while maintaining a trailing stop loss.
Targets based on Fibonacci retracement, previous retracement patterns, and historical ATH analysis.
**Disclaimer:** This analysis is for educational purposes only. Please conduct your own research and consult with a financial advisor before making investment decisions. Past performance does not guarantee future results.

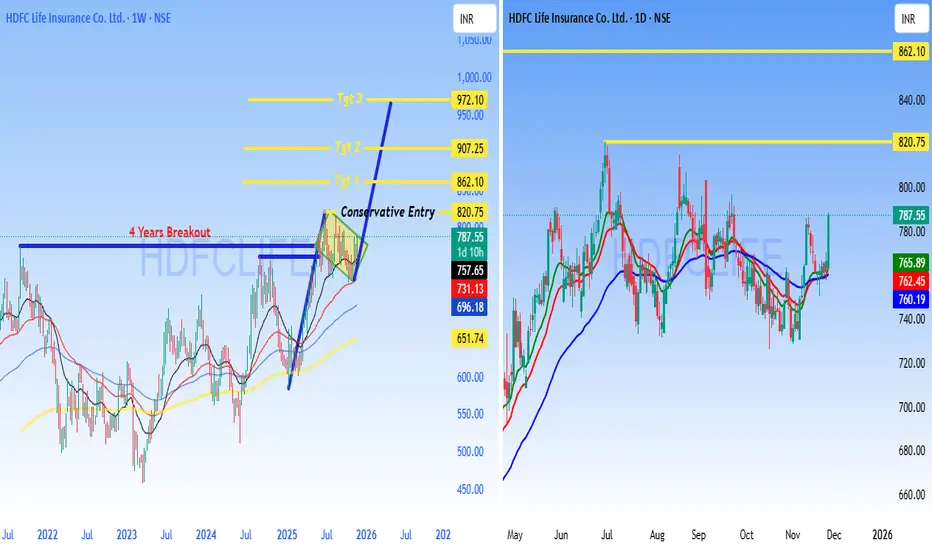
HDFCLIFE - BUY - Technical AnalysisHDFC Life Insurance - 4-Year Breakout Setup
HDFCLIFE (NSE) Current Price: 787.55
Date: November 27, 2025
Key Highlight: 4-YEAR BREAKOUT CONFIRMED
HDFC Life has broken out from a **4-year consolidation zone** around 787, signaling a major technical development with significant upside potential.
Technical Setup
4-Year Resistance Breakout - Stock cleared multi-year hurdle
Strong Volume Confirmation - Breakout supported by buying interest
Higher Highs Pattern - Bullish structure on daily chart
Moving Averages Aligned - Trending above key EMAs
Price Targets
Target 1: 862.10
Target 2: 907.25
Target 3: 972.10
Conservative Entry: 820.75 (post-retest confirmation)
Trading Plan
Entry Zone: 787-820
Stop Loss: Below 757 (breakout invalidation)
Risk:Reward: 1:3+ favorable setup
Strategy: Long-term breakout traders can accumulate; conservative traders wait for pullback to ₹820 zone.
- 4-year resistance breakouts often lead to sustained rallies
- Insurance sector showing strength
- Strong institutional interest in HDFC Life
- Technical + fundamental alignment
Risk Management
- Use stop loss below 757
- Position size: Risk only 1-2% capital
- Trail stop loss as targets are achieved
- Monitor broader market conditions
DISCLAIMER
**NOT investment advice. For educational purposes only.** I am NOT a SEBI registered analyst. This is technical analysis based on chart patterns. Trading involves substantial risk. Do your own research (DYOR). Consult a financial advisor before investing. Trade at your own risk.
**#HDFCLIFE #Breakout #StockMarket #NSE #TechnicalAnalysis #Insurance #Trading #IndianStocks #ChartAnalysis #SwingTrading #BreakoutTrading #TradingView #StockAlert #BullishSetup #PriceAction**
Sunpharma Buy - Trade confirmationSunpharma - Bullish Breakout
1) Strong Trendline Breakout
2) From recent low made Higher High
3) Solid Range Breakout
4) EMA crossover and Sorted.
Disclaimer - Charts shared are for educational purposes only. It’s not a trade recommendation. Market are subject to financial risk, Do your own analysis before initiating any Trade.

BharatForge - Swing Trade SetupBullish Setup
Buy already activated. Buy on Dips
1) On weekly TF made Breakout & made strong HH
2) Earlier on prev swing made Hidden Divergence
- Trend Cont Pattern
3) Stock riding on Parallel channel - Channel Top Tgt - 1481
4) EMA’s are sorted confirming Uptrend
Chart shared are for Educational purpose only, chart shared is not a Trade suggestion or recommendation, Do your own analysis, before initiating any Trade.

JTEKT India Technical AnalysisHere's a comprehensive TradingView report for JTEKT India Limited:
Current Price:160.90
📊 TECHNICAL SETUP OVERVIEW
JTEKT India is displaying a compelling technical structure within a well-defined ascending channel pattern that has been in play since the 2020 lows. The stock is currently consolidating after a significant rally and appears to be setting up for the next leg of movement.
KEY TECHNICAL OBSERVATIONS
1. Channel Pattern Analysis:
- Long-term Ascending Channel: The stock has been respecting a parallel channel since 2020, with clear support and resistance boundaries
- Current Position: Trading in the middle zone of the channel, suggesting room for movement in either direction
- Channel Support: Lower trendline around 120-130 zone
- Channel Resistance: Upper trendline projecting towards 220-240 zone
2. Moving Average Structure:
All major moving averages are sloping upward, confirming a strong bullish trend across multiple timeframes.
3. Price Action Patterns:
- Clear higher highs and higher lows formation since 2020
- Recent consolidation after touching 220+ levels suggests healthy profit-booking
- Volume expansion during rallies indicates strong buying interest
- Formation of a potential inverse head and shoulders pattern on monthly timeframe
4. Support & Resistance Levels:
Immediate Support Zones:
- S1: 148-150 (8/13 EMA cluster)
- S2: 134-135 (50 EMA + channel support)
- S3: 120-122 (psychological level + lower channel boundary)
Resistance/Target Zones:
- Target 1:188.50 (Previous swing high)
- Target 2: 209.71 (Major resistance + psychological 200 level)
- Target 3: 255.40 (Channel top + Fibonacci extension)
PROJECTION & TREND ANALYSIS
Bullish Scenario (Higher Probability):
If the stock holds above 148-150 support zone:
1. First target: 188.50 (18% upside potential)
2. Breakout above 190 could trigger momentum towards 209.71
3. Ultimate target within channel: 255.40 (58% upside from current levels)
Bearish Scenario (Risk Assessment):
Break below 134 (50 EMA) could lead to:
- Retest of 120-122 zone (channel support)
- Deeper correction to 110-115 if channel breaks
- This would invalidate the current bullish setup
CONCLUSION
JTEKT India Limited presents a well-defined bullish channel with strong moving average support. The technical structure suggests the stock is consolidating before the next leg up, with multiple targets identified.
Accumulate on dips toward 148-150, add on strength above 170, with ultimate targets of 188, 210, and ₹255.
Disclaimer: This is a technical analysis for educational purposes only. Not financial advice. Technical analysis should be combined with fundamental research, and proper risk management should always be employed. Past performance does not guarantee future results.
#JTEKT #TechnicalAnalysis #StockMarket #ChannelTrading #SwingTrading #NSE #AutoSector #MovingAverages #TrendAnalysis #IndianStocks

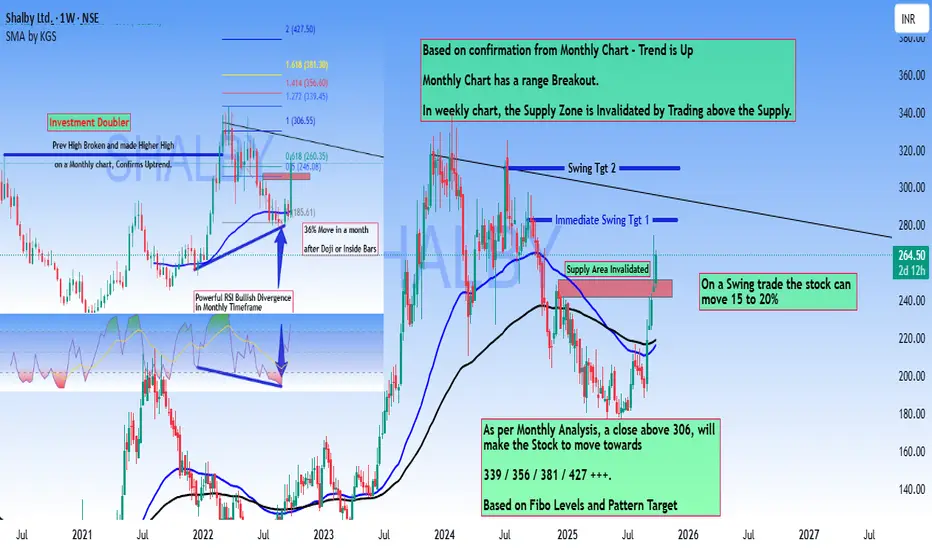
ShalbyLtd - Investment Doubler - High Conviction Trade Setup#Shalby Ltd - #Technical Analysis Report
Current Price: 264.50
Key Technical Signals
Bullish Confirmation from Multiple Timeframes:
- Monthly chart shows a confirmed range breakout with uptrend validation
- Previous high broken on monthly chart, establishing higher highs
- Powerful RSI Bullish Divergence observed in monthly timeframe
Weekly Chart Analysis:
- Supply zone has been invalidated by price trading above 246-250 Levels
- Stock is now in an active swing trade setup
- Expected Immediate 10 to 15% Move Swing Setup.
Investment Status:
The stock presents a compelling "Investment Double" opportunity, with the previous high broken and a higher high confirmed on the monthly chart. The pattern suggests significant upside potential after a period of consolidation.
Price Targets
Short-term Swing Trade: Potential move of 15-20% from current levels
Medium to Long-term Targets:
- ₹306 (Critical breakout level)
- ₹339
- ₹356
- ₹381
- ₹427++++
A decisive close above ₹306 will trigger momentum toward higher Fibonacci-based targets.
Risk Consideration
Expect a consolidation period of approximately one month following Doji or inside bar formations before the next major move materializes.
Conclusion
Shalby Ltd presents a strong technical setup with multiple timeframe confirmation. The invalidation of the supply zone and monthly breakout suggest the stock is positioned for a sustained upward movement. Traders should monitor the ₹306 level closely for breakout confirmation.
Disclaimer: Charts shared only for Educational purpose only. Its not a trade recommendation. Do your own analysis to survive in Trading for a longer run.
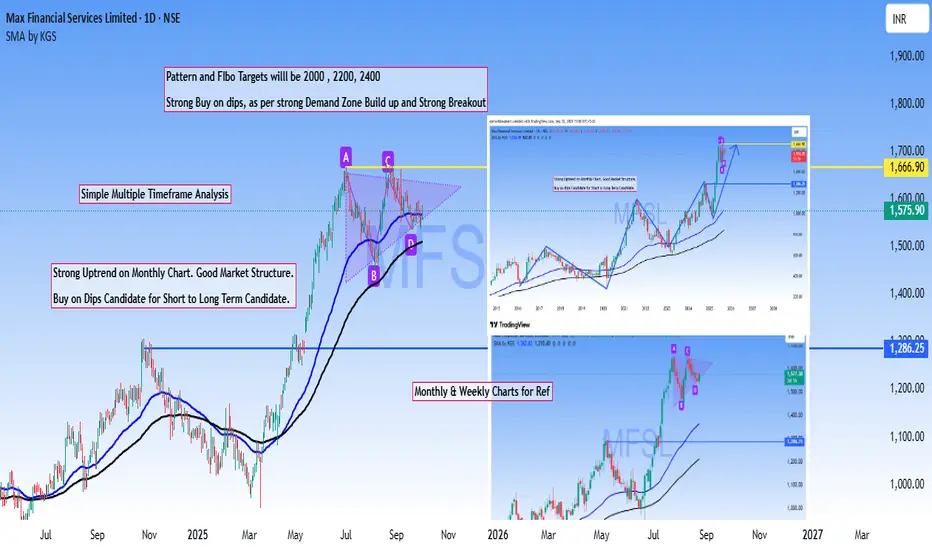
MFSL Multi time frame AnalysisMulti-timeframe confluence analysis offers traders a robust edge through straightforward yet highly effective methodology.
Based on that MFSL is a strong Buy on dips stock based on powerful breakout of previous ATH and the current market structure.
Targets are derived from #Pattern #breakout and #Fibonacci levels.
Bullish Pennant in formation.
Disclaimer: Above analysis shared for educational purpose only.
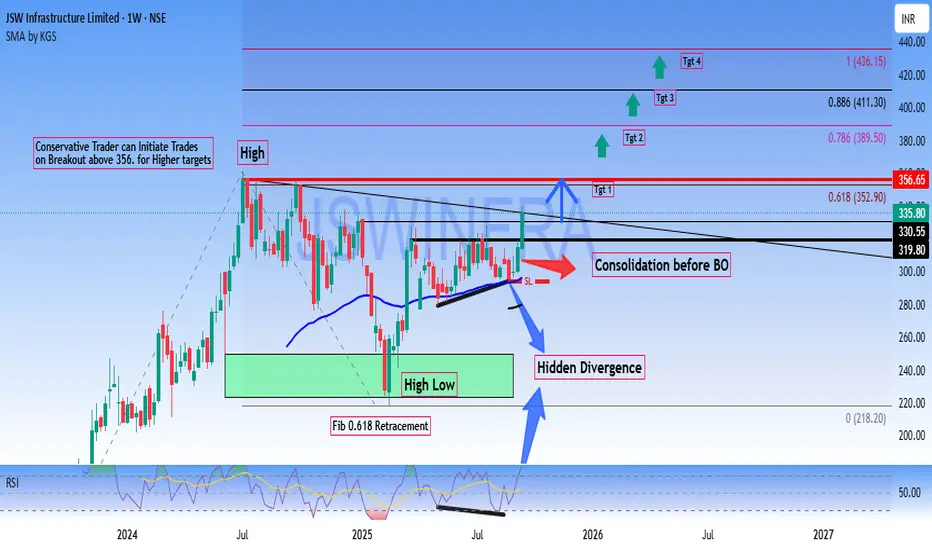
Long JSWINFRA - Short term Investment# JSW Infrastructure Limited (NSE) - Technical Analysis Report
Current Price: 335.80
Key Technical Observations
**Bullish Breakout Setup**
- Breakout Level: Above 356 for conservative trade
Consolidation phase completing before potential breakout (BO) & Stock trading near resistance zone.
Price Targets
- Target 1: 352.90 (0.618 Fibonacci level)
- Target 2: 389.50 (0.786 Fibonacci level)
- Target 3: 411.30 (0.886 Fibonacci level)
- Target 4: 436.15 (1.0 Fibonacci extension)
- Moving Average: SMA showing upward momentum at 296.13
- Fibonacci Retracement : 61.8% level acting as immediate resistance
Chart Pattern Analysis
- Hidden Divergence on the chart suggesting underlying strength
- Consolidation Phase after pullback from 0.618 fib levels and Recent sideways movement indicating accumulation
Risk Management
- Support Level of the recent consolidation low around 280-300 zone
- Stop Loss: Conservative traders should consider stops below 320 on candle close basis.
Conservative Traders:
- Wait for decisive breakout above ₹356 with volume confirmation
- Enter on pullback to ₹340-345 range after breakout
- Target progressive profit booking at mentioned Fibonacci levels
Disclaimer: This analysis is for educational purposes only. Please conduct your own research and risk management before making investment decisions.