Why breakout entries fail (and how I wait for confirmation)Most breakout losses happen because entries are too early.
Instead of chasing the breakout, I wait for:
1) A clearly defined range
2) A clean breakout
3) Pullback / acceptance into the range
4) Continuation confirmation
This simple framework helps avoid fake moves and improves risk–reward.
I later automated this process into a private tool to remove subjectivity,
but the logic itself is what matters most.
This chart shows one example on XAUUSD using a higher timeframe.
Trading Tools

Chapter 8 — MARAL Execution in Live MarketETH / USD (5-Minute Chart) — Context → Permission → Protection
Instrument: ETHUSD (Chart attached)
Execution TF: 5-Minute
Framework: MARAL — Reduced Execution Workflow
Purpose: Educational (Live Market Reading, Not Signals)
8.1 Objective of This Chapter
This chapter demonstrates how MARAL is read in a live market environment, using ETH/USD on a 5-minute chart, without hindsight, indicators abuse, or signal dependency.
MARAL does not predict price.
It governs execution decisions by answering three questions in sequence:
What side is allowed?
Is execution permitted now?
How must risk be protected after entry?
8.2 Context Board — Directional Permission (First Gate)
The Context Board defines directional eligibility, not entries.
Live ETHUSD Context (Observed)
Direction: Bullish
Structure: Bullish Structure
Momentum: Bullish
H1 Bias: Bullish
H4 Bias: Neutral
Daily Context: Bearish (higher-timeframe pressure)
Context Interpretation
Long positions are allowed
Shorts are blocked
Due to HTF conflict, aggressive continuation is discouraged
MARAL Rule:
If context allows only one side, execution must respect that side — even during pullbacks.
8.3 ECI Board — Execution Permission (Second Gate)
The Execution Confidence Index (ECI) is a quality filter, not a trigger.
Live ECI Observations
ECI Score: ~73
Risk Mode: Neutral
MTF Conflict: Present
Volatility Regime: Low Liquidity
ECI Interpretation
Execution permission is granted (ECI ≥ 65)
Environment is fragile, not expansive
Expectation must be reduced
Key Principle:
ECI ≥ 65 allows execution,
but liquidity and MTF alignment decide how much to expect, not whether to trade.
8.4 Entry Logic — What Makes Entry Acceptable
An ETHUSD long is acceptable only when all are true:
Context direction = Bullish
ECI ≥ 65 and stable
Entry aligned with structure (pullback / acceptance)
Liquidity condition acknowledged (Low → strict management)
This setup qualifies as a:
Low-Liquidity Continuation Long (Non-Aggressive)
Not ideal — but not invalid.
8.5 Management Desk — Activates Immediately After Entry
Once entry is taken, execution logic ends.
Risk protection begins immediately.
What Must Be Monitored Live
ECI behavior: must not collapse below 60
Candle closes: acceptance vs rejection
Follow-through: expected within 2–4 candles (5-min)
Context stability: no sudden flip or neutralization
MARAL assumes:
If continuation does not appear quickly in low liquidity, probability is decaying.
8.6 Stop-Loss Logic — Fixed, Structure-Based
Correct SL Placement (5-Minute ETHUSD)
Below the most recent valid Higher Low (HL)
Or below the local structure support
SL Rules
SL defined before entry
SL never widened
Wide ATR SLs are not suitable in low liquidity
MARAL Principle:
In low liquidity, the market must prove you right quickly —
otherwise, the idea is invalid.
8.7 Target Logic — PDH / PDL Usage on 5-Minute
Are PDH / PDL valid on 5-min?
Yes — PDH / PDL are high-quality liquidity objectives.
But they must be treated as reaction zones, not guarantees.
TP Structure
TP1 (Mandatory):
Before PDH
Or nearest internal high
Typically 1R–1.2R
Extended Target (Optional):
PDH only if:
ECI remains ≥ 65
Liquidity improves
Price shows acceptance near highs
In low liquidity, TP before PDH is professional discipline, not fear.
8.8 Re-Entry Rules (Often Violated)
Re-entry is allowed only if:
New liquidity is created
OR structure resets
AND ECI stabilizes again
AND context remains unchanged
Re-entry is not allowed:
Immediately after SL
For emotional recovery
Without new information
8.9 Key Takeaways from Live ETHUSD Execution
Context allowed long, but with caution
ECI permitted execution, not expansion
Liquidity demanded conservative expectations
Management discipline mattered more than entry
PDH acted as a reaction zone, not a breakout promise
MARAL does not chase moves.
It protects decisions.
8.10 Final Rule (This Chapter in One Line)
Context decides → ECI permits → Management protects
If any step fails, execution must stop.
Final Note — Role of the Trader vs MARAL
With MARAL, the trader is not required to continuously interpret or read raw charts.
All critical market states are already translated and structured through MARAL’s boards:
Context Board → defines directional allowance
ECI Board → evaluates execution confidence
Liquidity & Alignment States → qualify risk conditions
Management Desk → governs post-entry protection
The trader’s responsibility is not analysis, but rule adherence.
MARAL does not remove discretion —
it removes noise, impulse, and emotional decision-making.
Execution becomes a process of confirmation and discipline, not prediction or constant chart interpretation.
If MARAL does not permit execution, no chart reading can justify a trade.
With MARAL, the chart speaks through structure — the trader only listens and executes the rules.
Educational Disclaimer
This chapter is for educational and analytical purposes only.
MARAL is a discretionary execution framework, not a signal service, automation tool, or financial advice system.
#TradingView #ETHUSD #CryptoTrading #TradingExecution #RiskManagement
#MarketStructure #Liquidity #ExecutionDiscipline #DiscretionaryTrading
#RuleBasedTrading #CapitalProtection #MARAL

How Funds Actually Make Money From Bitcoin📰 I’ve followed financial markets long enough to notice a strange paradox:
spend more than five minutes scrolling Crypto TikTok (YouTube or X isn’t much different), and you’d think the entire crypto market is run by a few whale clicks and a handful of flashy headlines.
You’re constantly told that:
📉 Someone is “buying the dip”
📈 Someone else is “selling the top”
🐋 And a major institution is “deciding the fate of the market”
It sounds reasonable.
But in reality… it’s far more complex than that.
📣 I’ve watched hundreds of videos like these. The script is always the same.
Glossy thumbnails, rushed voices, and absolute statements:
“BlackRock is buying — PRICE IS GOING UP!”
“Whales are selling — THE MARKET IS ABOUT TO CRASH!”
“Institutional money is here!!!”
🎭 But beneath the drama, what’s really there?
No nuance. No structure. And almost no understanding of how institutions actually make money.
🔍 Here’s the truth I’ve learned after years of observing the markets:
Whether BlackRock buys or sells Bitcoin has very little to do with you.
Large funds don’t trade on emotion, nor do they survive by predicting direction like retail traders do.
They don’t need Bitcoin to go up.
They don’t need Bitcoin to go down.
🎯 What they need is volatility — calculated, measured, and modeled.
🧠 This is the part most TikTok content completely ignores.
A fund can buy Bitcoin and at the same time:
🛡️ Hedge 100% of its risk
⚖️ Stay delta-neutral
📊 Maintain a neutral market view
🔒 Be protected against both upside and downside moves
👉 For them, buying BTC is not a gamble.
It’s simply the first layer of a multi-leg trading structure.
What matters isn’t how much they buy,
but what comes next — the steps most retail traders have never even heard of.
📉📈 I often ask myself:
Why do so many “TikTok analysts” talk about institutions every day, yet never mention delta, gamma, hedging, or basis?
The answer is simple:
👉 Because they don’t understand it.
If someone:
screams “bullish” and “bearish” in every video
believes institutions are “pumping prices”
but can’t explain delta-neutral hedging
then their opinion on what BlackRock is “doing” has no analytical value.
📊 To really understand this, let’s look at how a fund actually makes money.
Assume Bitcoin is trading at $100,000.
The fund doesn’t care whether price goes up or down.
They deploy a neutral options structure, betting on volatility , not direction.
When price rises:
they sell part of the position to rebalance risk
profit comes from selling at higher levels
When price falls:
they buy back at lower prices
profit comes from buying cheaper
🔁 Price up → sell high
🔁 Price down → buy low
👉 Repeat. With discipline. Without emotion.
This is gamma scalping — the quiet, persistent profit engine behind institutional trading.
💰 So where does their real profit come from?
Not from news.
Not from influencers.
Not from ETF headlines.
It comes from:
continuous hedge adjustments
realized volatility exceeding expectations
direction-neutral structures
strict mathematical discipline
⛔ The rare moment they struggle?
When the market… doesn’t move at all.
🧭 And here’s what I want to say to you directly, as a market professional:
You are not BlackRock.
You don’t have their infrastructure.
You don’t have their capital, speed, or risk models.
👉 Trying to predict or mimic their actions won’t make you a better trader — it will only make you more confused.
✍️ My conclusion is very clear:
Watching what large funds do without understanding the structure behind it
is the fastest path to losses.
BlackRock doesn’t trade narratives.
They don’t trade emotions.
And they certainly don’t trade TikTok stories.
🎯 They trade structure.
And you?
Stop watching what they do.
Start understanding what you should do.
That’s the difference between surviva l and being washed out by the market.
PS: BlackRock and TikTok are used purely as illustrative examples.

HOW TO WATCHLIST TABLE-VIEW TOOL IN TRADINGVIEWComplete Process: HOW TO WATCHLIST TABLE-VIEW TOOL IN TRADINGVIEW
1️⃣ Open the Watchlist Panel
➺ The Watchlist panel is located on the right side of the Trading-View interface.
➺ If it is hidden, click the small arrow on the right edge to open it.
2️⃣ Locate the Table-View Tool
➺ At the top of the watchlist panel, you will see three dot icon.
➺ This icon opens the table-view tool inside the watchlist.
3️⃣ Open the Table-View
Step-by-step:
➺ Click the table icon at the bottom of the watchlist.
➺ The watchlist will switch from the normal list-view to the table-view layout.
4️⃣ Understanding the Table-View Layout
The table-view displays additional columns and organized data in a tabular format.
Typical columns include:
⤷ Symbol
⤷ Last Price
⤷ Change (%)
⤷ Volume
⤷ High / Low
⤷ Session Data
⤷ Custom fields (depending on settings)
The table-view allows users to compare multiple symbols more clearly.
5️⃣ How to Add Columns in Table-View
Step-by-step:
➺ Hover on the column header area.
➺ Click the plus (+) icon or “Add Column” option.
➺ Choose the data you want to add:
⤷ Price
⤷ Change
⤷ Bid / Ask
⤷ Volume
⤷ Open Interest
⤷ Fundamentals (if supported)
⤷ Other available fields
The selected column will appear immediately.
6️⃣ How to Remove Columns
Step-by-step:
➺ Hover over the column header you want to remove.
➺ Click the three-dot menu (⋮) on that column.
➺ Select “Remove Column”.
➺ The column will be removed from the table.
7️⃣ How to Reorder Columns
Step-by-step:
➺ Click and hold the column header.
➺ Drag it left or right.
➺ Release to place it in the new position.
This helps personalize the table layout.
8️⃣ Sorting Symbols in Table-View
Step-by-step:
➺ Click any column name (for example: Price, Change %, Volume).
➺ Clicking once sorts the column ascending.
➺ Clicking again sorts descending.
➺ A small arrow appears showing the sort direction.
9️⃣ Switch Back to Normal Watchlist View
Step-by-step:
➺ Click the same table icon at the bottom again.
➺ The watchlist returns to the default list-view.
🎯 Short Summary (Optional for Captions)
⤷ Open Table-View → Bottom table icon
⤷ Add Columns → Add Column option
⤷ Remove Columns → Three-dot menu → Remove
⤷ Reorder → Drag column headers
⤷ Sort → Click column name
⤷ Return to List → Click table icon again

HOW TO WATCHLIST MAKE A COPY & CLEAR LIST✅ Complete Process: HOW TO WATCHLIST MAKE A COPY & CLEAR LIST (Trading-View)
1️⃣ Open the Watchlist Panel
➣ The Watchlist panel is located on the right side of the Trading-View interface.
➣ If it is hidden, click the small arrow on the edge to open it.
2️⃣ Open Watchlist Options Menu
➣ At the top of the watchlist, click the three-dot menu (⋮).
➣ This menu contains all the main watchlist management options.
3️⃣ How to Make a Copy of a Watchlist
Step-by-step:
➣ In the three-dot menu, select “Make a Copy”.
➣ A duplicate copy of the current watchlist will be created.
➣ The copied watchlist will appear in the watchlist dropdown list.
➣ You can rename the copied watchlist by:
⤷ Opening the dropdown → clicking Rename → typing the new name → pressing Enter.
This is useful when you want to create variations of the same watchlist.
4️⃣ How to Clear a Watchlist
Step-by-step:
➣ Open the three-dot menu (⋮) at the top of the watchlist.
➣ Select “Clear List”.
➣ Trading-View may ask for confirmation.
➣ Once confirmed, all symbols inside the watchlist will be removed, but the watchlist itself
remains.
This is helpful when you want to reset or start the watchlist fresh.
5️⃣ Switch Between Watchlists
(Useful after creating a copy)
➣ Click the watchlist name at the top.
➣ A dropdown will appear with all available watchlists.
➣ Select the watchlist you want to view or edit.
🎯 Short Summary (Optional for captions)
➣ Make a Copy → Menu → Make a Copy → Rename if needed
➣ Clear List → Menu → Clear List → Confirm
➣ Switch Watchlists → Dropdown → Select List

HOW TO WATCHLIST ADD & DELETE SYMBOL OR SECTION IN TRADINGVIEW1️⃣ Open the Watchlist Panel
-->The Watchlist panel appears on the right side of the Trading-View interface.
-->If it is hidden, click the small arrow on the right edge to open it.
2️⃣ Add a Symbol to the Watchlist
Step-by-step:
1. Go to the Search Bar at the top of the watchlist.
2. Type the name or ticker of the symbol you want to add.
3. Click on the symbol from the search results.
4. The symbol will be added to your watchlist immediately.
3️⃣ Delete a Symbol from the Watchlist
Step-by-step:
1. Hover your cursor over the symbol you want to remove.
2. Click the ‘X’ icon or Delete icon that appears.
3. The symbol will be removed from the watchlist.
4️⃣ Add a New Section in the Watchlist
Step-by-step:
1. Right-click anywhere inside the watchlist panel.
2. Select “Add Section” from the menu.
3. A new blank section will be created.
4. To rename it:
-->Double-click on the section name → type the new name → press Enter.
5️⃣ Delete a Section from the Watchlist
Step-by-step:
1. Right-click on the section name you want to delete.
2. Select “Delete Section”.
3. Trading-View may ask for confirmation.
4. The entire section and all symbols inside it will be deleted.
6️⃣ Move Symbols Between Sections
(Useful for keeping the watchlist organized)
1. Click and hold the symbol you want to move.
2. Drag it to another section.
3. Release to drop it into the new section.
🎯 Short Summary (Optional for Captions)
--> Add Symbol → Search → Click
--> Delete Symbol → Hover → Click ‘X’
--> Add Section → Right-click → Add Section
--> Delete Section → Right-click → Delete Section
--> Move Symbols → Drag & Drop

HOW TO WATCHLIST IN TRADINGVIEW CREATE RENAME & DELETEThis video explains how to watchlist in Trading-View and demonstrates how to create, rename and delete a watchlist. The focus is on showing where these options are located in Trading-View and how each function works within the interface. The walkthrough is clear and simple, helping users understand the steps to create, rename and delete their watchlist effectively.

How to Understand Trading-view InterfaceWe provide Trading-view interface in a short way in this video introduction on Trading-view interface.
This video provides a clear and structured walkthrough of the Trading-View interface. It covers chart layout, drawing tools, timeframes, market watchlist in a simple and organized manner to help users understand the platform more effectively.

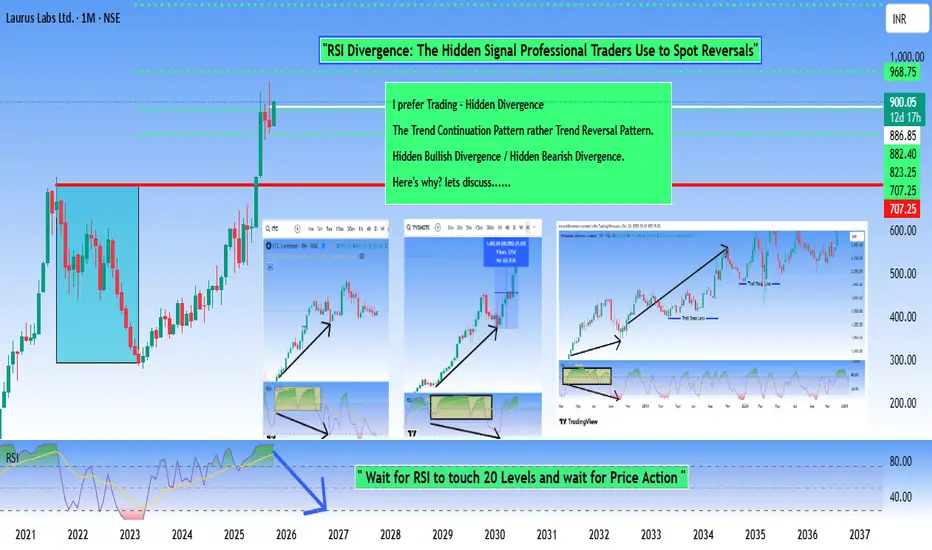
Hidden Signal Professional Traders Use to Spot ReversalsRSI divergence is a technical analysis tool used to identify potential reversals or weakening momentum in price trends.
Here's how it works:
RSI (Relative Strength Index) Divergence occurs when the price of an asset moves in one direction while the RSI indicator moves in the opposite direction.
This disconnect between Price action and Momentum is what traders find significant.
Bullish / Bearish Divergence - This Divergence occurs at the end of a trend, be it Bullish or Bearish Trend.
RSI Hidden Divergence is a more subtle and advanced form of divergence that occurs within trending markets. It's different from regular divergence because it suggests the trend will continue rather than reverse.
Why It's Called "Hidden" ?
Regular divergence is more "obvious" because Price and RSI move in completely opposite directions . Hidden divergence is subtler— It appears within the flow of an existing trend and is easy to miss, hence the name.
Reasons to Prefer Hidden Divergence Rather then Classic Divergence !!!
When we follow Classic Divergence, the possible results are....
False Signals
The biggest issue is that divergences frequently fail to produce reversals. A price may form a lower low while RSI forms a higher low, suggesting a reversal is coming, but the price continues in the original direction anyway. This can lead traders into losing trades if they act on divergence signals prematurely.
Lagging Nature
RSI divergence is a lagging indicator—by the time you spot it clearly, a significant portion of the move may already be complete. You're often trading what's already happened rather than predicting what's about to happen. The reversal might be weeks away, making it difficult for short-term traders.
Subjectivity in Identification
Identifying divergence requires drawing trend lines and choosing which highs and lows to compare. Different traders might draw these lines differently, leading to inconsistent identification of the same divergence. This subjectivity makes it harder to create reliable, mechanical trading rules.
Cryptocurrency : The New Normal & The World of Leverage Trading.📌 Cryptocurrency: The New Normal & The World of Leverage Trading ⚔️ ( A Sweet Killer! )
🌍 Why Are Traders Shifting to Crypto? COINBASE:BTCUSD BITSTAMP:ETHUSD COINBASE:SOLUSD
✔️ Lower capital required compared to stocks
✔️ Fewer gaps (24/7 market = no overnight gap-up/down shockers)
✔️ High leverage opportunities (control bigger trades with smaller margin)
✔️ Global accessibility (Binance, Bybit, OKX, CoinDCX, Mudrex etc.)
📊 Types of Trading in Crypto
💠 **Spot Trading** → In India, 30% tax on capital gains ( check according to your country ).
💠 **Options & Futures** → Taxed as *Business Income* ( like F&O in stocks ). No flat 30% rule.
⚡ What is Leverage?
👉 Leverage means using *small capital* to control a *large trade size* , because the exchange lends you money.
Think of it like **margin trading** in stocks — but much more aggressive.
🔹 Example 1 : Normal Trade style ( No Leverage )
suppose you have 💰 Capital = ₹10,000
Bought BTC at Price = ₹10,000,000
* You can buy 0.001 BTC ( 10000 ➗ 10,000,000 ).
* If BTC rises 10% → Profit = ₹1,000 (+10%)
* If BTC falls 10% → Loss = ₹1,000 (-10%)
👉 Risk & reward move in proportion to your capital.
🔹 Example 2 : Leverage Trade style ( 10x Leverage )
suppose you have 💰 Capital = ₹10,000
opted Leverage = 10x
New Trade Size ( margin ) = ₹1,00,000 ( you can now utilize this margin amount for trading )
* You can buy 0.01 BTC ( 10000 ➗ 10,000,000 ).
* If BTC rises 10% → Profit = ₹10,000 (+100% return)
* If BTC falls 10% → Loss = FULL ₹10,000 ( Liquidation 🚨 )
👉 A 10% move = your account will be blown.
🔹 Example 3:
suppose you have 💰 Capital = ₹10,000
opted Leverage = 50x (Extreme ⚠️)
New Trade Size ( margin ) = ₹5,00,000 ( you can now utilize this margin amount for trading )
* You can buy 0.05 BTC ( 50000 ➗ 10,000,000 ).
* If BTC rises just 2% → Profit = ₹10,000 (+100% return)
* If BTC falls just 2% → FULL ₹10,000 loss ( Liquidation 🚨 )
* If BTC rises just 10% → Profit = ₹50,000 (+500% return)
* If BTC falls just 10% → FULL ₹10,000 loss ( Liquidation 🚨 )
👉 Tiny moves in high volatile asset class = jackpot or wipeout/blown.
⚔️ Key Takeaways :
1️⃣ Leverage multiplies profits 💸 but also multiplies losses too💀 ( a sweet killer! )
2️⃣ Crypto is *highly volatile* (10–20% daily moves are common) → High leverage is extremely risky, if not managed well.
3️⃣ Beginners should **never use more than 2x–3x leverage**
👉 In simple words: **Leverage is a double-edged sword ⚔️**
Used wisely → You’re a king 👑
Used recklessly → You’re broke 🥀
🚘 Liquidation Explained ( ex: Car Analogy )
Imagine you pay ₹10,000 to rent a car worth ₹1,00,000. (That’s 10x leverage).
* The car is in your hands, but ₹90,000 still belongs to the owner of car (exchange).
* If the damage goes beyond your ₹10,000 margin → the owner takes back the car immediately.
👉 That’s liquidation: when your loss = your margin.
🔹 Case 1: Normal Trade style ( No Leverage )
Margin = ₹10,000 → Buy BTC.
If BTC drops 10% → Loss = ₹1,000.
You still have ₹9,000 left.
✅ No liquidation. Just a normal loss.
🔹 Case 2: 10x Leverage Trade style
Margin = ₹10,000
New Trade Size ( margin ) = ₹1,00,000
* BTC rises 10% → Profit = ₹10,000 (+100%)
* BTC falls 10% → Margin wiped = Liquidation 🚨
🔹 Case 3: 20x Leverage Trade style
Margin = ₹10,000
New Trade Size = ₹2,00,000 ( margin )
* BTC rises 5% → Profit = ₹10,000 (+100% return)
* BTC falls 5% → Margin wiped = Liquidation 🚨
👉 Just 5% against you = Account gone.
🔹 Case 4: 50x Leverage Trade style (High-Risk Zone ⚠️)
Margin = ₹10,000
New Trade Size = ₹5,00,000 ( margin )
* BTC rises 2% → Profit = ₹10,000 (+100% return)
* BTC falls 2% → FULL ₹10,000 loss = Liquidation 🚨
👉 Just 2% against you = Blown account = Game over.
🎯 Final Word
Leverage = Power ⚡
But in crypto’s volatile world, it’s also a **trap for the impatient**.
* Smart traders use small leverage.
* Impulsive traders burn out with high leverage.
💬 Question for you: What’s the **highest leverage** you’ve ever used in a trade? Drop it below 👇 (Be honest—we’ve all been tempted!)
If this Idea gave you a value information then please, Boost it, share your thoughts in comments, and follow for more practical trading!
Happy Trading & Investing!
@TradeWithKeshhav and team
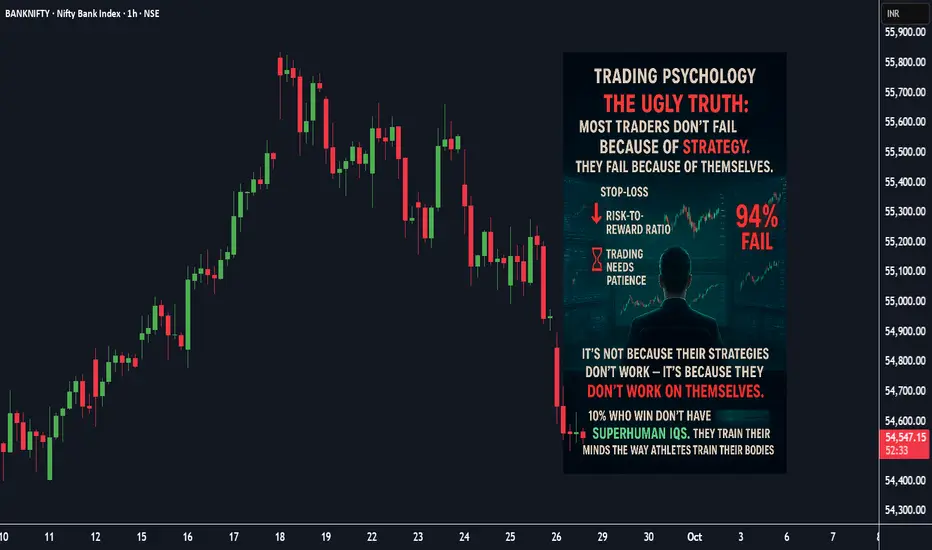
Psychology, Why 90% of Traders Fail (And How to Be the 10%)⚡ The ugly truth: Most traders don’t fail because of strategy. They fail because of *themselves* . It’s NOT bad strategies, it’s bad psychology.
📉 Here’s the real story 👇:
We know about stop-losses.
We know about risk-to-reward.
We know patience matters.
Imagine this: You’ve planned your trade. Price goes against you. Suddenly, your brain whispers:
👉 “Just hold a little longer.”
👉 “Double your position, you’ll recover.”
👉 “Skip the stop-loss this time, it’ll bounce back, praying it turns back.”
NSE:COFORGE
Sound familiar?
That inner voice has blown more accounts than any chart pattern ever did.
🧠 “It’s not because their strategies don’t work—it’s because *they don’t work on themselves*.
✅ The 10% who wins don’t have superhuman IQs . They *train their minds* the way athletes train their bodies.
Here’s how you can upgrade yourself today :
1️⃣ **Detach From Money** → Don’t measure success by today’s P&L.
Measure it by *following your plan*. Consistency is the real wealth.
2️⃣ **Write Your Rulebook 📘** → Define your entries, exits, and risk rules. Print it. Stick it near your screen.
No match = no trade. (Yes, it’s boring. That’s why it works.)
3️⃣ **Journal Your Trades** → Every. Single. Trade. Wins and losses. How did you feel?
Why do you enter?
after doing this, you’ll start to * see your patterns * —and they’ll expose your weaknesses too..
🎯 Success in trading isn’t about predicting/beating the market. It’s about controlling *yourself*, beating your own impulses.
💬 Question for you: Which habit is killing your trades?
NSE:MARUTI
If you could fix just ONE habit right now:— what would it be?
Which one would change your results the most?
1️⃣ Overtrading 🔂
2️⃣ Revenge Trading ⚔
3️⃣ Ignoring Risk ⚠
4️⃣ chasing losses 🏃➡️
5️⃣ No 📘rulebook/📰Journal
💬 Comment below ⬇️
I'll post my new content accordingly.
Happy Trading and Investing!
Regards:
@TradeWithKeshhav
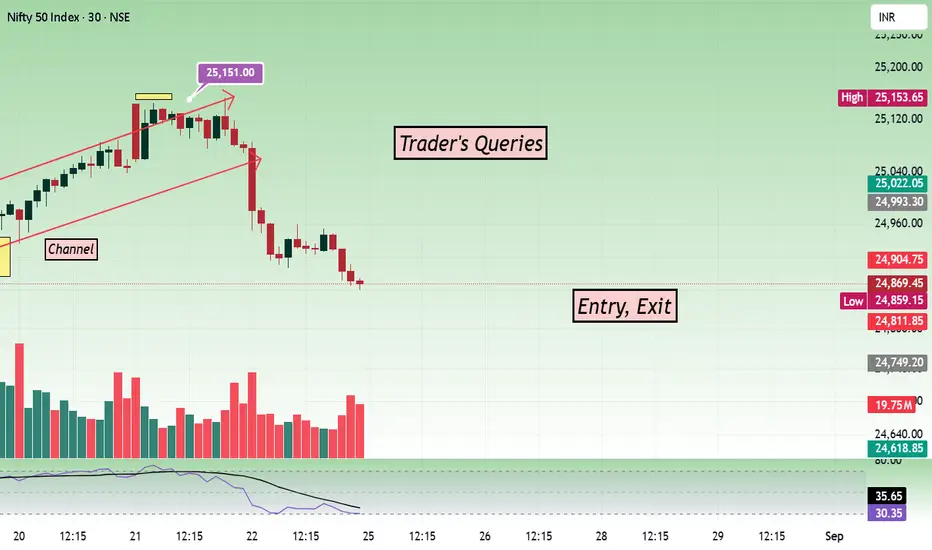
Trader's Queries - How to take right entry, exit in trading?Trader's Queries are back with more insights as I have gained more experience in trading.
Query: Frequently, I find myself entering and exiting trades late; how can I address this issue?
Answer: Often, traders who lack confidence in the trend make late entries and exits. This practice diminishes profits and heightens risk. Is there a method to enhance profits while minimizing risk?
Indexes frequently open with gaps up or down. If you are aware of key support and resistance levels before the market opens, executing trades will be easier. However, if you wait until after the market opens to assess support and resistance before deciding on your actions, your entries will likely be delayed.
Stocks typically do not experience significant gap-up or down days, so the opening should not catch you off guard.
You can utilize these strategies to identify optimal entry and exit points.
Price action – Always the number one.
Volume
VWAP
RSI or MACD
Nifty spot chart has volume in TradingView. I use it to understand the trend. Price action gives you more information when you understand where it is forming.
OHLC Monthly Magic🎯 Simple but Powerful Trading Concept – No Indicators, No Patterns Needed!
Dear viewers,
Today, I'm sharing something so simple that most traders completely overlook it. While everyone else is busy complicating trading with fancy indicators, patterns, and strategies — I want to take you back to the basics that actually work.
✅ I’m using a Nifty chart to explain this. I’ve highlighted the previous month’s candle, and using the drawing tool’s magnet mode, I’ve plotted simple horizontal lines at the:
• Open
• High
• Low
• Close
📊 That’s it! No indicators. No patterns. Just price action from the previous month.
Now, switch to the Weekly or Daily timeframe and observe what happens around those levels. You’ll see clear supply and demand zones forming — automatically. These are the real institutional levels where price reacts strongly.
🔒 Who Should Use This?
If you're a retail trader, I do not recommend getting into intraday or index options — they are high-risk and emotionally draining, especially for beginners.
However, if you're an experienced trader and can handle the volatility, here’s how you can use this method powerfully:
📅 After marking the previous month’s OHLC levels:
• Move to the current month
• Watch how price interacts with those levels
• Combine this with RSI for extra confirmation:
📈 RSI + OHLC = High-Probability Zones
• If RSI > 60 and price is nearing the previous high — there's an 80-90% chance of a breakout.
• If RSI < 40 and price is near the previous low — expect further downside.
• We ignore the 40–60 RSI range. It’s noise. We're only focused on strong bullish or bearish momentum.
✅ Try this on stocks, crypto, forex (EUR/USD) — anything.
Once you master this concept, you won’t need any fancy indicators or complicated supply-demand theories. Just price action and momentum will guide your trades.
Thanks for watching, and apply this to see the magic yourself. Check my previous post for deeper understanding of -
Positional Trading Setup
Swing Trading Setup
Stock Options Swing Setup
And - Investment Positional Trading Setup (coming soon)
Focus on which is simple. God Blesses you All!
Faraaz T
Sr. Exec. Research Analyst - Equity
Stockholm Securities - UK

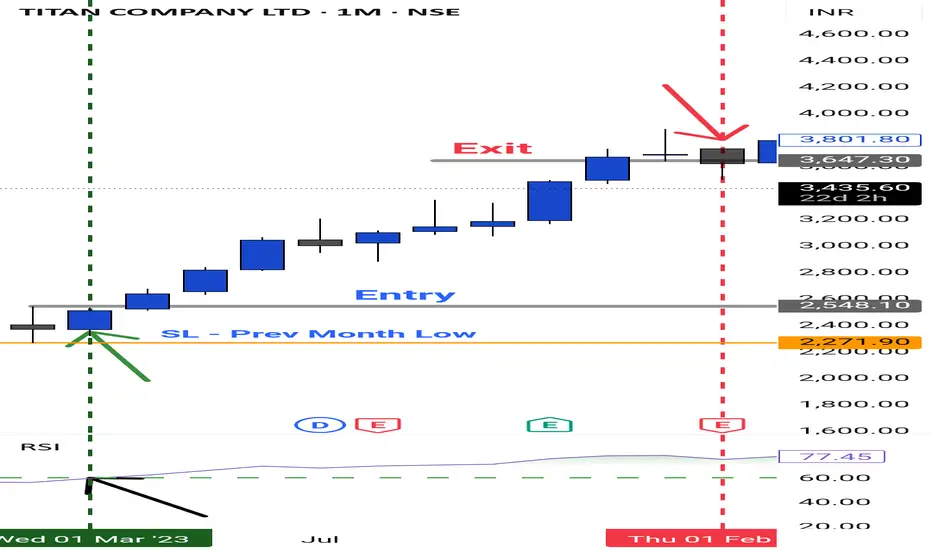
Swing & Positional Trading Simple High Momentum Strategy📌 Simple Positional Trading Strategy for Beginners & Intermediate Traders:-
Over the years, I’ve explored and tested a variety of advanced trading strategies. However, I’ve come to realize that for beginners and traders with 2–3 years of experience, complex strategies can often lead to confusion and unnecessary risk. To address this, I’m sharing a straightforward and effective positional strategy that operates solely on the monthly time frame—eliminating the noise of intraday volatility and focusing purely on major institutional trends.
🔹 Strategy Name:
Positional RSI Breakout – Cash or Options (Excludes Futures)
This method is tailored specifically for cash market positions or options trades (for those familiar with managing them). Futures are intentionally excluded to reduce leverage-related risks and complexity for new and learning traders.
✅ Strategy Rules
• Time Frame: Monthly Candlestick
• Indicator Used: RSI (Relative Strength Index)
📥 Entry Conditions:
• Monitor for RSI crossing above the 60 level on the monthly chart – this indicates strong bullish momentum.
• Once RSI is > 60, mark the high of the previous month’s candle.
• Place a buy order just above the previous month’s high.
🔒 Stop Loss:
• Set the first stop loss just below the previous month’s low when entering.
Trail your stop loss to the low of each month after closing of that monthly candle.
📤 Exit Conditions:
• Exit the trade only if a full monthly candle closes below the previous month’s low.
• Ignore daily price fluctuations—this strategy is built for positional swing trading, not short-term moves.
💡 Note for Options Traders:
If trading via options, ensure you exit your position before monthly expiry to avoid time decay and liquidity issues. If you're unfamiliar with options mechanics, it is advisable to stick with cash market trades.
📋 Stock Universe:
A curated list of 100 high-beta, highly liquid stocks is provided below for your assistance. These stocks:
• Offer consistent volume and volatility
• Are widely tracked by institutions
• Provide clean price action suited for both cash and options trades
🤝 Support & Queries:
If you have questions regarding execution, stock selection, position sizing, or risk management, feel free to reach out.
🔁 Final Thoughts:
Trading success doesn’t come from complexity—it comes from consistency, clarity, and discipline. Follow the process, manage your risks wisely, and let the strategy do its work.
Wishing you profitable trades and steady growth!
Please share this content with as many traders as possible and become a successful trader like PRO.
High Beta and Liquid Stocks List:-
🚗 Auto:
Bajaj-Auto, Balkrisind, Bharatforg, Boschltd, Eichermot, Exideind, Heromotoco, Mrf, M&M, Maruti, Motherson, Tvsmotor, Tatamotors, Tiindia
🏦 Banking & Financial Services:
Axis Bank Ltd., Bank Of Baroda, Canara Bank, Federal Bank Ltd., Hdfc Bank Ltd., Icici Bank Ltd., Idfc First Bank Ltd., Indusind Bank Ltd., Kotak Mahindra Bank Ltd., State Bank Of India, Bajaj Finance Ltd., Bajaj Finserv Ltd., Cholamandalam Investment And Finance Company Ltd.
⚗️ Chemicals:
Aarti Industries Ltd., Atul Ltd., Bayer Cropscience Ltd., Chambal Fertilizers & Chemicals Ltd., Coromandel International Ltd., Deepak Nitrite Ltd., Gujarat Fluorochemicals Ltd., Gujarat Narmada Valley Fertilizers And Chemicals Ltd., Himadri Speciality Chemical Ltd., Linde India Ltd., Navin Fluorine International Ltd., Pcbl Chemical Ltd., Pi Industries Ltd., Pidilite Industries Ltd., Srf Ltd., Solar Industries India Ltd., Sumitomo Chemical India Ltd., Tata Chemicals Ltd., Upl Ltd.
🛍️ FMCG:
Britannia Industries Ltd., Colgate Palmolive (India) Ltd., Dabur India Ltd., Emami Ltd., Godrej Consumer Products Ltd., Hindustan Unilever Ltd., Itc Ltd., Marico Ltd., Nestle India Ltd., Patanjali Foods Ltd., Radico Khaitan Ltd., Tata Consumer Products Ltd., United Breweries Ltd., United Spirits Ltd., Varun Beverages Ltd., Dmart
💊 Pharma & Healthcare:
Abbott India Ltd., Alkem Laboratories Ltd., Apollo Hospitals Enterprise Ltd., Aurobindo Pharma Ltd., Biocon Ltd., Cipla Ltd., Divi's Laboratories Ltd., Dr. Reddy's Laboratories Ltd., Fortis Healthcare Ltd., Glenmark Pharmaceuticals Ltd., Granules India Ltd., Ipca Laboratories Ltd., Laurus Labs Ltd., Lupin Ltd., Mankind Pharma Ltd., Max Healthcare Institute Ltd., Sun Pharmaceutical Industries Ltd., Syngene International Ltd., Torrent Pharmaceuticals Ltd., Zydus Lifesciences Ltd.
💻 IT & Tech:
Coforge Ltd., Hcl Technologies Ltd., Infosys Ltd., Ltimindtree Ltd., Mphasis Ltd., Oracle Financial Services Software Ltd., Persistent Systems Ltd., Tata Consultancy Services Ltd., Tech Mahindra Ltd., Wipro Ltd.
⚒️ Metals:
Apl Apollo Tubes Ltd., Adani Enterprises Ltd., Hindalco Industries Ltd., Hindustan Copper Ltd., Hindustan Zinc Ltd., Jsw Steel Ltd., Jindal Stainless Ltd., Jindal Steel & Power Ltd., Lloyds Metals And Energy Ltd., Nmdc Ltd., National Aluminium Co. Ltd., Steel Authority Of India Ltd., Tata Steel Ltd., Vedanta Ltd., Welspun Corp Ltd.
🏙️ Realty:
Anant Raj Ltd., Brigade Enterprises Ltd., Dlf Ltd., Godrej Properties Ltd., Macrotech Developers Ltd., Oberoi Realty Ltd., Phoenix Mills Ltd., Prestige Estates Projects Ltd., Raymond Ltd., Raymond Realty Ltd., Sobha Ltd.
🧱 Durables & Cement and Oil Gas:
Amber Enterprises India Ltd., Bata India Ltd., Blue Star Ltd., Century Plyboards (India) Ltd., Cera Sanitaryware Ltd., Crompton Greaves Consumer Electricals Ltd., Dixon Technologies (India) Ltd., Havells India Ltd., Kajaria Ceramics Ltd., Kalyan Jewellers India Ltd., Pg Electroplast Ltd., Titan Company Ltd., V-Guard Industries Ltd., Voltas Ltd., Whirlpool Of India Ltd., Acc, Ambuja Cements, Ultratech Cement, Shree Cements, Jk Cement, Reliance.
Swing & Positional Trade Setup Sector-wise Analys – Cash/Options✅ Swing and Positional Trade Setup
Sector-wise Analysis – Cash / Futures & Options Segment:-
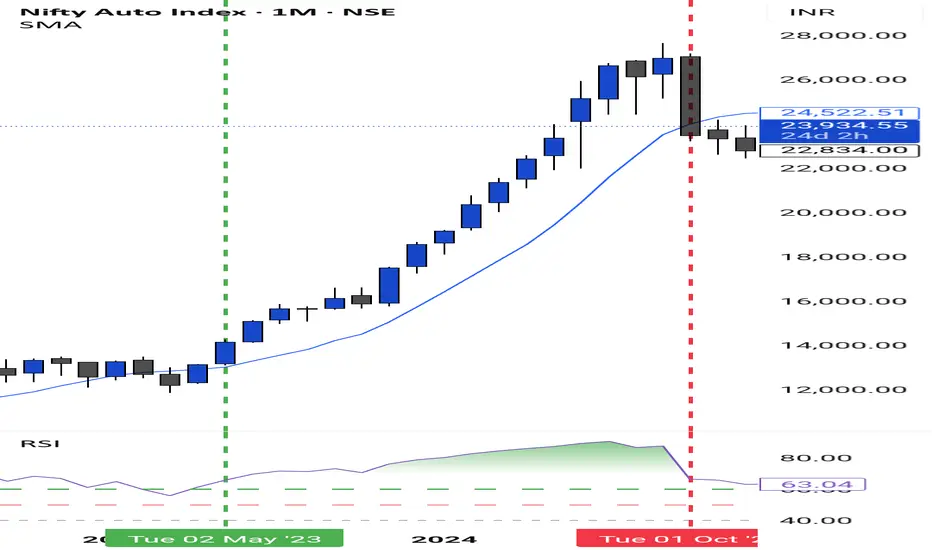
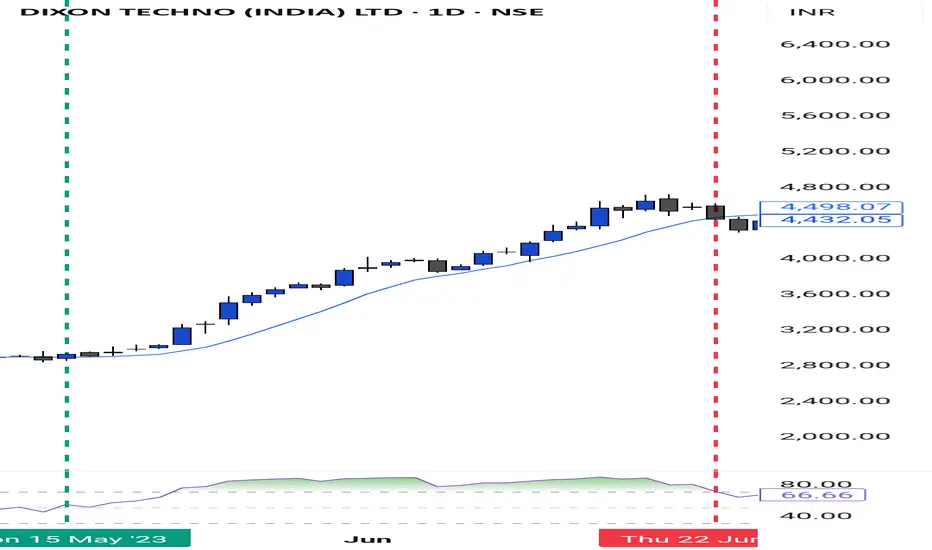
Over the past 18+ years, I have developed a trading setup that revolves around sectoral analysis. My trades are taken in cash, futures, and options, based on which sector and which stock is showing strength.
Below, I’ve shared the complete sector-wise stock list. This will help you skip the most time-consuming part—stock selection—so you can focus purely on execution and discipline.
🔍 Stock Selection Criteria of mine:-
• Market Capitalization
• Liquidity and High Beta
• Volumes
📊 1. Positional/Swing Trade Setups - Momentum Trading:-
This setup begins by identifying:
• Which sector is currently showing strength (e.g., Nifty Auto).
• Which stocks in that sector are outperforming the benchmark.
⚠️ Note for Beginners:
If your capital is below ₹20 lakhs, avoid trading in futures. Stick to cash market or stock options only.
🕒 Timeframes for Analysis:
• Monthly
• Weekly
• Daily
🛠️ Technical Tools Used:
• 9 SMA (Simple Moving Average)
• Volumes
• RSI (Relative Strength Index)
• Market Structure
(HH–HL for bullish, LH–LL for bearish)
📈 Entry Criteria (Bullish / Long Trades):
For Options (Call), Cash or Futures Buy:
• Price must be above 9 SMA on Monthly, Weekly, and Daily charts.
• Monthly and Weekly RSI > 50
• Daily RSI > 60 → This confirms a 7-Star Setup (Big Momentum Trade)
✅ Execution Plan:
• Entry: Above the high of the previous daily candle.
• Stop Loss: Below Daily 9 SMA or the recent swing low.
• Trailing Strategy:
• After 3 daily candles, trail stop loss to cost.
• Continue trailing below each new daily candle's low.
Exit Criteria:
• Daily close below 9 SMA
• OR RSI drops below 60
• OR both conditions occur
📉 Entry Criteria (Bearish / Short Trades – Put Option or Short in Futures):
• Daily and Weekly RSI < 50
• Price must be below 9 SMA on Daily and Weekly charts.
• Entry, stop-loss, and exit follow the same process in reverse.
📂 Sector-wise Stock List to Focus On:
🚗 Auto:
ASHOKLEY | BAJAJ-AUTO | BALKRISIND | BHARATFORG | BOSCHLTD | EICHERMOT | EXIDEIND | HEROMOTOCO | MRF | M&M | MARUTI | MOTHERSON | TVSMOTOR | TATAMOTORS | TIINDIA
🏦 Banking & Financial Services:
AU Small Finance Bank Ltd. | Axis Bank Ltd. | Bank of Baroda | Canara Bank | Federal Bank Ltd. | HDFC Bank Ltd. | ICICI Bank Ltd. | IDFC First Bank Ltd. | IndusInd Bank Ltd. | Kotak Mahindra Bank Ltd. | Punjab National Bank | State Bank of India | Bajaj Finance Ltd. | Bajaj Finserv Ltd. | Cholamandalam Investment and Finance Company Ltd.
⚗️ Chemicals:
Aarti Industries Ltd. | Atul Ltd. | Bayer Cropscience Ltd. | Chambal Fertilizers & Chemicals Ltd. | Coromandel International Ltd. | Deepak Nitrite Ltd. | E.I.D. Parry (India) Ltd. | Gujarat Fluorochemicals Ltd. | Gujarat Narmada Valley Fertilizers and Chemicals Ltd. | Himadri Speciality Chemical Ltd. | Linde India Ltd. | Navin Fluorine International Ltd. | PCBL Chemical Ltd. | PI Industries Ltd. | Pidilite Industries Ltd. | SRF Ltd. | Solar Industries India Ltd. | Sumitomo Chemical India Ltd. | Tata Chemicals Ltd. | UPL Ltd.
🛍️ FMCG:
Britannia Industries Ltd. | Colgate Palmolive (India) Ltd. | Dabur India Ltd. | Emami Ltd. | Godrej Consumer Products Ltd. | Hindustan Unilever Ltd. | ITC Ltd. | Marico Ltd. | Nestle India Ltd. | Patanjali Foods Ltd. | Radico Khaitan Ltd. | Tata Consumer Products Ltd. | United Breweries Ltd. | United Spirits Ltd. | Varun Beverages Ltd. | Dmart
💊 Pharma & Healthcare:
Abbott India Ltd. | Alkem Laboratories Ltd. | Apollo Hospitals Enterprise Ltd. | Aurobindo Pharma Ltd. | Biocon Ltd. | Cipla Ltd. | Divi's Laboratories Ltd. | Dr. Reddy's Laboratories Ltd. | Fortis Healthcare Ltd. | Glenmark Pharmaceuticals Ltd. | Granules India Ltd. | Ipca Laboratories Ltd. | Laurus Labs Ltd. | Lupin Ltd. | Mankind Pharma Ltd. | Max Healthcare Institute Ltd. | Sun Pharmaceutical Industries Ltd. | Syngene International Ltd. | Torrent Pharmaceuticals Ltd. | Zydus Lifesciences Ltd.
💻 IT & Tech:
Coforge Ltd. | HCL Technologies Ltd. | Infosys Ltd. | LTIMindtree Ltd. | MphasiS Ltd. | Oracle Financial Services Software Ltd. | Persistent Systems Ltd. | Tata Consultancy Services Ltd. | Tech Mahindra Ltd. | Wipro Ltd.
⚒️ Metals:
APL Apollo Tubes Ltd. | Adani Enterprises Ltd. | Hindalco Industries Ltd. | Hindustan Copper Ltd. | Hindustan Zinc Ltd. | JSW Steel Ltd. | Jindal Stainless Ltd. | Jindal Steel & Power Ltd. | Lloyds Metals And Energy Ltd. | NMDC Ltd. | National Aluminium Co. Ltd. | Steel Authority of India Ltd. | Tata Steel Ltd. | Vedanta Ltd. | Welspun Corp Ltd.
🏙️ Realty:
Anant Raj Ltd. | Brigade Enterprises Ltd. | DLF Ltd. | Godrej Properties Ltd. | Macrotech Developers Ltd. | Oberoi Realty Ltd. | Phoenix Mills Ltd. | Prestige Estates Projects Ltd. | Raymond Ltd. | Raymond Realty Ltd. | Sobha Ltd.
🧱 Durables & Cement:
Amber Enterprises India Ltd. | Bata India Ltd. | Blue Star Ltd. | Century Plyboards (India) Ltd. | Cera Sanitaryware Ltd. | Crompton Greaves Consumer Electricals Ltd. | Dixon Technologies (India) Ltd. | Havells India Ltd. | Kajaria Ceramics Ltd. | Kalyan Jewellers India Ltd. | PG Electroplast Ltd. | Titan Company Ltd. | V-Guard Industries Ltd. | Voltas Ltd. | Whirlpool of India Ltd. | ACC | Ambuja Cements | Ultratech Cement | Shree Cements | JK Cement
🛢️ Oil & Gas:
Adani Total Gas Ltd. | Aegis Logistics Ltd. | Bharat Petroleum Corporation Ltd. | Castrol India Ltd. | GAIL (India) Ltd. | Gujarat Gas Ltd. | Gujarat State Petronet Ltd. | Hindustan Petroleum Corporation Ltd. | Indian Oil Corporation Ltd. | Indraprastha Gas Ltd. | Mahanagar Gas Ltd. | Oil & Natural Gas Corporation Ltd. | Oil India Ltd. | Petronet LNG Ltd. | Reliance Industries Ltd.
✨ Final Thoughts
If you have any doubts or need help, feel free to ask. Take some time to reflect on this system. It offers clarity, discipline, and a pathway to wealth and peace of mind.
Don’t overconsume content. Stick to one tested process. Treat trading like a business, not a quick-money scheme.
🎯 Proven Success Rate: 80%
Add these stocks to your watchlist and follow the system diligently.
Wishing you successful trades ahead. May we all grow together. Happy to help always. 🙏
Swing Trading - Stock Options Buying Strategy📈 Swing Trading Strategy – Stock Options
Tools Used: 9 SMA, RSI, Market Structure
Stock Universe: 25 Pre-Selected High Beta, Highly Liquid F&O Stocks
🔒 No further filtering or stock selection is required. Trade only within this universe.
✅ Strategy Overview
This is a swing trading strategy focused on buying stock options, using a systematic multi-timeframe confirmation approach involving:
• 9-period Simple Moving Average (9 SMA)
• Relative Strength Index (RSI)
• Market Structure
📌 Rules of Engagement
1. 📅 Monthly Timeframe – Primary Trend Filter
• The monthly candle must close above the 9 SMA.
• The RSI must be greater than 50 on the monthly chart.
2. 📆 Weekly and Daily Timeframes – Trend Confirmation
• Both weekly and daily candles must close above the 9 SMA.
• The RSI must be above 50 on both the weekly and daily charts.
3. 🕒 Entry Trigger – 15-Minute Chart (Execution Timeframe)
Once higher timeframes align:
• Switch to the 15-minute chart.
• Wait for a pullback to the 9 SMA, and enter near this level.
4. 🛡️ Stop Loss – Initial Risk Management
• Set the stop loss just below the low of the daily candle that first closed above the 9 SMA.
5. 🏁 Exit & Re-Entry Criteria
• Exit the position if the daily candle closes below the 9 SMA.
• Re-enter only when the full setup aligns again across all timeframes.
🔁 Profit Trailing Strategy
🔒 Step 1: Lock-In at Cost
• After three consecutive bullish daily candles, trail your SL to breakeven (your entry price).
📉 Step 2: Dynamic Trailing
• For every 5 bullish daily candles,
➤ Trail your SL to the lowest low of the 1st candle in that group.
• Continue this until a daily close below the 9 SMA, at which point exit completely.
⏰ Option Expiry Guidelines
• Enter trades only after 2 days of expiry (e.g., from Friday onwards for weekly expiry on Thursday).
• Exit trades before the last 2 days of expiry to avoid theta decay.
• Choose liquid strike prices in 0.5 or 1-point intervals.
▸ Example: If the stock is at ₹439, pick ₹400 ITM or ₹450 for better liquidity.
⚠️ Additional Notes
• Strictly trade within the 25 pre-identified high beta, liquid F&O stocks.
• This strategy performs best in trending markets.
• Avoid overtrading or deviating from the setup rules.
• Maintain a trading journal to track entries, exits, and stop loss adjustments.
•
📊 High Beta, Liquid F&O Stocks (Current List)
Adani Enterprises Adani Power Axis Bank IndusInd Bank Bajaj Finance Kotak Mahindra Bank HDFC Bank Tata Motors Larsen & Toubro JSW Steel Reliance Industries IndiGo Tech Mahindra Titan Sun Pharma Cipla Bajaj Finserv BPCL Mahindra & Mahindra Aurobindo Pharma Dr Reddy’s Laboratories Shriram Finance Lupin Container Corporation (Concor) Siemens
VIMP - Same process will be followed for Downtrend/PE buying. Montly candle must give its closing below 9 SMA with RSI 50 crossing below
Spot Intraday Long Trades with TradingView ScreenerHI folks!
I don't know how many of you have used the new TradingView Screener to spot opportunities.
Intraday Long Opportunities
In this example, I want to screen stocks with the following condition.
Market India
Change % greater than 4%
Turnover greater than 10 Cr. (to filter only heavy stocks)
I have excluded Market Cap filter in the above screener. However, I usually add it and the reason is that if the stock is still showing momentum at EOD, I will take delivery. Instead of attempting to find opportunities every day, if a good trade is captured, then hold it as long as momentum persists.
Follow the video to see how I have done it.
I usually take entries only on the 5 minutes chart. However, my signal comes from HTF.
Powerful Screening
With the new Screener you can create your own powerful screeners for all type of trading set ups. Try it out.
I hope the above example helps you create your own screeners.
All the best with your trades.
PriceCatch

How to Use Heatmap in TradingView – Step by StepHeatmaps help you quickly see which stocks or cryptos are going up or down. In this guide, you'll learn how to use the heatmap on TradingView in a simple way.
📍 Step 1: Go to TradingView
Go to the website: (www.tradingview.com)
Make sure you're logged into your account.
Click on the Three lines located on the right top corner then click on "Products".
📍 Step 2: Open the Heatmap
Move your mouse to the top menu and hover over "Screeners"
Click on "Heatmaps" from the dropdown.
You’ll see two options:
Stock Heatmap 📈
Crypto Heatmap 💰
Pick the one you want to explore.
📍 Step 3: Choose Your Market
By default, it may show US stocks. You can change that.
Use the options at the top to filter by:
Exchange (like NSE, NYSE, etc.)
Sector (like Tech, Energy, Banks, etc.)
Market cap, price, or volume
📍 Step 4: Understand the Colors
Green boxes mean the price is going up ✅
Red boxes mean the price is going down ❌
Darker color means a stronger move
Bigger boxes mean bigger companies or higher volume
📍 Step 5: Hover Over a Box
When you move your mouse over a box, it shows more details:
Ticker symbol
Current price
% change
Market cap
If you click on a box, it will open the chart.
📍 Summary
The heatmap is a simple tool that gives a quick view of the market.
Use it daily to track market trends, find trade setups, and stay updated on what’s moving.
Disclaimer :
This Post is not financial advice, it's for educational purposes only highlighting the power of Tradingview and its features.

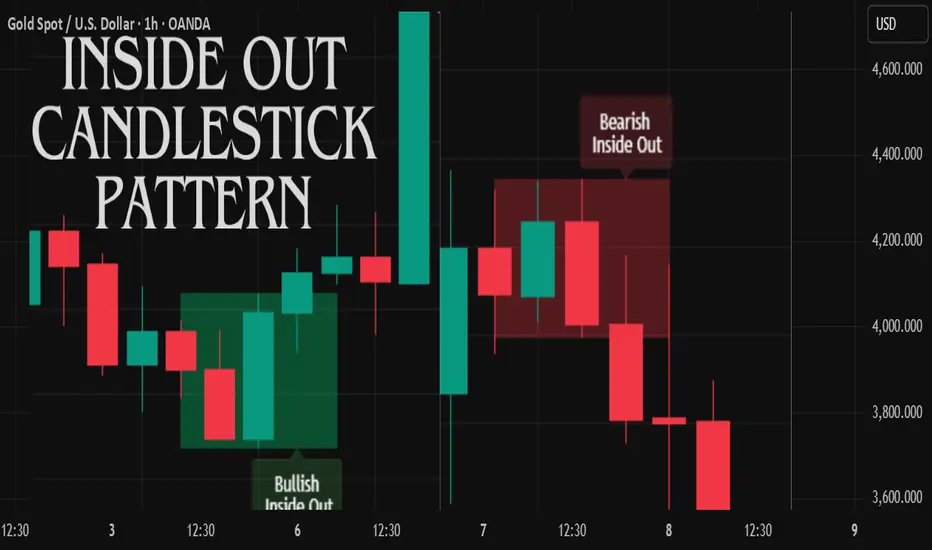
What is Inside out Candlestick Pattern ????The Inside Out pattern builds upon a classic engulfing setup by adding a breakout confirmation, making it a refined and filtered approach to candlestick analysis.
Bullish Inside Out Logic:
- Bar must be a bullish engulfing candle (engulfs previous bearish candle).
- Current bar must be bullish and must close above the high of the engulfing candle (a bullish breakout).
- When this setup is confirmed, a shaded green box is drawn around the range of the engulfing candle and its preceding bar.
Bearish Inside Out Logic:
- Bar must be a bearish engulfing candle (engulfs previous bullish candle).
- Current bar must be bearish and must close below the low of the engulfing candle (a bearish breakdown).
- When confirmed, a red box highlights the zone formed by the engulfing candle and its prior bar.
I have already published a free indicator around on this candlestick pattern click on the link to use it.
What is Open Interest?
Open interest (OI) is the total number of active contracts held by traders at any moment. It helps gauge market activity and trends, especially in futures and options trading.
Increasing OI: More money is entering the market, suggesting a bullish trend.
Decreasing O: Indicates a potential end to the current price trend.
What is Volume?
Volume measures the number of contracts traded in a day. It shows how many transactions occurred, regardless of whether they were new or existing contracts.
Key Difference: Open interest counts active contracts, while volume counts contracts traded.
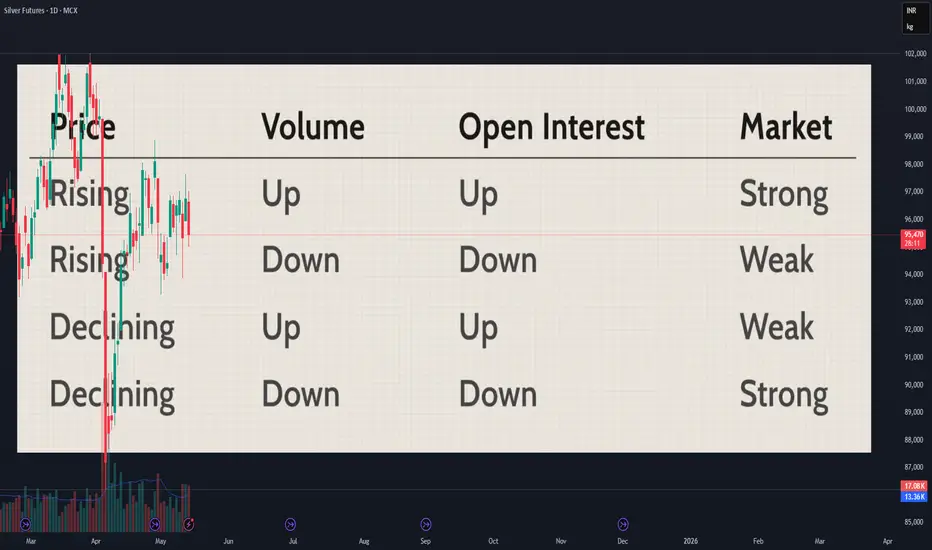
What is Price Action?
Price action tracks how a security's price moves over time, indicating trends.
Market Strength: If prices rise with increasing volume and OI, the market is strong.
Market Weakness: If prices rise but volume and OI fall, the market may be weak.
How is Open Interest Calculated?
For example, if Trader A buys 1 contract from Trader B, OI increases by 1. If Trader C buys 2 contracts from Trader D, OI rises by 2, totaling 3. If Trader A closes their position, OI decreases unless a new trader opens a position.
Analyzing Open Interest Data:
1. Rising OI + Rising Prices: Bullish market with active buyers.
2. Rising Prices + Falling O: Money may be leaving, indicating a bear market.
3. High OI + Falling Prices: Potential panic selling as buyers lose money.
4. Falling Prices + Decreasing OI: Sellers under pressure, suggesting a negative outlook.
Understanding these concepts helps traders make smarter decisions in the market.
What is Pine Script in TradingView ??? 📘 What is Pine Script in TradingView?
If you're using TradingView and wondering how traders build those custom indicators and strategies—the answer is 👉 Pine Script.
🧠 Pine Script is TradingView’s powerful scripting language that allows you to create:
✅ Custom indicators
✅ Backtestable strategies
✅ Alerts and signals
✅ Visual dashboards and overlays
It’s beginner-friendly but powerful enough to build complex tools. You can start with just a few lines of code and end up building your own version of RSI, Supertrend, or even institutional-grade dashboards!
🔧 What makes Pine Script special?
* It runs directly on TradingView charts
* Executes fast with minimal code
* Supports historical and real-time data
* Enables backtesting strategies with visual trade entries/exits
📈 Whether you're a trader who wants to tweak existing indicators or a developer aiming to automate signals, Pine Script gives you full control over your charting experience.
Where to Find it ?
How to start Coding ?
This was the basic post go to the official material to learn more about it...
www.tradingview.com
Time-Tested Tips for Better Risk Management in Trading
📝 Develop a Trading Plan
• Start with a Plan: Avoid jumping into trades without preparation. A solid trading plan is
your blueprint for success.
• Key Components: Define your entry points, stop-loss levels (to limit losses), and target
profit levels in advance.
• Why It Matters: A structured plan provides clarity during stressful trading situations and
ensures consistency with your risk tolerance.
________________________________________
🧘♂️ Understand Your Risk Tolerance
• Self-Reflection: Assess your emotional and psychological response to risk.
Know your comfort level with losses, market fluctuations, and stress.
• Financial Awareness: Factor in your income, savings, debts, and expenses to
gauge how much risk you can afford.
• Personalization is Key: There’s no one-size-fits-all strategy.
Tailor your risk management approach to your account size, goals,
and unique circumstances.
________________________________________
📚 Follow Your Trading System
• Have a Clear System: Establish rules for entering and exiting trades to maintain discipline
and avoid impulsive decisions.
• Backtest and Research: Test your system against historical data and simulate performance
in different market conditions.
• Stick to It: If your system has a proven edge, trust it. Jumping between strategies after
losses often leads to bigger losses.
________________________________________
🚨 Use a Stop-Loss
• What is a Stop-Loss? A predefined price level where you exit a trade to
limit potential losses.
• Why It’s Important: Prevents emotional decision-making and ensures you
quantify your risk before entering a trade.
________________________________________
✂️ Manage Your Position Size
• Avoid Overexposure: Adjust your position size to manage risk effectively and
avoid putting too much capital into one trade.
• Diversify: Don’t put all your eggs in one basket unless you fully understand and
accept the risks.
Risk-Reward Ratios: Quick Reference
1:2 Risk-Reward
• Risking $1 to make $2
• Win 33% of the time to break even.
• Common for day and swing traders aiming for moderate profits.
• Example: Stop-loss at 10 pips, target profit at 20 pips.
________________________________________
1:3 Risk-Reward
• Risking $1 to make $3
• Win 25% of the time to break even.
• Ideal for trades with a high-probability setup and larger moves.
• Example: Stop-loss at $50, target profit at $150.
________________________________________
1:5 Risk-Reward
• Risking $1 to make $5
• Win 17% of the time to break even.
• Suitable for trend-following strategies or breakout trades with significant momentum.
• Example: Stop-loss at 5% of capital, target profit at 25%.
________________________________________
❌ Don’t Overtrade or Revenge Trade
• Control Impulses: Avoid the urge to overtrade or recover losses through high-risk trades.
• Stay Rational: Emotional trading can lead to poor decisions and bigger losses.
Trade with a clear head and logic.
________________________________________
📔 Maintain a Trading Journal
• Track Your Trades: Document your trades to identify patterns, mistakes, and
areas for improvement.
• Enhance Strategies: Regular reviews help refine your approach,
improve risk management, and evolve as a trader.
• Accountability: A journal instils discipline and serves as a learning tool for future trades.
________________________________________
✅ Final Reminders
• Trade with discipline, not emotions.
• Always align your strategies with your risk tolerance and financial situation.
• Remember, trading is a marathon, not a sprint—stay consistent and patient.
________________________________________
Note- The Magic Formula for Lot Size Calculation (1% Risk)
Formula = 1% of Capital/Stop Loss in Pips/10
Example Scenarios:
Capital = $5,000 | Stop Loss = 30 pips: in XAUUSD
1% of capital = 50$
Lot size = 1% of Capital/Stop Loss in Pips/10 = 50/30/10 = 0.16
🚀 Thanks for reading!
Drop your thoughts or additional tips in the comments below. Let’s grow and trade smarter together! Cheers! 🌟

Adapting to SEBI's New Rules: A Guide for Retail Options TradersIntroduction
The Securities and Exchange Board of India (SEBI) has recently announced new regulations aimed at strengthening the equity index derivatives framework. These changes, set to be implemented in stages from November 2024 to April 2025, will significantly impact retail options traders. This article explores the new rules, their implications, and how traders can adapt their strategies to thrive in this evolving landscape.
www.sebi.gov.in
New SEBI Rules and Their Impact:
Navigating the world of options trading in India just got a little more interesting with the introduction of new regulations by the Securities and Exchange Board of India (SEBI). For retail traders who are trying to figure out how to adapt to these new rules, understanding the key details is a good first step. Let’s dive into the specifics of these regulations and their effects on trading practices.
1. Upfront Collection of Option Premium:
Starting February 1, 2025, traders will be required to pay the full options premium upfront. This measure aims to reduce excessive leverage and discourage positions beyond available collateral.
Impact: This will limit the number of contracts traders can buy, potentially reducing overall market participation but also encouraging more responsible trading practices.
2. Removal of Calendar Spread Treatment on Expiry Day:
From February 1, 2025, the benefit of offsetting positions across different expiries (calendar spread) will not be available on the expiry day for contracts expiring that day.
Impact: This could lead to increased margin requirements on expiry days, affecting traders who rely on calendar spread strategies.
3. Intraday Monitoring of Position Limits:
Beginning April 1, 2025, exchanges will monitor position limits intraday, with a minimum of 4 random snapshots daily.
Impact: Traders will need to be more vigilant about their position sizes throughout the trading day to avoid penalties.
4. Increased Contract Size:
After November 20, 2024, new index derivatives contracts will have a minimum value of Rs. 15 lakhs, up from the current Rs. 5-10 lakhs range.
Impact: This change may price out some smaller retail traders from the market, but it also encourages more serious participation and potentially reduces market volatility.
5. Rationalization of Weekly Index Derivatives:
From November 20, 2024, each exchange will offer weekly expiry contracts for only one benchmark index.
Impact: This could concentrate liquidity in fewer products, potentially leading to better price discovery but also limiting trading options.
The exchanges Bombay Stock Exchange (BSE) and National Stock Exchange(NSE) will have to select 1 index from the existing for weekly expiry and the rest will be monthly expiry. For example, there is a possibility that NSE may opt to go for Bank Nifty for weekly expiry and Nifty, Fin Nifty and Midcap Nifty for monthly expiry whereas BSE may opt to go for Bankex for weekly expiry and Sensex for monthly expiry.
6. Increased Tail Risk Coverage:
Starting November 20, 2024, an additional 2% Extreme Loss Margin (ELM) will be levied on short options contracts on expiry day.
Impact: This will increase the cost of writing options on expiry days, potentially reducing speculative activity.
Overview of the New Regulations
SEBI’s new rules are designed to ensure a more transparent and fair-trading environment. They cover a range of changes in how options trading is conducted, all aiming to protect traders and enhance market integrity.
- Increased Transparency: SEBI is pushing for more transparent trading activities. This means traders will have access to more information and insights about market movements which can help in making informed decisions.
- Higher Compliance Standards: With a stronger emphasis on compliance, SEBI is keen on maintaining robust regulatory practices. This is to prevent issues like fraud or market manipulation from affecting retail traders.
- Leverage Control: New rules have introduced strict controls on leverage, which impacts the amount of capital a trader can use relative to the actual cash they have. While this might seem restrictive, it’s intended to lower risk and safeguard trader investments.
Key Changes Affecting Retail Options Traders
Retail options traders have specific adjustments to make under these new rules. Here are some of the key changes directly impacting you:
1. Portfolio Diversification:
With increased costs and limitations in options trading, diversifying across different asset classes and strategies becomes crucial. Consider including a mix of stocks, ETFs, and other derivatives in your portfolio to spread risk.
2. Shift to Swing/Positional Trading Style:
The new rules may make intraday trading less attractive due to increased monitoring and costs. Traders should consider shifting focus to swing or positional trading strategies that align with longer-term market trends.
3. Focus on Risk-Defined Strategies:
With higher margin requirements and upfront premium payments, traders should prioritize risk-defined strategies like spreads (bull call spreads, iron condors) over naked options positions. These strategies offer better risk management and capital efficiency.
4. Continuous Education:
Stay updated with market developments and enhance your trading skills through trading reputable education providers. Focus on advanced options strategies, risk management techniques, strategy optimization and market analysis to adapt to the changing landscape.
Best Practices:
1. Proper Position Sizing: With stricter position limits, ensure your trades are appropriately sized relative to your account.
2. Regular Portfolio Review: Frequently assess your positions to ensure compliance with new regulations and to optimize your strategy.
3. Use of Technology: Leverage trading platforms and tools that can help monitor positions and calculate margins in real-time.
4. Risk Management: Implement strict stop-loss orders and consider using options to hedge your portfolio.
Conclusion:
The new SEBI regulations present both challenges and opportunities for retail options traders. While they may initially seem restrictive, these rules aim to create a more stable and fair market environment. By adapting strategies, focusing on education, and implementing best practices, traders can navigate these changes successfully. The key lies in embracing a more disciplined, risk-aware approach to trading, which ultimately contributes to long-term success in the markets. As the derivatives landscape evolves, those who adapt quickly and intelligently will be best positioned to capitalize on new opportunities while managing risks effectively.
Disclaimer
Investment in securities market is subject to market risks, read all the related documents carefully before investing.
