Continuation of the Liquidity Grab concept I make educational content videos for trading, this will be a continuation of what happens after a liquidity grab in the markets
No Bias - No predications - only telling concepts and information on general trends of index
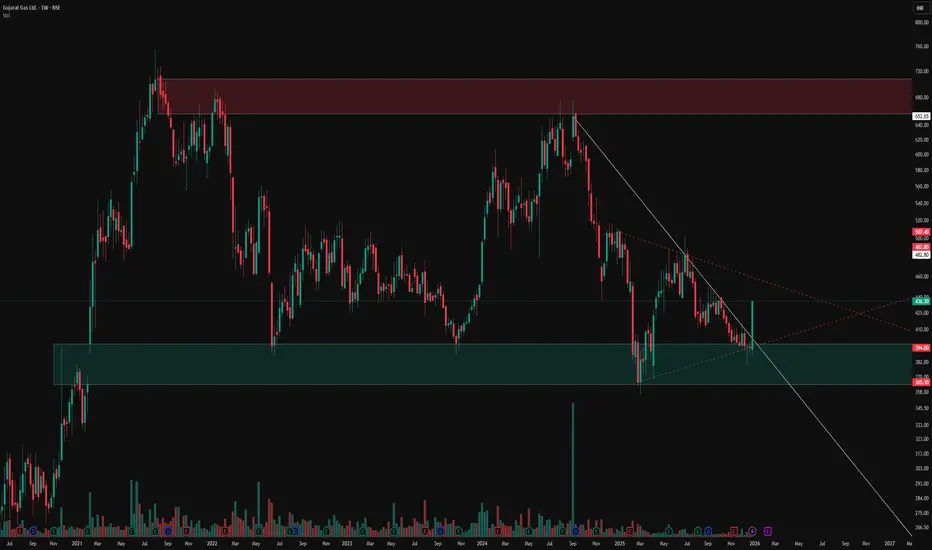
Tradingview

XAUUSD – H2 Technical AnalysisXAUUSD – H2 Technical Outlook: Short-Term Sell Pressure as Liquidity Gets Cleared | Lana ✨
Gold is showing signs of short-term weakness after an aggressive upside expansion. Price action suggests the market may continue to move lower in the near term, not as a trend reversal, but as a liquidity-driven correction within a broader bullish structure.
At this stage, the focus shifts from continuation to how price behaves while liquidity is being taken below structure.
📈 Market Structure & Price Behavior
The recent vertical rally has left the market overextended, making a corrective phase technically healthy.
Price has broken below short-term support and is now trading under a descending corrective trendline, signaling short-term bearish pressure.
This type of structure often develops when the market needs to clean buy-side positions before rebuilding for the next leg.
While the higher-timeframe trend remains bullish, the intraday bias has shifted to corrective / bearish until liquidity objectives are met.
🔍 Key Liquidity Zones on the Chart
Short-term sell zone: the descending trendline near current price As long as price reacts below this trendline, rallies are more likely to be sold.
Scalping buy liquidity: around 5050–5070 This area may generate temporary bounces, but reactions here should be treated as short-term only.
Key bullish order block: 4825 – 4830 A critical zone where stronger buyer participation may appear if the sell-off extends.
Major swing liquidity zone: 4613 – 4625 This is a high-confidence liquidity pocket where the market could complete a deeper correction and reset the broader bullish structure.
🎯 Trading Scenarios
Primary scenario – Continuation of the pullback: As long as price remains below the descending trendline, gold may continue to move lower to sweep liquidity below recent lows. This favors sell-on-rallies rather than buying strength.
Secondary scenario – Temporary reaction: Short-term bounces may occur around the 5050–5070 area, but without structural reclaim, these moves are more likely corrective than trend-changing.
Structural defense scenario: If price reaches the 4825–4830 or 4613–4625 zones, watch closely for signs of stabilization and absorption, which would signal that the liquidity objective has been completed.
🧠 Lana’s View
This move lower is best seen as liquidity cleanup, not panic selling. Lana stays patient during corrective phases, avoiding early longs and waiting for price to reach clear liquidity zones before reassessing bullish continuation.
✨ Let the market take what it needs, then look for structure to rebuild.

Triangle Contraction Symphony: Hidden Supports, Inverted H&SWitness the mesmerizing dance of price action in this chart masterpiece. A pristine triangle contraction pattern emerges, bounded by a supportive yellow trendline below and a red counter-trendline above, perfectly channeling price within tightening bounds.
Layered hidden dotted support/resistance lines add depth, illustrating how price meticulously respects each level—time and again.
Culminating in a textbook inverted head and shoulders formation, this setup showcases contraction elegance at its finest.
Purely educational: Reliving how these levels held in the past. No directional bias here—just the raw beauty of price action precision.
Disclaimer: This post is for educational purposes only, demonstrating historical price action behavior and level interactions. No directional bias or trading recommendations are implied. Past performance is not indicative of future results. Trade at your own risk.

Hidden Channels & Fib Golden Zone : Beauty of Price ActionObservational Post only Showcasing how price action works using historical price points only
Observe how price elegantly respects this counter trendline on the weekly chart (red line), forging consistent lower highs through precise rejections. A subtle parallel channel lurks beneath, acting as a hidden guardian. Channels like these shield against fakeouts, confirming pure breakouts only when breached alongside key lines.
Shifting to the monthly view, the Fib retracement from swing low to high highlights the golden zone (50 to 61%, white shaded), a magnet for retracements where price often pauses or reverses with stunning symmetry.
This interplay reveals price action's beauty: layers of structure working in harmony, rewarding patient observers.
Disclaimer: This is for educational purposes only, showcasing historical price action observations. Not financial advice. Always conduct your own analysis and manage risk appropriately.

Resistance to Flip + Equilibrium Mastery: Pure Price ActionLeft Chart (Monthly TF):
- Classic resistance-turned-support flip. Price tested this level multiple times historically (data >3 months old), holding firm as dynamic support. Proof that prior barriers evolve with pure price behaviour.
Right Chart (Weekly TF):
- Equilibrium at 0.5: Stock has danced around this pivot, building multiple resistances above/below—trading in balance like clockwork.
- Parallel Channel Magic( Red lines ): Counter-trendline + parallel upper line forms a textbook channel, showcasing how price respects geometry over time.
- Respected Demand Zone (Green): Multiple bounces here confirm its strength—demand alive and kicking historically.
Disclaimer: This is for educational purposes only, showcasing historical price action (>3 months old). Not financial advice, trade recommendations, or predictions. Always DYOR and trade at your own risk.

Multi-Timeframe Channel Mastery UnveiledTradingView's multi-window layout reveals pristine price action across weekly and monthly charts, highlighting structural precision without forecasts.
Both timeframes demonstrate unwavering respect for key lines and zones, underscoring market geometry's reliability.
Monthly Chart Insights
The right-side monthly view features a robust supply zone where sellers dominate, enforcing repeated rejections with textbook accuracy. A white trend line provides dynamic support, paired with the red parallel channel line creating a textbook channel that price honors meticulously. This setup exemplifies how channels contain swings beautifully.
Weekly Chart Patterns
On the left, weekly timeframe displays two pivotal pattern lines: a counter trend line and a primary trend line, both tracked flawlessly through advances and retreats. These lines form the backbone of the structure, filtering noise and revealing order in motion.
Disclaimer
Purely educational analysis of past price action—no advice, signals, or predictions provided. Trading carries high risk of capital loss; perform independent due diligence and seek professional guidance.

What exactly you have to do when the Markets are REDI make educational content videos for swing trading basis
Charts used are older than 3 months in this video

XAUUSD (Gold) | Technical Outlook | 9th Jan'2026XAU/USD – Gold Technical Outlook (Jan 9, 2026)
Gold (XAU/USD) is trading near 4,474 and continues to show a strong bullish structure across intraday and higher timeframes. Price is holding firmly above all major moving averages (MA 5–MA 200), signaling sustained buying strength.
Momentum indicators remain supportive with RSI around 59, MACD positive, and ADX above 30, confirming trend continuation rather than exhaustion.
As long as price holds above 4,470, the upside remains favored toward 4,481 → 4,489 → 4,501. Any dip toward 4,462–4,450 may be viewed as short-term profit booking, while the broader trend stays bullish unless 4,430 breaks decisively.
⚠️ Disclaimer: This content is for educational purposes only. Not financial advice.

XAUUSD (H1) – Inverse Head & Shoulders confirmed, caution POC.Market overview
Spot gold has pushed above $4,470/oz, extending its strong performance after setting multiple record highs throughout 2025. The broader bullish backdrop remains intact, supported by trade-war concerns, ongoing geopolitical instability, and accommodative monetary policy across major economies. Strong and persistent buying from central banks continues to underpin gold’s long-term outlook into 2026.
Technical view – Inverse Head & Shoulders
On the H1 chart, gold has clearly formed an Inverse Head & Shoulders structure:
Left shoulder: Formed after the initial sharp sell-off
Head: A deeper liquidity sweep with strong rejection
Right shoulder: Higher low, showing sellers losing momentum
Neckline / POC zone: Around the 4460–4470 area, where price is currently reacting
The breakout above the neckline confirms bullish intent. However, price is now trading around a POC (Point of Control), which is often prone to psychological reactions and choppy price action.
Key levels to watch
Bullish continuation zone
Holding above the neckline keeps the bullish structure valid.
A clean acceptance above the POC opens the door for continuation toward higher liquidity and Fibonacci extension targets.
Pullback & risk zone
Liquidity risk: 4333 – 4349
If the market fails to hold above the neckline, a deeper pullback into this liquidity zone is possible before buyers step back in.
Fundamental context
Gold’s recovery is driven by trade-war fears, geopolitical tensions, and expectations of looser monetary policy globally.
Central bank demand remains a key pillar supporting prices.
In 2026, gold performance will continue to be influenced by USD valuation, overall risk sentiment, and central bank policy decisions.
Lana’s trading approach
No chasing near the POC. Expect reactions and fake moves.
Prefer buying pullbacks rather than entering at highs.
If price holds above the neckline with strong structure, bullish continuation remains the main scenario.
If the neckline fails, wait patiently for liquidity to be taken lower before looking for new buy setups.
This analysis reflects Lana’s personal market view and is for study purposes only. Always manage risk carefully. 💛

Hidden Parallel Channel: Weighted Lines & Zones ExposedThis chart illustrates key technical elements where price interacts with multiple reference lines and zones, emphasizing their observed relevance based on proximity and historical behavior.
The red counter trend line, distant from price by 35-40%, carries less immediate weight, while the white counter trend line touched by price demonstrates stronger participation. Green highlights a long-term weekly demand zone from historical levels, and the white zone on daily timeframe marks a prior gap down with resistance reaction.
Parallel dotted white lines outline a hidden channel, repeatedly respected and rejected by price, underscoring its structural significance. These elements combine multi-timeframe context to showcase how markets organize around dynamic references rather than static predictions.
Motto is to showcase how one can create setup from any or all of the above ingredients, its all about perspective and how you approach and backtest in markets - experience is importnat - field experience in trading is scrolling Trading view and keep backtesting .
Disclaimer: This is purely educational content on price action, zones, and patterns. Not SEBI-registered advice. Charts use historical data >3 months old; NO forecasts, NO buy/sell recommendations, or guarantees of results. DYOR and consult professionals.

Unveiling Hidden Symmetrical Triangle and Saving from FakeoutsThis weekly chart post highlights key price action elements in a sideways pattern, focusing on zones, trendlines, and a subtle symmetrical triangle for educational observation. Green demand zones and red supply zones frame the overall range, while the white counter trend line traces internal fluctuations. The dotted red line uncovers a hidden symmetrical triangle, where converging lines often lead to breakout rejections observed as fakeouts
Key Chart Features
-Demand & Supply Zones: Green areas mark demand support, red zones indicate supply resistance, revealing price reactions within the sideways structure.
-Counter Trend Line: White line connects minor highs and lows, illustrating counter-trend swings that define the internal rhythm amid broader consolidation.
-Hidden Symmetrical Triangle: Dotted red outline exposes the converging pattern, a consolidation coil with balanced higher lows and lower highs, frequently trapping breakout attempts.
Disclaimer: Not a SEBI-registered advisor. This is purely educational on price dynamics, supply-demand, trendlines, and hidden patterns—no investment advice or forecasts. Past patterns do not guarantee future results; conduct your own analysis.
Lets Backtest the High, New High Strategy on Monthly time frameHello everyone, My name is Apoorv ( Full time Trader )
I make educational content videos
Charts used in this video are 3 months or older

Learn a NEW Trading Strategy before 2026 StartsI make educational content videos for swing trading - in this video I am showcasing a new strategy with market structure - trigger points and activation .
Charts used are 3 months or older for Backtesting only
Happy New Year to everyone .

XAUUSD – 3H Technical AnalysisXAUUSD – 3H Technical Analysis
✅ Lana is waiting for a pullback to enter safer BUY positions 💛
Trend: Strong bullish trend, continuously printing new highs
Timeframe: 3H
Current status: Price is moving vertically with no meaningful correction so far
Strategy: Do not chase price. Wait for a pullback into liquidity zones to look for BUY setups.
Market Context
During today’s Asian session, gold surged aggressively and moved close to the 4,500 level — a price area never seen before. The rally has been extremely steep, with almost no pauses or minor pullbacks, clearly showing that buying pressure is dominating the market.
From a fundamental perspective, expectations of a continued dovish stance from the Fed are weakening the USD. At the same time, escalating geopolitical tensions are strengthening gold’s role as a safe-haven asset. The clean breakout above 4,375–4,380, followed by 4,400, has attracted additional momentum-driven and speculative flows into the bullish trend.
3H Technical Outlook
On the 3H timeframe, the bullish market structure remains very clear, and price continues to respect the rising channel. However, after such an extended and sharp move, entering trades at elevated levels becomes increasingly risky.
From Lana’s perspective, during phases like this, patience is far more important than chasing the market. Waiting for a proper pullback offers better risk-to-reward opportunities.
If buying pressure remains strong after a consolidation or corrective phase, higher upside targets around 4,580 are entirely possible.
Key Price Zones Lana Is Watching
🔹 Near-term BUY zone – Liquidity area
Buy around: 4,415
This is the nearest liquidity zone where price may return to “reload” before continuing higher. Lana will closely monitor price reaction and structure at this level.
🔹 Longer-term BUY zone – Deeper correction
Long-term Buy: 4,38x
If the market delivers a clearer and deeper pullback, this zone becomes a higher-probability area for safer medium-term BUY opportunities.
Trading Notes
Avoid chasing price during periods of excessive volatility
Only enter trades when lower timeframes form a clear structure in line with Dow Theory
Reduce position size and prioritise risk management during highly euphoric market conditions
📌 Follow Lana as we analyse XAUUSD together on a daily basis.

Zoom Out: Bitcoin’s 14-Year Structural Expansion Explained!Hey Everyone, let's analyse long term structural view on Bitcoin as it is once again sitting inside the same structural expansion channel it has respected for more than 14 years.
Zooming out removes the noise, what looks random on lower timeframes reveals a very consistent long-term pattern.
Most traders focus on headlines. Long-term moves are built on structure.
Bitcoin has never moved randomly on higher timeframes. Every major cycle since 2011 has expanded inside a rising macro channel driven by demand, time, and liquidity.
Each cycle looks different on the surface, but the internal structure remains the same, higher lows forming on macro support, followed by exponential expansion phases.
Current price is still respecting the long-term rising structure, with buyers consistently stepping in near the lower boundary of the channel.
The upper zone shown is not a prediction. It represents the historical expansion boundary where previous cycles matured and volatility peaked.
As long as the macro structure remains intact, the probability continues to favor structural continuation rather than random collapse.
Key takeaway:
Markets don’t repeat perfectly, but they rhyme .
And Bitcoin has been speaking the same structural language for over a decade.
Conclusion:
This is not about catching tops or bottoms.
It’s about understanding where you are in the cycle , and acting accordingly.
If this structural perspective helped you, like, comment, and follow for more long term market studies.
Analysis By @TraderRahulPal | More analysis & educational content on my profile.
⚠️ DISCLAIMER: This analysis is for educational purposes only and reflects a long term structural view. It is not financial advice. Always manage risk and do your own research before making trading or investment decisions.

How Emotions Destroy Profitable TradersHow Emotions Destroy Profitable Traders
🧠 How Emotions Destroy Profitable Traders | Trading Psychology Explained
Most traders don’t fail because of strategy.
They fail because they can’t control emotions.
Even a profitable system becomes useless when emotions take control of decision-making. Let’s break it down 👇
😨 Fear: The Profit Killer
Fear appears after losses or during volatility.
What fear causes:
Closing trades too early
Missing high-probability setups
Moving stop losses emotionally
📉 Result: Small wins, big regrets.
Fear stops traders from letting probabilities play out.
😤 Greed: The Account Destroyer
Greed appears after wins.
What greed causes:
Overleveraging
Ignoring risk management
Holding trades too long
📈 Traders want “more” and end up losing everything.
Greed turns discipline into gambling.
😡 Revenge Trading: The Fastest Way to Blow an Account
After a loss, many traders try to win it back quickly.
Revenge trading leads to:
Random entries
No confirmations
Breaking trading rules
🔥 One emotional trade often leads to many bad trades.
🤯 Overconfidence After Wins
Winning streaks create false confidence.
Overconfidence causes:
Larger position sizes
Ignoring market context
Believing losses “won’t happen”
Markets punish ego — always.
😴 Impatience: Silent Consistency Killer
Good trades require waiting.
Impatience leads to:
Forcing setups
Trading low-quality zones
Entering without confirmation
⏳ The market rewards patience, not speed.
🧘♂️ How Profitable Traders Control Emotions
Professional traders don’t eliminate emotions — they manage them.
Key habits:
Fixed risk per trade
Pre-planned entries & exits
Accepting losses as part of business
Waiting for confirmation
Trading less, not more
🧠 Discipline > Emotion
📊 Process > Outcome
📌 Final Thought
If emotions control your trades, the market will control your money.
Master your psychology, and your strategy will finally work.
Trade the plan.
Respect risk.
Stay patient.

"Gold in Firm Bullish Control""Gold in Firm Bullish Control"
Gold is currently trading in a constructive upward environment, where price behavior reflects sustained participation from institutional buyers rather than speculative spikes. Recent movements show that upside progress has been built through measured advances followed by controlled pauses, a pattern that typically appears when the market is preparing for continuation rather than exhaustion.
Market activity suggests that buy-side interest remains dominant, with pullbacks being absorbed efficiently and failing to generate follow-through selling. This indicates that bearish pressure lacks commitment, while bullish participation remains organized and patient. The absence of aggressive downside momentum during pauses reinforces confidence in the prevailing direction.
Volatility has compressed after an expansion phase, which often precedes another directional move. This compression reflects balance at higher price levels, a sign that the market is accepting value above prior ranges. Such acceptance generally supports further upside attempts once activity re-expands.
From a flow perspective, price reactions imply that liquidity has already been tested and cleared, reducing immediate downside vulnerability. The market now appears positioned for continuation rather than correction, with sentiment favoring gradual appreciation rather than sharp reversals.
Overall Assessment:
Gold remains in a positive continuation phase, where conditions favor further upward progress as long as market behavior continues to show acceptance at elevated levels and pullbacks remain corrective in nature

ACTUSDT – Sell Setup (Futures | Intermediate)ACTUSDT – Sell Setup (Futures | Intermediate)
ACTUSDT is showing clear signs of weakness after failing to sustain above the recent resistance zone. Price action suggests sellers are regaining control, with lower highs forming and momentum shifting to the downside. A sell-stop entry at 0.02797 is planned to confirm continuation below support. If bearish momentum accelerates, price is expected to move toward 0.02739 as the first target, followed by 0.02677, which aligns with the next demand zone. The stop loss at 0.02884 is placed above the invalidation level to protect against false breakdowns. Overall, the structure favors continuation selling as long as price remains below resistance and broader market sentiment stays neutral to bearish.

XAUUSD – Lana Prefers BUY on Pullbacks to Fibonacci XAUUSD – Lana Prefers BUY on Pullbacks to Fibonacci 💛
Quick Summary
Short-term trend: Ongoing bullish continuation
Timeframe: H1
Market context: Thin liquidity ahead of the holiday period; price has not yet broken resistance decisively
Strategy: Prioritise BUY setups, waiting for a pullback to the 50% Fibonacci level
Market Context
Gold continues to hold its bullish momentum and is trading close to the all-time high area around 4350 USD/ounce. Although price has not yet fully broken the upper resistance, the overall bullish structure remains intact.
Gold’s upside is supported by weaker US labour data, expectations that the Fed may cut rates sooner, and rising geopolitical tensions, particularly concerns related to Venezuela ahead of President Trump’s upcoming speech.
With liquidity likely to remain thin due to the holiday period, price action may slow down. However, the primary bias still favours the upside.
H1 Technical Outlook
On the H1 chart, the bullish structure is well preserved. Price is consolidating just below a strong resistance zone, suggesting the market needs more time to absorb selling pressure.
The 50% Fibonacci retracement aligns with a support area that showed a strong reaction yesterday, making it a favourable zone to wait for a pullback and continue trading in line with the trend.
Intraday Trading Scenario
Main Scenario – Trend-following BUY
Entry: 4309 – 4312
SL: 4300
TP: 4330 → 4352 → 4390
Lana prefers to wait for a healthy pullback into this zone before entering, rather than chasing price near resistance.
Trading Notes
Thin liquidity → avoid large position sizes; focus on risk management
If price does not pull back into the planned zone, Lana is comfortable staying flat
Watch price reaction at resistance before expecting a breakout to new highs
Lana’s Note 🌿
Every setup is just one of many possible market scenarios. Lana always defines a clear stop loss and only trades when price reaches the pre-planned zone.

XAUUSD – Overall Market View (12/16) XAUUSD – Overall Market View (12/16)
Strategy Summary
Gold is holding its ground, but the main direction is still unclear because today comes with a series of high-impact news. My approach today is “wait for confirmation before entering”, with two clearly defined scenarios:
Bullish confirmation: Break and hold above 4320
Bearish confirmation: Break and hold below 4271
1) Key Price Levels on the Chart
4320: Bullish confirmation level + resistance / upper FVG zone
4370 – 4373: Strong liquidity zone → preferred area to look for SELL reactions
4271: Bearish confirmation level (support break)
Lower zone (based on structure / trendline): Deeper support area where price may react and bounce, as marked by the arrow on the chart
2) Today’s Trading Scenarios (Trade the Level Style)
Scenario A – Bullish (Only valid if price breaks above 4320)
If an H1 candle closes clearly above 4320, gold is likely to move up and test the upper liquidity zone.
Preferred approach: wait for a pullback and BUY short-term, following the move (as shown by the arrow).
Avoid FOMO buys in the middle of the move.
Reasonable target: 4370 – 4373 (Strong Liquidity).
Note: The 4370 – 4373 zone is highly likely to see selling pressure, as large liquidity is resting there.
Scenario B – Bearish (Confirmed if price breaks below 4271)
If price breaks below 4271 and fails on the retest, the bearish scenario becomes dominant (classic sell retest setup).
✅ Sell: 4271
❌ SL: 4280
🎯 Expectation: Price may extend lower toward deeper structural support zones.
3) Main SELL Setup at the Major Liquidity Zone
✅ Sell Entry: 4370
❌ SL: 4380
Logic: This is a Strong Liquidity zone where profit-taking and distribution are likely to appear.
➡️ Only SELL on confirmation and reaction — no chasing trades.
4) Today’s News (High Volatility Expected)
Today’s US data can cause sharp moves and stop hunts on both sides:
Average Hourly Earnings m/m
Core Retail Sales m/m
Non-Farm Employment Change
Retail Sales m/m
Unemployment Rate
Flash Manufacturing PMI
Flash Services PMI
My rule: Reduce position size before news. After the news, wait for the market to show direction, then trade around 4320 / 4271.
5) Risk Management
Do not enter trades in the middle of a noisy range.
Only trade at key levels with confirmation.
💬 Question for everyone:
Which scenario are you leaning towards today — break above 4320 or break below 4271?

XAUUSD – Lana Prefers SELL, BUY Only for Short-Term ScalpingXAUUSD – Lana Prefers SELL, BUY Only for Short-Term Scalping 💛
Quick Summary
Short-term trend: Downward pressure dominates
Timeframe: H1
Strategy: Focus on SELL; BUY only for quick scalping at liquidity zones
Note: Today features multiple US data releases and events, so volatility may be higher than usual
Market Context
The market enters the session with a dense news flow: US Presidential speech, unemployment rate, seasonally adjusted Non-Farm Payrolls, and Retail Sales.
In such conditions, gold often experiences strong swings and liquidity sweeps before moving in the main direction. Therefore, Lana prioritizes selling at higher zones and only takes short-term BUY positions when price reaches clear support zones.
Technical Outlook
After the previous upward move, the H1 structure shows weakening price action, indicating the possibility of a continued downward move.
Upper zones where short-term resistance converges are suitable for following the intraday SELL trend. Below, liquidity zones may trigger temporary rebounds, but Lana considers these only for scalping and does not hold positions for long.
Intraday Trading Scenarios
Main Scenario – Trend-Following SELL
Sell: 4308 – 4312
SL: 4320
This is Lana’s preferred zone today. If price retraces into this area and shows rejection, the downtrend is likely to continue.
Buy Scenario 1 – Short-Term Scalping at Nearby Support
Buy: 4253
SL: 4240
This BUY is only for short swings, with quick profit-taking when price reacts.
Buy Scenario 2 – Scalping at Deep Liquidity Zone
Buy: 4213
SL: 4200
This is a stronger liquidity zone. If price drops quickly here during news, a technical rebound is possible, but Lana maintains the view not to hold BUY positions for long.
Session Notes
Asian & European sessions: Price may fluctuate and create technical retracements
US session: Strong news-driven volatility can sweep both sides before a clear direction emerges
Each scenario represents a probability, not certainty.
On high-news days, Lana always reduces position size, sets clear SLs, and is willing to skip trades if price does not reach the expected zones.

XAUUSD H1 – POC 4295 & Fibonacci Sell 4373 XAUUSD H1 – POC 4295 & Fibonacci Sell 4373
Strategy Summary
Today, I am not chasing price. The XAUUSD trading plan focuses on two key “high-quality” zones on the chart:
POC (Volume Profile) around 4295 to look for BUYs in line with money flow.
Fibonacci level at 4373 to look for SELLs when price reaches the premium zone.
Key Levels
BUY zone (POC – Volume Profile): 4295 (major liquidity area)
SELL zone (Fibonacci reaction): 4373
Deeper buffer if POC breaks: 4238 – 4241
Invalidation level: 4191
Scenario 1 – Primary Plan: BUY at the Liquidity Zone (POC)
✅ Buy limit around 4295 (preferably wait for H1 candle confirmation)
SL: 4287 (below POC to avoid noise)
TP1: 4330 – 4338
TP2: 4370 – 4373 (near the Fibonacci sell zone)
Logic:
POC represents the “fair value” or balance point of the Volume Profile. Price often gets attracted back to this level to collect liquidity before deciding the next direction.
Scenario 2 – SELL on Reaction at Fibonacci (Premium Zone)
✅ Sell around 4373 (wait for reaction or loss of momentum, do not chase sells)
SL: 4382
TP1: 4338 – 4330
TP2: 4295 (back to POC)
Logic:
The Fibonacci premium zone is where profit-taking pressure often appears. If price spikes into 4373 but fails to hold, it usually offers a clean reaction sell setup.
Alternative Scenario – If POC Is Broken
If price breaks below 4295 and clearly closes an H1 candle under this level, I will not force buys. In that case, priority shifts to waiting for price to react at:
4238 – 4241, or
deeper towards the lower balance / POC zone.
Always keep in mind: 4191 is the invalidation level.
News Context (to Avoid Getting Stopped Out)
Trump’s concerns about economic impact “not fully priced in yet” may increase political risk and market sensitivity.
Comments from Williams (FOMC, New York Fed) on economic outlook could trigger short-term volatility in USD and yields, causing gold to fluctuate.
Tip: Avoid late entries during news spikes. Only execute trades when price reaches the planned zones.
Risk Management
Maximum risk per trade: 1–2%
Do not trade in the middle of the range. Trade only at key levels.
If you are also watching 4295 and 4373, share your view:
👉 Are you leaning towards a BUY on pullback or a SELL on reaction today?

XAUUSD – Lana waits for reaction at resistance, focuses on ...XAUUSD – Lana waits for reaction at resistance, focuses on zone-based trading
Quick Summary
Context: Early in the week with many high-impact news events. Gold opened strong and is now approaching a major resistance area.
Timeframe: H1
Strategy: No chasing price. Prefer waiting to buy at liquidity void (VL) zones and selling short-term pullbacks at higher resistance.
Expectation: Asian–European sessions may move sideways; stronger volatility is more likely during the US session.
Market Context
The year-end period is usually packed with economic data. This week, Nonfarm Payrolls, CPI, and Retail Sales are released close together, along with interest rate decisions from the UK, Europe, and Japan.
For gold, this environment often leads to sharp moves during the US session, while earlier sessions tend to consolidate or make shallow pullbacks as the market waits for news.
Technical View
After a strong rally at the start of the week, price is now trading around a key resistance zone. On H1, the price action at the Asian open has left a liquidity void (VL), which is Lana’s preferred area to wait for buy opportunities in line with the main trend.
On the upside, a descending trendline combined with Fibonacci extension levels is forming a strong resistance zone, suitable for a short-term corrective sell.
Trading Scenarios for Early Week
Main Scenario – Buy at the liquidity void (VL)
Buy: 4298 – 4302
SL: 4294
This is Lana’s preferred zone. If price returns to fill the liquidity void and the structure holds, there is a high probability of a bullish reaction in continuation of the broader trend.
Alternative Scenario – Short-term sell at higher resistance
Sell: 4367 – 4370
SL: 4376
This is considered a short-term corrective move when price reaches strong resistance. The sell is counter-trend, so strict risk management is required and positions should not be held for too long.
