Zoom Out: Bitcoin’s 14-Year Structural Expansion Explained!Hey Everyone, let's analyse long term structural view on Bitcoin as it is once again sitting inside the same structural expansion channel it has respected for more than 14 years.
Zooming out removes the noise, what looks random on lower timeframes reveals a very consistent long-term pattern.
Most traders focus on headlines. Long-term moves are built on structure.
Bitcoin has never moved randomly on higher timeframes. Every major cycle since 2011 has expanded inside a rising macro channel driven by demand, time, and liquidity.
Each cycle looks different on the surface, but the internal structure remains the same, higher lows forming on macro support, followed by exponential expansion phases.
Current price is still respecting the long-term rising structure, with buyers consistently stepping in near the lower boundary of the channel.
The upper zone shown is not a prediction. It represents the historical expansion boundary where previous cycles matured and volatility peaked.
As long as the macro structure remains intact, the probability continues to favor structural continuation rather than random collapse.
Key takeaway:
Markets don’t repeat perfectly, but they rhyme .
And Bitcoin has been speaking the same structural language for over a decade.
Conclusion:
This is not about catching tops or bottoms.
It’s about understanding where you are in the cycle , and acting accordingly.
If this structural perspective helped you, like, comment, and follow for more long term market studies.
Analysis By @TraderRahulPal | More analysis & educational content on my profile.
⚠️ DISCLAIMER: This analysis is for educational purposes only and reflects a long term structural view. It is not financial advice. Always manage risk and do your own research before making trading or investment decisions.
Tradingview

How Emotions Destroy Profitable TradersHow Emotions Destroy Profitable Traders
🧠 How Emotions Destroy Profitable Traders | Trading Psychology Explained
Most traders don’t fail because of strategy.
They fail because they can’t control emotions.
Even a profitable system becomes useless when emotions take control of decision-making. Let’s break it down 👇
😨 Fear: The Profit Killer
Fear appears after losses or during volatility.
What fear causes:
Closing trades too early
Missing high-probability setups
Moving stop losses emotionally
📉 Result: Small wins, big regrets.
Fear stops traders from letting probabilities play out.
😤 Greed: The Account Destroyer
Greed appears after wins.
What greed causes:
Overleveraging
Ignoring risk management
Holding trades too long
📈 Traders want “more” and end up losing everything.
Greed turns discipline into gambling.
😡 Revenge Trading: The Fastest Way to Blow an Account
After a loss, many traders try to win it back quickly.
Revenge trading leads to:
Random entries
No confirmations
Breaking trading rules
🔥 One emotional trade often leads to many bad trades.
🤯 Overconfidence After Wins
Winning streaks create false confidence.
Overconfidence causes:
Larger position sizes
Ignoring market context
Believing losses “won’t happen”
Markets punish ego — always.
😴 Impatience: Silent Consistency Killer
Good trades require waiting.
Impatience leads to:
Forcing setups
Trading low-quality zones
Entering without confirmation
⏳ The market rewards patience, not speed.
🧘♂️ How Profitable Traders Control Emotions
Professional traders don’t eliminate emotions — they manage them.
Key habits:
Fixed risk per trade
Pre-planned entries & exits
Accepting losses as part of business
Waiting for confirmation
Trading less, not more
🧠 Discipline > Emotion
📊 Process > Outcome
📌 Final Thought
If emotions control your trades, the market will control your money.
Master your psychology, and your strategy will finally work.
Trade the plan.
Respect risk.
Stay patient.

"Gold in Firm Bullish Control""Gold in Firm Bullish Control"
Gold is currently trading in a constructive upward environment, where price behavior reflects sustained participation from institutional buyers rather than speculative spikes. Recent movements show that upside progress has been built through measured advances followed by controlled pauses, a pattern that typically appears when the market is preparing for continuation rather than exhaustion.
Market activity suggests that buy-side interest remains dominant, with pullbacks being absorbed efficiently and failing to generate follow-through selling. This indicates that bearish pressure lacks commitment, while bullish participation remains organized and patient. The absence of aggressive downside momentum during pauses reinforces confidence in the prevailing direction.
Volatility has compressed after an expansion phase, which often precedes another directional move. This compression reflects balance at higher price levels, a sign that the market is accepting value above prior ranges. Such acceptance generally supports further upside attempts once activity re-expands.
From a flow perspective, price reactions imply that liquidity has already been tested and cleared, reducing immediate downside vulnerability. The market now appears positioned for continuation rather than correction, with sentiment favoring gradual appreciation rather than sharp reversals.
Overall Assessment:
Gold remains in a positive continuation phase, where conditions favor further upward progress as long as market behavior continues to show acceptance at elevated levels and pullbacks remain corrective in nature

ACTUSDT – Sell Setup (Futures | Intermediate)ACTUSDT – Sell Setup (Futures | Intermediate)
ACTUSDT is showing clear signs of weakness after failing to sustain above the recent resistance zone. Price action suggests sellers are regaining control, with lower highs forming and momentum shifting to the downside. A sell-stop entry at 0.02797 is planned to confirm continuation below support. If bearish momentum accelerates, price is expected to move toward 0.02739 as the first target, followed by 0.02677, which aligns with the next demand zone. The stop loss at 0.02884 is placed above the invalidation level to protect against false breakdowns. Overall, the structure favors continuation selling as long as price remains below resistance and broader market sentiment stays neutral to bearish.

XAUUSD – Lana Prefers BUY on Pullbacks to Fibonacci XAUUSD – Lana Prefers BUY on Pullbacks to Fibonacci 💛
Quick Summary
Short-term trend: Ongoing bullish continuation
Timeframe: H1
Market context: Thin liquidity ahead of the holiday period; price has not yet broken resistance decisively
Strategy: Prioritise BUY setups, waiting for a pullback to the 50% Fibonacci level
Market Context
Gold continues to hold its bullish momentum and is trading close to the all-time high area around 4350 USD/ounce. Although price has not yet fully broken the upper resistance, the overall bullish structure remains intact.
Gold’s upside is supported by weaker US labour data, expectations that the Fed may cut rates sooner, and rising geopolitical tensions, particularly concerns related to Venezuela ahead of President Trump’s upcoming speech.
With liquidity likely to remain thin due to the holiday period, price action may slow down. However, the primary bias still favours the upside.
H1 Technical Outlook
On the H1 chart, the bullish structure is well preserved. Price is consolidating just below a strong resistance zone, suggesting the market needs more time to absorb selling pressure.
The 50% Fibonacci retracement aligns with a support area that showed a strong reaction yesterday, making it a favourable zone to wait for a pullback and continue trading in line with the trend.
Intraday Trading Scenario
Main Scenario – Trend-following BUY
Entry: 4309 – 4312
SL: 4300
TP: 4330 → 4352 → 4390
Lana prefers to wait for a healthy pullback into this zone before entering, rather than chasing price near resistance.
Trading Notes
Thin liquidity → avoid large position sizes; focus on risk management
If price does not pull back into the planned zone, Lana is comfortable staying flat
Watch price reaction at resistance before expecting a breakout to new highs
Lana’s Note 🌿
Every setup is just one of many possible market scenarios. Lana always defines a clear stop loss and only trades when price reaches the pre-planned zone.

XAUUSD – Overall Market View (12/16) XAUUSD – Overall Market View (12/16)
Strategy Summary
Gold is holding its ground, but the main direction is still unclear because today comes with a series of high-impact news. My approach today is “wait for confirmation before entering”, with two clearly defined scenarios:
Bullish confirmation: Break and hold above 4320
Bearish confirmation: Break and hold below 4271
1) Key Price Levels on the Chart
4320: Bullish confirmation level + resistance / upper FVG zone
4370 – 4373: Strong liquidity zone → preferred area to look for SELL reactions
4271: Bearish confirmation level (support break)
Lower zone (based on structure / trendline): Deeper support area where price may react and bounce, as marked by the arrow on the chart
2) Today’s Trading Scenarios (Trade the Level Style)
Scenario A – Bullish (Only valid if price breaks above 4320)
If an H1 candle closes clearly above 4320, gold is likely to move up and test the upper liquidity zone.
Preferred approach: wait for a pullback and BUY short-term, following the move (as shown by the arrow).
Avoid FOMO buys in the middle of the move.
Reasonable target: 4370 – 4373 (Strong Liquidity).
Note: The 4370 – 4373 zone is highly likely to see selling pressure, as large liquidity is resting there.
Scenario B – Bearish (Confirmed if price breaks below 4271)
If price breaks below 4271 and fails on the retest, the bearish scenario becomes dominant (classic sell retest setup).
✅ Sell: 4271
❌ SL: 4280
🎯 Expectation: Price may extend lower toward deeper structural support zones.
3) Main SELL Setup at the Major Liquidity Zone
✅ Sell Entry: 4370
❌ SL: 4380
Logic: This is a Strong Liquidity zone where profit-taking and distribution are likely to appear.
➡️ Only SELL on confirmation and reaction — no chasing trades.
4) Today’s News (High Volatility Expected)
Today’s US data can cause sharp moves and stop hunts on both sides:
Average Hourly Earnings m/m
Core Retail Sales m/m
Non-Farm Employment Change
Retail Sales m/m
Unemployment Rate
Flash Manufacturing PMI
Flash Services PMI
My rule: Reduce position size before news. After the news, wait for the market to show direction, then trade around 4320 / 4271.
5) Risk Management
Do not enter trades in the middle of a noisy range.
Only trade at key levels with confirmation.
💬 Question for everyone:
Which scenario are you leaning towards today — break above 4320 or break below 4271?

XAUUSD – Lana Prefers SELL, BUY Only for Short-Term ScalpingXAUUSD – Lana Prefers SELL, BUY Only for Short-Term Scalping 💛
Quick Summary
Short-term trend: Downward pressure dominates
Timeframe: H1
Strategy: Focus on SELL; BUY only for quick scalping at liquidity zones
Note: Today features multiple US data releases and events, so volatility may be higher than usual
Market Context
The market enters the session with a dense news flow: US Presidential speech, unemployment rate, seasonally adjusted Non-Farm Payrolls, and Retail Sales.
In such conditions, gold often experiences strong swings and liquidity sweeps before moving in the main direction. Therefore, Lana prioritizes selling at higher zones and only takes short-term BUY positions when price reaches clear support zones.
Technical Outlook
After the previous upward move, the H1 structure shows weakening price action, indicating the possibility of a continued downward move.
Upper zones where short-term resistance converges are suitable for following the intraday SELL trend. Below, liquidity zones may trigger temporary rebounds, but Lana considers these only for scalping and does not hold positions for long.
Intraday Trading Scenarios
Main Scenario – Trend-Following SELL
Sell: 4308 – 4312
SL: 4320
This is Lana’s preferred zone today. If price retraces into this area and shows rejection, the downtrend is likely to continue.
Buy Scenario 1 – Short-Term Scalping at Nearby Support
Buy: 4253
SL: 4240
This BUY is only for short swings, with quick profit-taking when price reacts.
Buy Scenario 2 – Scalping at Deep Liquidity Zone
Buy: 4213
SL: 4200
This is a stronger liquidity zone. If price drops quickly here during news, a technical rebound is possible, but Lana maintains the view not to hold BUY positions for long.
Session Notes
Asian & European sessions: Price may fluctuate and create technical retracements
US session: Strong news-driven volatility can sweep both sides before a clear direction emerges
Each scenario represents a probability, not certainty.
On high-news days, Lana always reduces position size, sets clear SLs, and is willing to skip trades if price does not reach the expected zones.

XAUUSD H1 – POC 4295 & Fibonacci Sell 4373 XAUUSD H1 – POC 4295 & Fibonacci Sell 4373
Strategy Summary
Today, I am not chasing price. The XAUUSD trading plan focuses on two key “high-quality” zones on the chart:
POC (Volume Profile) around 4295 to look for BUYs in line with money flow.
Fibonacci level at 4373 to look for SELLs when price reaches the premium zone.
Key Levels
BUY zone (POC – Volume Profile): 4295 (major liquidity area)
SELL zone (Fibonacci reaction): 4373
Deeper buffer if POC breaks: 4238 – 4241
Invalidation level: 4191
Scenario 1 – Primary Plan: BUY at the Liquidity Zone (POC)
✅ Buy limit around 4295 (preferably wait for H1 candle confirmation)
SL: 4287 (below POC to avoid noise)
TP1: 4330 – 4338
TP2: 4370 – 4373 (near the Fibonacci sell zone)
Logic:
POC represents the “fair value” or balance point of the Volume Profile. Price often gets attracted back to this level to collect liquidity before deciding the next direction.
Scenario 2 – SELL on Reaction at Fibonacci (Premium Zone)
✅ Sell around 4373 (wait for reaction or loss of momentum, do not chase sells)
SL: 4382
TP1: 4338 – 4330
TP2: 4295 (back to POC)
Logic:
The Fibonacci premium zone is where profit-taking pressure often appears. If price spikes into 4373 but fails to hold, it usually offers a clean reaction sell setup.
Alternative Scenario – If POC Is Broken
If price breaks below 4295 and clearly closes an H1 candle under this level, I will not force buys. In that case, priority shifts to waiting for price to react at:
4238 – 4241, or
deeper towards the lower balance / POC zone.
Always keep in mind: 4191 is the invalidation level.
News Context (to Avoid Getting Stopped Out)
Trump’s concerns about economic impact “not fully priced in yet” may increase political risk and market sensitivity.
Comments from Williams (FOMC, New York Fed) on economic outlook could trigger short-term volatility in USD and yields, causing gold to fluctuate.
Tip: Avoid late entries during news spikes. Only execute trades when price reaches the planned zones.
Risk Management
Maximum risk per trade: 1–2%
Do not trade in the middle of the range. Trade only at key levels.
If you are also watching 4295 and 4373, share your view:
👉 Are you leaning towards a BUY on pullback or a SELL on reaction today?

XAUUSD – Lana waits for reaction at resistance, focuses on ...XAUUSD – Lana waits for reaction at resistance, focuses on zone-based trading
Quick Summary
Context: Early in the week with many high-impact news events. Gold opened strong and is now approaching a major resistance area.
Timeframe: H1
Strategy: No chasing price. Prefer waiting to buy at liquidity void (VL) zones and selling short-term pullbacks at higher resistance.
Expectation: Asian–European sessions may move sideways; stronger volatility is more likely during the US session.
Market Context
The year-end period is usually packed with economic data. This week, Nonfarm Payrolls, CPI, and Retail Sales are released close together, along with interest rate decisions from the UK, Europe, and Japan.
For gold, this environment often leads to sharp moves during the US session, while earlier sessions tend to consolidate or make shallow pullbacks as the market waits for news.
Technical View
After a strong rally at the start of the week, price is now trading around a key resistance zone. On H1, the price action at the Asian open has left a liquidity void (VL), which is Lana’s preferred area to wait for buy opportunities in line with the main trend.
On the upside, a descending trendline combined with Fibonacci extension levels is forming a strong resistance zone, suitable for a short-term corrective sell.
Trading Scenarios for Early Week
Main Scenario – Buy at the liquidity void (VL)
Buy: 4298 – 4302
SL: 4294
This is Lana’s preferred zone. If price returns to fill the liquidity void and the structure holds, there is a high probability of a bullish reaction in continuation of the broader trend.
Alternative Scenario – Short-term sell at higher resistance
Sell: 4367 – 4370
SL: 4376
This is considered a short-term corrective move when price reaches strong resistance. The sell is counter-trend, so strict risk management is required and positions should not be held for too long.

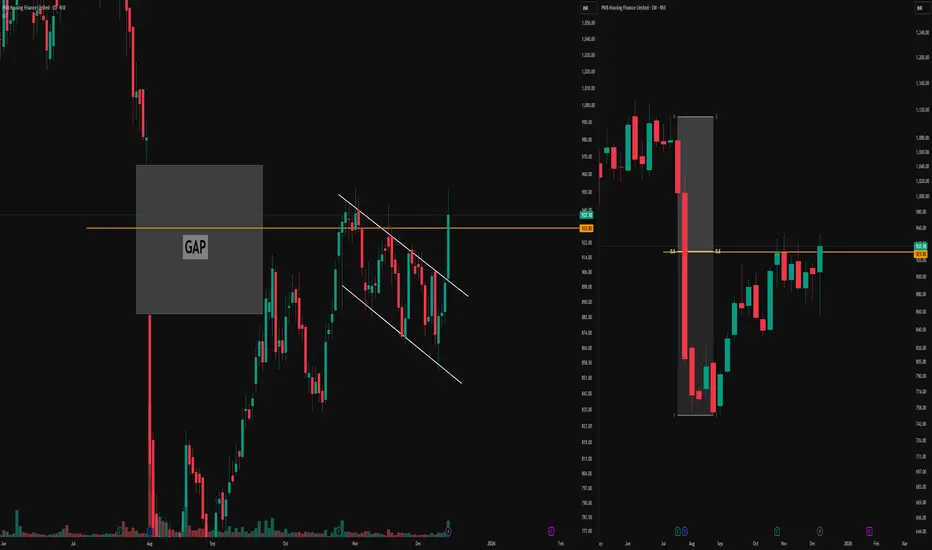
Parallel Channel, Stubborn Gap & 0.5 Equilibrium RejectionDaily Timeframe Details
The left chart on the daily timeframe displays a parallel channel structure forming after an initial one-sided move.
A significant gap emerged within this leg, which price has approached multiple times—first entering the gap area from below but rejecting sharply to form a higher low, then pushing toward a higher high without fully filling it.
This illustrates how gaps often resist easy fills from either direction, acting as persistent reference zones that demand confluence for interaction.
Weekly Timeframe Context
The right chart provides the weekly timeframe for the same instrument, highlighting repeated rejections at the 0.5 equilibrium level.
These weekly rejections align precisely with the daily gap interactions and channel boundaries, demonstrating how higher-timeframe equilibrium can underpin lower-timeframe price behavior without implying direction.
Such multi-timeframe alignment offers educational insight into structural references in market analysis.
This post serves purely educational and observational purposes and does not constitute buy, sell, or investment advice. Always conduct your own research.
XAUUSD Trend holds wait to re buy on pullbackXAUUSD (H1) — Trend intact, waiting for pullback to re-buy at the right zones
Strategy Summary
Price continues to move in line with the bullish plan. Two buy entries were already captured, with price advancing around ~5 points. At this stage, the priority is not to chase price, but to wait for pullbacks into reaction zones to re-enter in the direction of the trend.
1) Trading Plan (H1)
✅ Buy Zone 1: 4262 – 4258
SL: 4250
Meaning: A shallow pullback zone. If price holds the bullish structure and reacts higher here, trend-following buys are preferred.
✅ Buy Zone 2: 4240 – 4235
SL: 4238
Meaning: A deeper pullback (better discount). If price sweeps this area and shows strong confirmation, this becomes a higher-quality buy zone.
Projected Targets (based on chart):
Near resistance: 4285
Extended target: 4304 – 4307
2) Fundamental / News to Watch
The Fed releases US household financial conditions data (Capital Flow Report Q3/2025).
Voting FOMC members & Philadelphia Fed President Paulson speak on the 2026 economic outlook.
The US threatens expanded seizures of Venezuelan oil tankers → geopolitical and energy supply risks may increase volatility, with gold prone to sharp spikes.
3) Technical & Behavioural View
Market structure remains bullish. After a strong impulse, a pullback is healthy before continuation.
Plan remains clear: buy only at predefined zones, no FOMO.
If price breaks below zones and closes H1 candles under SL levels, staying flat and waiting for a new structure is preferred.

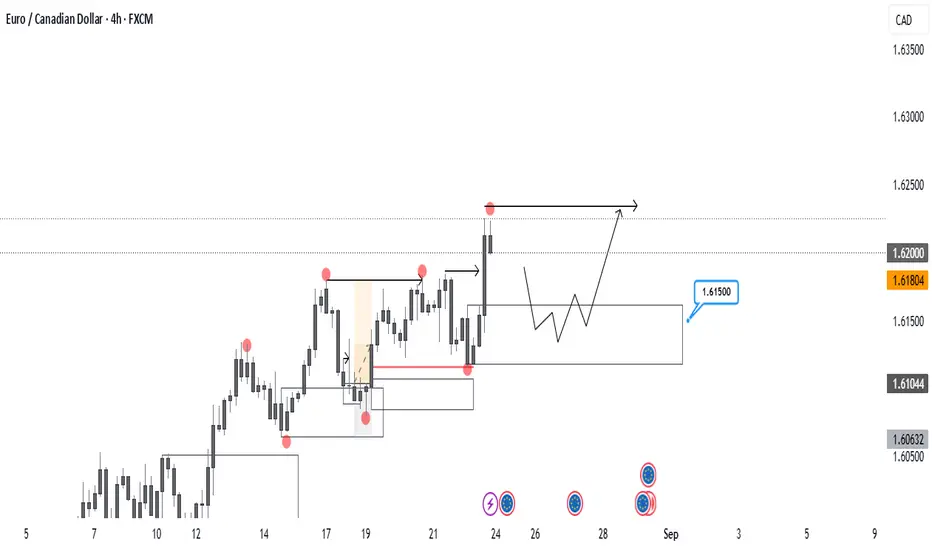
EURCAD - CONTINUATION TRADEThe pair is in a clear uptrend, consistently forming higher highs and higher lows. I’m waiting for a healthy pullback into the demand zone, where I’ll look for confirmation to enter long position. Setup remains solid as long as structure is maintained. If in any case price drop below the demand zone, that will indicate shift in a structure.
HOW TO WATCHLIST TABLE-VIEW TOOL IN TRADINGVIEWComplete Process: HOW TO WATCHLIST TABLE-VIEW TOOL IN TRADINGVIEW
1️⃣ Open the Watchlist Panel
➺ The Watchlist panel is located on the right side of the Trading-View interface.
➺ If it is hidden, click the small arrow on the right edge to open it.
2️⃣ Locate the Table-View Tool
➺ At the top of the watchlist panel, you will see three dot icon.
➺ This icon opens the table-view tool inside the watchlist.
3️⃣ Open the Table-View
Step-by-step:
➺ Click the table icon at the bottom of the watchlist.
➺ The watchlist will switch from the normal list-view to the table-view layout.
4️⃣ Understanding the Table-View Layout
The table-view displays additional columns and organized data in a tabular format.
Typical columns include:
⤷ Symbol
⤷ Last Price
⤷ Change (%)
⤷ Volume
⤷ High / Low
⤷ Session Data
⤷ Custom fields (depending on settings)
The table-view allows users to compare multiple symbols more clearly.
5️⃣ How to Add Columns in Table-View
Step-by-step:
➺ Hover on the column header area.
➺ Click the plus (+) icon or “Add Column” option.
➺ Choose the data you want to add:
⤷ Price
⤷ Change
⤷ Bid / Ask
⤷ Volume
⤷ Open Interest
⤷ Fundamentals (if supported)
⤷ Other available fields
The selected column will appear immediately.
6️⃣ How to Remove Columns
Step-by-step:
➺ Hover over the column header you want to remove.
➺ Click the three-dot menu (⋮) on that column.
➺ Select “Remove Column”.
➺ The column will be removed from the table.
7️⃣ How to Reorder Columns
Step-by-step:
➺ Click and hold the column header.
➺ Drag it left or right.
➺ Release to place it in the new position.
This helps personalize the table layout.
8️⃣ Sorting Symbols in Table-View
Step-by-step:
➺ Click any column name (for example: Price, Change %, Volume).
➺ Clicking once sorts the column ascending.
➺ Clicking again sorts descending.
➺ A small arrow appears showing the sort direction.
9️⃣ Switch Back to Normal Watchlist View
Step-by-step:
➺ Click the same table icon at the bottom again.
➺ The watchlist returns to the default list-view.
🎯 Short Summary (Optional for Captions)
⤷ Open Table-View → Bottom table icon
⤷ Add Columns → Add Column option
⤷ Remove Columns → Three-dot menu → Remove
⤷ Reorder → Drag column headers
⤷ Sort → Click column name
⤷ Return to List → Click table icon again

HOW TO WATCHLIST MAKE A COPY & CLEAR LIST✅ Complete Process: HOW TO WATCHLIST MAKE A COPY & CLEAR LIST (Trading-View)
1️⃣ Open the Watchlist Panel
➣ The Watchlist panel is located on the right side of the Trading-View interface.
➣ If it is hidden, click the small arrow on the edge to open it.
2️⃣ Open Watchlist Options Menu
➣ At the top of the watchlist, click the three-dot menu (⋮).
➣ This menu contains all the main watchlist management options.
3️⃣ How to Make a Copy of a Watchlist
Step-by-step:
➣ In the three-dot menu, select “Make a Copy”.
➣ A duplicate copy of the current watchlist will be created.
➣ The copied watchlist will appear in the watchlist dropdown list.
➣ You can rename the copied watchlist by:
⤷ Opening the dropdown → clicking Rename → typing the new name → pressing Enter.
This is useful when you want to create variations of the same watchlist.
4️⃣ How to Clear a Watchlist
Step-by-step:
➣ Open the three-dot menu (⋮) at the top of the watchlist.
➣ Select “Clear List”.
➣ Trading-View may ask for confirmation.
➣ Once confirmed, all symbols inside the watchlist will be removed, but the watchlist itself
remains.
This is helpful when you want to reset or start the watchlist fresh.
5️⃣ Switch Between Watchlists
(Useful after creating a copy)
➣ Click the watchlist name at the top.
➣ A dropdown will appear with all available watchlists.
➣ Select the watchlist you want to view or edit.
🎯 Short Summary (Optional for captions)
➣ Make a Copy → Menu → Make a Copy → Rename if needed
➣ Clear List → Menu → Clear List → Confirm
➣ Switch Watchlists → Dropdown → Select List

Lets Create and Backtest a Simple Strategy from literally ZeroI make educational content videos for swing / positional trading .
In this video I will be using 3 months old chart along with one example of how to approach any trade or price action with literally zero lines and zones on screen .

HOW TO WATCHLIST ADD & DELETE SYMBOL OR SECTION IN TRADINGVIEW1️⃣ Open the Watchlist Panel
-->The Watchlist panel appears on the right side of the Trading-View interface.
-->If it is hidden, click the small arrow on the right edge to open it.
2️⃣ Add a Symbol to the Watchlist
Step-by-step:
1. Go to the Search Bar at the top of the watchlist.
2. Type the name or ticker of the symbol you want to add.
3. Click on the symbol from the search results.
4. The symbol will be added to your watchlist immediately.
3️⃣ Delete a Symbol from the Watchlist
Step-by-step:
1. Hover your cursor over the symbol you want to remove.
2. Click the ‘X’ icon or Delete icon that appears.
3. The symbol will be removed from the watchlist.
4️⃣ Add a New Section in the Watchlist
Step-by-step:
1. Right-click anywhere inside the watchlist panel.
2. Select “Add Section” from the menu.
3. A new blank section will be created.
4. To rename it:
-->Double-click on the section name → type the new name → press Enter.
5️⃣ Delete a Section from the Watchlist
Step-by-step:
1. Right-click on the section name you want to delete.
2. Select “Delete Section”.
3. Trading-View may ask for confirmation.
4. The entire section and all symbols inside it will be deleted.
6️⃣ Move Symbols Between Sections
(Useful for keeping the watchlist organized)
1. Click and hold the symbol you want to move.
2. Drag it to another section.
3. Release to drop it into the new section.
🎯 Short Summary (Optional for Captions)
--> Add Symbol → Search → Click
--> Delete Symbol → Hover → Click ‘X’
--> Add Section → Right-click → Add Section
--> Delete Section → Right-click → Delete Section
--> Move Symbols → Drag & Drop

Tight Bullish Coil Above 50% EQ Means what ? Points to be Noted :
-Clear monthly swing low and swing high marked, defining the impulsive leg and its equilibrium zone. ( S1 and S2 )
-Price is consolidating in the upper half of this leg, holding above the 0.5 equilibrium level, showing sustained strength in the higher value area. ( also know as EQ )
-A clean ascending trendline (green) is guiding price from the swing low, with candles respecting it as dynamic support during the pause.
-Within this broader bullish structure, price has formed a tight parallel channel consolidation, indicating controlled pullback rather than distribution. ( white lines marked )
-Nearest major supply aligns with the all-time high, and the highlighted supply box marks the key decision zone where breakout or rejection is most likely.( orange box )
This post is for educational purposes only and is not investment, trading, or financial advice. Always do your own research, assess your risk tolerance, and consult a qualified financial advisor before making any trading decisions.

How to Understand Trading-view InterfaceWe provide Trading-view interface in a short way in this video introduction on Trading-view interface.
This video provides a clear and structured walkthrough of the Trading-View interface. It covers chart layout, drawing tools, timeframes, market watchlist in a simple and organized manner to help users understand the platform more effectively.

Adani Ports & Special Economic Zone LtdCurrent price shown: ₹1,450.50, up ₹7.40 (+0.51%).
The chart displays a strong uptrend from late August onward.
A rising trendline (blue, upward-sloping) supports the price from the lows of September through November.
Price has recently pulled back slightly but is still near the upper resistance zone.
Major resistance zone highlighted: around ₹1,515–₹1,530.
Support level marked near ₹1,467–₹1,480 (shaded lower red area).
The price is currently trading close to resistance.
Volume bars at the bottom show moderate trading activity, with occasional spikes.
No abnormal volume at the latest price area.

Always check the Higher Time frame but WHY ?I make educational content videos and Posts for Swing Trading based ideas - concepts and my full time trading experience .

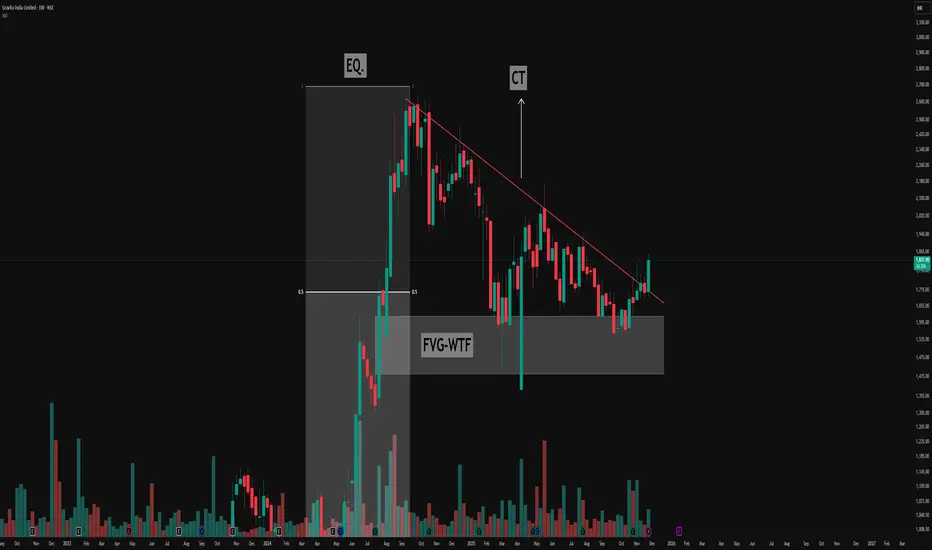
Decoding the Descending Triangle: Key Structure & FVG🔻Understanding the Pattern
- The chart above highlights a classic descending triangle pattern, easily visible by its series of lower highs (marked in red) and a relatively consistent demand zone acting as support.
- This resistance trendline (CT—Contraction Trendline) has been tested multiple times, confirming its significance as sellers consistently respond to price rallies by pushing back from lower levels.
🔻Equilibrium and Price Exploration
- Notice how price action moves from the equilibrium zone (EQ.)—the midpoint of the major move (from lows to all-time highs). This is a key area where supply and demand often rebalance
- The triangle structure forms as buyers continue to find value at support, while sellers become increasingly aggressive at lower highs, compressing price action over time.
🔻Weekly Fair Value Gap (FVG) in Focus
- A prominent Weekly Fair Value Gap (FVG-WTF) is identified, which price has tapped multiple times. This repeated interaction demonstrates its importance as a liquidity pocket where imbalances are re-tested and absorbed.
- Each revisit to this FVG offers a valuable lesson on how strong institutional levels serve as magnets, attracting price to resolve open liquidity.
This post is for educational purposes, highlighting how price structures can be interpreted without suggesting any forecast or trade.
Gold Reaches Exhaustion Zone — Sell Momentum LoadingGold Reaches Exhaustion Zone — Sell Momentum Loading
Gold is showing signs of upside exhaustion, with price repeatedly failing to gain momentum as it approaches the mid-range premium zone near the 4,245 area. The recent structure reflects a market transitioning from short-term recovery into renewed weakness, with each bullish attempt losing strength faster than the previous one.
Order flow remains dominated by distribution behaviour, and the chart signals a potential liquidity sweep followed by a bearish continuation. The projected rejection zone suggests that buyers are running into an area of heavy supply, where institutional activity has previously triggered aggressive downside extensions. Volume distribution across the range also highlights diminishing demand at higher prices, reinforcing the likelihood of a downward rotation.
As the market continues to respect its broader range ceiling, the probability increases for price to revisit deeper value regions. With momentum fading and the current leg showing hesitation, gold is positioned for a potential sell-side move toward lower mean-reversion levels.

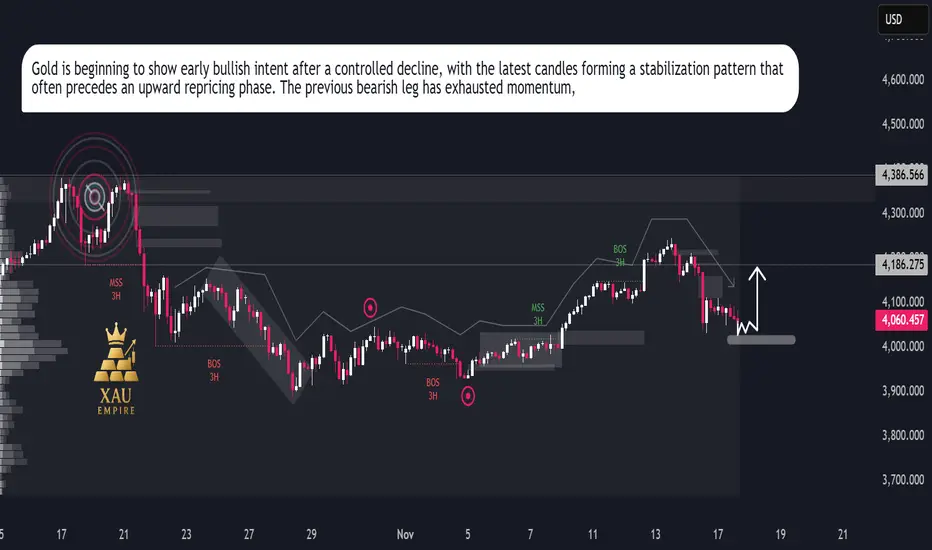
XAUUSD Repricing MoveXAUUSD Repricing Move
Gold continues to trade inside a broader corrective cycle, with price action showing a clear transition from prior strength into a short-term distribution phase. The chart highlights repeated breaks in market structure and shifts in order flow, signalling a controlled decline built on institutional rebalancing.
After the recent downside sweep, price is now hovering around a key reaction zone where liquidity has already been absorbed. Sellers dominated the previous swing, but the latest candles show a slowdown in bearish momentum, indicating that the market may be preparing for a corrective repricing attempt.
The volume footprint on the left side of the chart reflects previous heavy activity from major participants, and the current area sits beneath an inefficiency pocket that remains unmitigated. This opens the door for a short-term bullish rotation if buyers defend this accumulation region. The marked arrow in your chart aligns with a potential internal shift where gold could attempt a short retracement toward the mid-range of the prior move.
Momentum indicators embedded in the structure show reduced volatility, meaning the market may be positioning itself for a liquidity-driven bounce rather than continuing straight lower. The next sessions will reveal whether this zone becomes a launch point for a recovery leg or if the broader trend resumes its downward trajectory.