FED dovish, Gold stays bullish; SELL only for scalps⚓️ Captain Vincent – Gold Plan XAU/USD
1. Market Wave 🌍
The probability of a FED rate cut in September surged to 96.6% (vs 90.4% earlier) after the JOLTS report showed weakening job prospects.
Several FED officials, from Kashkari to Bostic, shifted dovish. Only Musallim maintained a hawkish stance with a scenario of just one cut.
👉 Result: Capital flows returned to Gold as the No.1 safe haven, pushing prices strongly higher overnight.
📌 Key data today (04/09 – US time):
ADP Nonfarm (7:15)
Jobless Claims (7:30)
ISM Services PMI (9:00)
➡️ This trio of data will be crucial catalysts for GOLD volatility.
2. Technical Analysis ⚙️
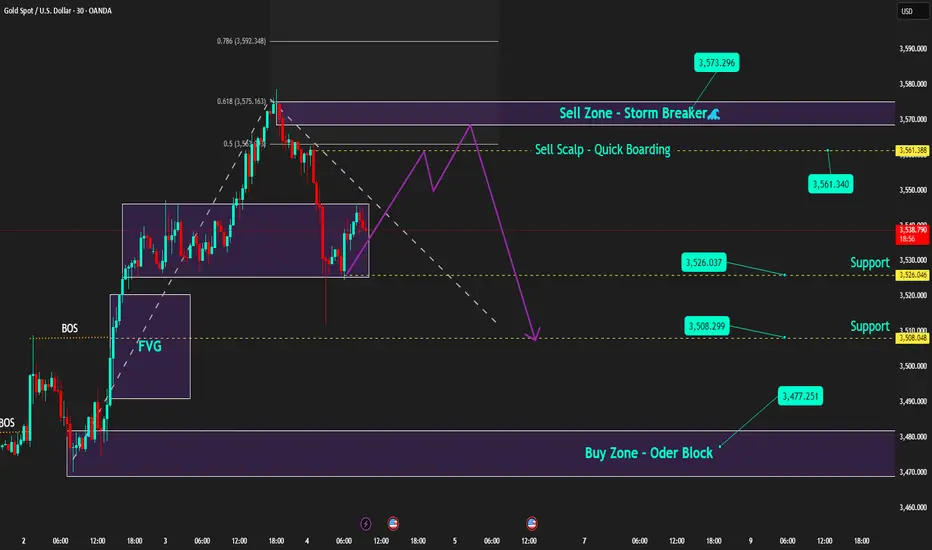
On M30/H1, Gold continues to form bullish BOS, keeping the main trend upward.
Golden Harbor 🏝️ (Buy Zone 3,477 – 3,479): Old Order Block, strong support if price pulls back.
Quick Boarding 🚤 (Sell Scalp 3,561 – 3,563): Only for short-term scalps.
Storm Breaker 🌊 (Sell Zone 3,573 – 3,575): Aligned with Fibo 0.618–0.786, strong resistance with potential selling pressure.
Captain’s Shield 🛡️ (Support): 3,526 – 3,515 – 3,508
3. Captain Vincent’s Map – Trade Scenarios 🪙
🔺 Golden Harbor 🏝️ (BUY – Priority)
Entry: 3,477 – 3,479
SL: 3,470
TP: 3,480 → 3,483 → 3,486 → 3,491 → 349x → 35xx
🚤 Quick Boarding (SELL Scalp – Short Ride)
Entry: 3,561 – 3,563
SL: 3,569
TP: 3,558 → 3,555 → 3,552 → 354x
🌊 Storm Breaker (SELL Zone – Strong Resistance)
Entry: 3,573 – 3,575
SL: 3,581
TP: 3,570 → 3,565 → 3,560 → 3,555 → 35xx
4. Captain’s Note ⚓
"The golden sail is filled with wind as the FED turns dovish. Golden Harbor 🏝️ (3477) remains the safe haven to align with the bullish trend. SELLs are just Quick Boarding 🚤 scalps at Storm Breaker 🌊 , not long voyages."
Tradingview
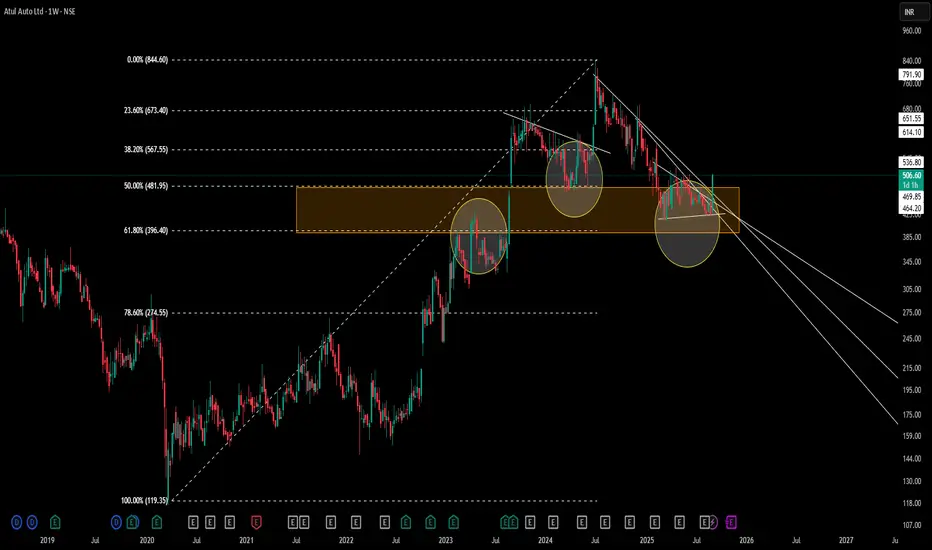
Atul Auto | MTF Fibonacci Confluence structuresWeekly Chart Analysis
– Drew a multi-timeframe Fibonacci from the 119.35 low (Mar ’20) to the 844.60 high (Oct ’24) on the Monthly time frame .
– Highlighted the 50–61.8% retracement zone (481.95–396.40) as an orange supply/demand area.
– Circles mark historical pivots where price reacted as support or resistance within this zone.
Key Observations
-Price consistently respected the 50–61.8% band during prior rallies and pullbacks.
-Recent price action formed a contracting triangle (CT) at the lower edge of the Fibonacci zone.
-Volume contraction noted inside the triangle, suggesting supply–demand equilibrium.
Disclaimer: This analysis is provided for educational and informational purposes only and does not constitute financial advice. Trading involves risk, and you should perform your own research and consider your risk tolerance before making any trading decisions.
Multi-Confirmation Price Action: Fibonacci Zones, Base BreakoutsExplore multi-confirmation techniques using Fibonacci retracement to identify high-probability base breakout zones. Learn how to spot double bottom and inverted head & shoulders patterns at demand levels and execute confirmation trades for precision entries

Gold consolidates as new alliances emerge | Captain Vincent 1. News Wave 🌍
At the two-day summit in Shanghai, Prime Minister Modi and President Xi Jinping announced that India and China will become development partners rather than competitors.
The meeting also included Russia and four Central Asian nations, aiming to form a Southern Hemisphere bloc to counterbalance the US and the West.
👉 This signals a shift in geopolitical power, heightening concerns of global polarization → Gold continues to hold its safe-haven position.
2. Technical Analysis ⚙️
On the H2 chart, Gold has formed a Higher High after the recent strong breakout.
Storm Breaker 🌊 (Sell Zone 3511 – 3518): Strong resistance, potential for supply if price retests.
Golden Harbor 🏝️ (Buy Zone 3450 – 3448): Confluence with FVG + Fibonacci 0.5/0.618, a key support for pullback entries.
Main Trend: Gold likely to move sideways between 3450 – 3510 before choosing a major direction.
3. Captain Vincent’s Map – Trade Scenarios 🪙
🔻 Storm Breaker 🌊 (SELL Reaction)
Entry: 3511 – 3508
SL: 3518
TP: 3505 → 3500 → 3497 → 349x → 348x
🏝️ Golden Harbor (BUY Zone – Strong Support)
Entry: 3450 – 3448
SL: 3440
TP: 3453 → 3456 → 3459 → 3462 → 346x
4. Captain’s Note ⚓
"Political news continues to stir the golden sea 🌊. Bears are waiting at Storm Breaker 3511, but the safe harbor remains Golden Harbor 3450 – 3448. In such unpredictable waters, prioritise short-term sells to flow with safe-haven demand, rather than recklessly facing the storm."

Captain Vincent | Gold holds 3400, breakout or pullback next?” FED turns dovish, Gold challenges a new Storm Breaker
1. News Wave 🌍
FED – Waller: “Tariffs are a kind of tax and do not increase inflation. I’m back with the ‘transitory team’ on inflation.”
👉 A clear dovish hint supporting a 25bps rate cut in September, with potential for 1–2 more cuts in the next 3–6 months.
US Senate: Hearing scheduled on Sept 4th for FED nominee S. Miran → Political–monetary spotlight.
Tonight: Market awaits PCE data, FED’s preferred inflation measure.
➡️ Summary: FED leaning dovish = mid-term bullish for Gold.
But short-term, Gold faces profit-taking pressure near resistance.
2. Technical Outlook ⚙️
On H1, Gold has repeatedly formed bullish BOS and crossed above 3,400.
Golden Harbor 🏝️ (Buy Zone 3375 – 3373): Large volume accumulation, aligned with FVG → Attractive entry if price pulls back.
Storm Breaker 🌊 (Sell Zone 3432 – 343x): At old ATH zone, high probability of supply pressure if tested.
Key Levels:
3,375 → Critical support “anchor”.
3,438 → Resistance target if bullish momentum continues.
3. Captain Vincent’s Map – Trade Scenarios 🪙
🔺 Golden Harbor 🏝️ (BUY Zone – Priority)
Entry: 3375 – 3373
SL: 3365
TP: 3378 → 3381 → 3384 → 3387 → 33xx
🔻 Storm Breaker 🌊 (SELL Zone – Old ATH Reaction)
Entry: 3432 – 343x
SL: 3442
TP: 3428 → 3425 → 3423 → 3420 → 33xx
4. Captain’s Note ⚓
"The Gold ship has sailed past 3400, but Storm Breaker 🌊 at 343x remains a tough challenge. If corrective waves appear, patiently wait at Golden Harbor 🏝️ to board for a more bullish September journey."

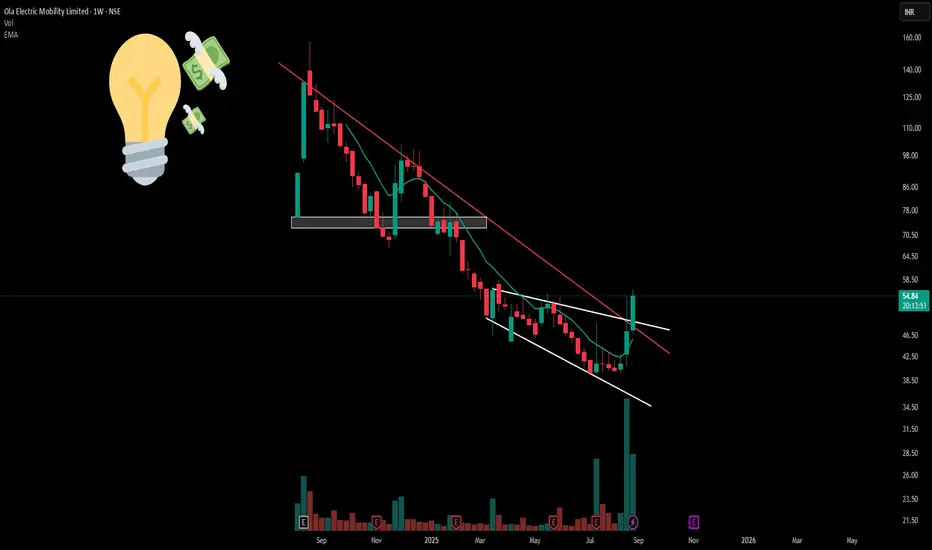
OLA : Simple Channels and Exceptional Volume PatternsOla Electric (NSE: OLAELEC) displays a descending channel pattern with the red resistance trendline providing consistent overhead resistance. The stock has operated within this falling channel structure since peak levels, creating defined technical boundaries.
A broadening formation is evident through white trendlines showing expanding volatility ranges.
Exceptional volume expansion compared to historical averages. Combined NSE+BSE volumes substantially exceed normal ranges, indicating institutional participation rather than retail activity.
Disclaimer: Educational content only. Not investment advice. Trading involves substantial risk. Technical patterns don't guarantee outcomes. Consult qualified advisors before investing.
Gold Plan (28/08) – Ahead of 3,400: Breakout or Correction to ??XAU/USD – Gold hits Storm Breaker 3400: Accumulation before breaking ATH?
1. Market Wave 🌍
Throughout last week, Gold continuously formed BOS (Break of Structure) , confirming that buyers remain in control.
Currently, price is consolidating around 3,394 – 3,400, right at the Storm Breaker 🌊 , the crucial barrier before heading towards the old ATH at 3,424.
The key question: Will Gold accumulate here and smash through ATH, or will it need a pullback to safe harbors before a strong rally in September?
2. Technical Analysis ⚙️
Storm Breaker 🌊 (Strong Resistance): 3400 – 3424 (old ATH). The gateway Gold must conquer to open a new bullish leg.
Golden Harbor 🏝️ (Key Support): 3375 – 3355 – 3330. Confluence with FVG + Fibonacci 0.5/0.618 , likely to attract liquidity if price corrects.
Short-term scenario: Price may pull back to Golden Harbor before breaking higher.
3. Captain Vincent’s Map – Trade Scenarios 🪙
🔺 Quick Boarding 🚤 (BUY Scalp – Rebound Priority)
Entry: 3353 – 3355
SL: 3349
TP: 3356 → 3359 → 3361 → 33xx
🔻 Storm Breaker 🌊 (SELL Reaction – Old ATH)
Entry: 3422 – 3424 (if tested)
SL: 3430
TP: 3419 → 3415 → 3410 → 3405 → 33xx
4. Captain’s Note ⚓
"The Gold ship is now pressing against Storm Breaker 🌊 3400 – 3424 . If it breaks through, the vast ocean opens a new trend. But if the waves push back, patiently wait at Golden Harbor 🏝️ to anchor and catch the September tide."

Gold Plan 27/08 – Captain Vincent (IN)XAU/USD – Trump strengthens control over the FED, Gold consolidates near Storm Breaker
1. News Wave 🌍
Trump: “We will soon have majority control at the FED. Miran may be moved to another position with a longer term.”
Trump: “I already have a candidate in mind to replace FED Governor L. Cook.”
US Senate: Preparing hearings next week for Trump’s nominee – S. Miran .
👉 Message: Trump is consolidating power within the FED. Market fears FED losing independence → USD volatility rises, Gold benefits from safe-haven flows .
2. Technical Outlook ⚙️
Gold is approaching Storm Breaker 🌊 (3400 – 3402) , overlapping with resistance 3392 – 3406 → profit-taking likely .
On H1, multiple FVGs remain unfilled around 3355 & 3330 → Price may correct to retest these supports before choosing direction.
Intraday bias: Range-bound → Sell at resistance, short Buy at supports.
3. Captain Vincent’s Map – Key Levels 🪙
Resistance (Kháng cự):
3406 – 3400 – 3392 (Storm Breaker 🌊)
Support (Hỗ trợ):
3372 (Minor Shield 🛡️)
3355 (Quick Boarding 🚤 – Buy Scalp Zone)
3344 (Intermediate Shield 🛡️)
3330 (Golden Harbor 🏝️ – Main Buy Zone)
4. Trade Scenarios 📌
🔻 SELL at Storm Breaker 🌊 (Priority)
Entry: 3400 – 3402
SL: 3408
TP: 3395 → 3393 → 3389 → 3386 → 33xx
🚤 BUY Scalp – Quick Boarding
Entry: 3353 – 3355
SL: 3345
TP: 3358 → 3361 → 3363 → 33xx
🏝️ BUY at Golden Harbor (Strong Support)
Entry: 3330 – 3332
SL: 3325
TP: 3335 → 3338 → 3341 → 33xx
5. Captain’s Note ⚓
"Gold today faces Storm Breaker 🌊 above, but multiple shields of support remain below. Smart traders will scalp quickly at Quick Boarding 🚤, or patiently wait for Golden Harbor 🏝️ to anchor safely."

ECLERX SKYROCKETS 35%! This Pattern Signals ₹4,200 TargetNSE:ECLERX SKYROCKETS 35%, Made a Beautiful Chart Structure to Qualify for the Chart of the Week
Price Action:
- It experienced a powerful rally from ₹2,200 to ₹3,877 (all-time high) between July and October 2024
- Recent correction formed a descending wedge pattern from October 2024 to early May 2025
- Currently showing an explosive breakout at ₹3,301.80, up ₹852.40 (+34.80%) in this Week.
- Massive single-week gain with a long bullish candle breaking above both resistance levels and the downtrend line
- The weekly chart shows a strong V-shaped recovery from support
Volume Analysis:
- This Week's volume at 2.28M shares vs. average of 420.79K (over 5x normal volume)
- Previous support bounces have also witnessed above-average volume
- Extremely high volume on today's breakout suggests significant institutional participation
- Volume pattern confirms the legitimacy of the price action
Key Support and Resistance:
- Strong support zone at ₹2,200-2,300 (green horizontal box) - tested and held multiple times over the past year
- Previous resistance now likely support at ₹3,200-3,250 (green horizontal line)
- Next resistance at all-time high of ₹3,877 (marked as "High")
- Downtrend line (white diagonal) now broken with conviction
Technical Patterns:
1. Descending Wedge Breakout- Classic bullish reversal pattern completed this week
2. Double Bottom*- Formed at ₹2,300 level in March-May 2025
3. Support Retest- Successfully retested the major support zone before the breakout
4. V-Shaped Recovery - Strong reversal indicating powerful buying interest
Trade Setup:
- Pattern: Descending wedge breakout with volume confirmation
- Confirmation: Explosive price action and volume expansion
- Context: Bullish reversal after testing major support zone
Entry Points:
1. Aggressive Entry: Current price (₹3,301.80) with partial position
2. Pullback Entry: On retest of breakout level ₹2,900-3,000
3. Confirmation Entry: On consolidation and holding above ₹3,200 for 2-3 sessions
Exit Strategy:
- Target 1: ₹3,600 (psychological resistance)
- Target 2: ₹3,877 (previous all-time high)
- Target 3: ₹4,200 (pattern projection based on measured move)
- Trailing Stop: 7% trailing stop after Target 1 is achieved
Stop Loss Placement:
- Aggressive Stop: ₹2,950 (below recent swing low)
- Conservative Stop: ₹2,800 (near the breakout point of the wedge)
- Pattern-Based Stop: ₹2,500 (invalidation level for the pattern)
Risk Management:
- Position sizing: Limit risk to 1-2% of trading capital
- Risk-reward ratio: Minimum 1:1.5 for aggressive entry, 1:2 for pullback entry
- Consider scaling approach:
* Enter 50% position now
* Add 25% on confirmation of trend (holding above ₹3,200)
* Add 25% on pullback (if it occurs)
- Take partial profits: 30% at Target 1, 30% at Target 2, hold remainder with trailing stop
NSE:ECLERX shows a powerful technical setup with its powerful breakout from a descending wedge pattern on record volume. The price action respects key technical levels, with the stock holding major support at ₹2,200-2,300 before staging today's massive rally. The breakout above both the wedge pattern and horizontal resistance, with 5x normal volume, suggests potential for continued upside momentum toward previous highs and beyond.
Keep in the Watchlist.
NO RECO. For Buy/Sell.
📌Thank you for exploring my idea! I hope you found it valuable.
🙏FOLLOW for more
👍BOOST if you found it useful.
✍️COMMENT below with your views.
Meanwhile, check out my other stock ideas on the right side until this trade is activated. I would love your feedback.
Disclaimer: "I am not a SEBI REGISTERED RESEARCH ANALYST AND INVESTMENT ADVISER."
This analysis is intended solely for informational and educational purposes and should not be interpreted as financial advice. It is advisable to consult a qualified financial advisor or conduct thorough research before making investment decisions.

Gold Plan 26/08 – Captain VincentXAU/USD – Trump’s surprise move sparks a Gold rally. What’s the next scenario?
1. News Wave 🌍
Trump unexpectedly dismissed FED Governor L. Cook , citing “irresponsible recent financial decisions.”
👉 A political–monetary shock that pushed Gold up by more than 30 points from the 3,350 – 3,352 zone, as investors feared internal instability at the FED could weaken the USD.
Safe-haven demand has been activated, but Gold is unlikely to “fly in a straight line.” The market often requires a pullback to fill liquidity gaps before a clear trend develops.
2. Technical Outlook ⚙️
Price bounced sharply from Golden Harbor 🏝️ (Buy Zone 3350 – 3342) – a key support area.
Currently, Gold is testing Storm Breaker 🌊 (Resistance 3384 – 3400) , a liquidity cluster → potential for profit-taking sell orders.
On H1, multiple FVGs formed around 3363 and 3355 → price may retrace to “fill the gap” before continuing.
👉 Intraday bias: Prioritise Sell at resistance, but watch for short Buy Scalp setups at Quick Boarding 🚤 (3342 – 3340) .
3. Captain Vincent’s Map – Key Levels 🪙
Storm Breaker 🌊 (Main Resistance): 3384 – 3400
Quick Boarding 🚤 (Buy Scalp): 3342 – 3340 | SL 3333 | TP: 3345 → 3347 → 3350 → 33xx
Golden Harbor 🏝️ (Buy Zone): 3350 – 3342
FVG Zones: Around 3363 & 3355 (short-term price magnets)
4. Trade Scenarios 📌
🔻 SELL at Storm Breaker 🌊 (Priority)
Entry: 3400 – 3402
SL: 3408
TP: 3395 → 3390 → 33xx
🔺 BUY Scalp – Quick Boarding 🚤
Entry: 3342 – 3340
SL: 3333
TP: 3345 → 3347 → 3350 → 33xx
5. Captain’s Note ⚓
"Trump’s news wave pushed Gold like an unexpected headwind. But Storm Breaker 🌊 ahead may unleash rough seas. The wise will anchor at Golden Harbor 🏝️ , while the bold may ride Quick Boarding 🚤 for fast scalps. And remember: today’s golden sea depends on the sharks at the helm."

Gold preparing for correction under FED & geopolitic - Vincent🟡 Gold Plan 25/08 – Captain Vincent ⚓
1. Market Context 🌍
Russia – Ukraine: Trump puts pressure on Putin to negotiate within 2 weeks. This looks positive for peace, but also carries escalation risks → Gold keeps its safe-haven role .
FED – Powell at Jackson Hole: Hawkish tone reduced expectations of a September rate cut from 3 to 2. USD strengthened → short-term downside pressure on Gold .
👉 Mix of political support vs FED pressure → Sideways market, Gold may need a pullback to absorb liquidity before showing clear direction.
2. Technical Outlook ⚙️
H4 candle closed bearish → Buying momentum weakens , sellers may return.
Recent FVG created after sharp bounce → Likely pullback for liquidity grab .
Bias of the day: Prioritise Sell, but short Buy Scalp setups possible at support.
3. Key Levels – Captain Vincent’s Map 🪙
Resistance:
Storm Breaker 🌊 (Sell Zone 3398 – 3400)
3376 (intermediate resistance – watch reaction)
Support:
Quick Boarding 🚤 (Buy Scalp 3340 – 3342)
SL: 3333
TP: 3345 → 3349 → 3353 → 3357 → 33xx
Golden Harbor 🏝️ (Buy Zone 3328 – 3326)
SL: 3318
TP: 3332 → 3336 → 3339 → 33xx
Higher Low – 3323
Anchor point of the trend → If broken, need to reassess all Buy setups.
4. Trade Scenarios 📌
🔻 Sell at Storm Breaker 🌊
Entry: 3398 – 3400
SL: 3408
TP: 3395 → 3390 → 3387 → 3384 → 33xx
🚤 Buy Scalp at Quick Boarding
Entry: 3340 – 3342
SL: 3333
TP: 3345 → 3349 → 3353 → 3357 → 33xx
🏝️ Buy at Golden Harbor (3328 – 3326)
SL: 3318
TP: 3332 → 3336 → 3339 → 33xx
5. Captain’s Note ⚓
"Today, the golden sea is full of undercurrents: FED winds blow against, politics push along. Those who pick Storm Breaker 🌊 may ride the wave safely; those who patiently wait at Golden Harbor 🏝️ will find peace. Quick Boarding 🚤 is for sailors seeking fast scalps in narrow waters."

Gold Plan 22/08 – Captain Vincent ( IN )Background
On the H1 timeframe , Gold continues to move sideways within the 3328 – 3350 range, sweeping liquidity again and again, making it difficult for retail traders to spot a clear trend.
Currently, Gold has absorbed almost all liquidity from the Nonfarm FVG .
Therefore, the next price action will largely depend on smart money moves and upcoming news catalysts .
Even though the overall trend is still unclear, we can still build trading setups around these key levels .
🪙 Key Levels
🔹 Storm Breaker 🌊 (Sell Zone 3368 – 3370)
SL: 3376
TP: 3365 → 3360 → 3355 → 3350 → 33xx
🔹 Golden Harbor 🏝️ (Buy Zone 3313 – 3315)
SL: 3305
TP: 3320 → 3325 → 3330 → 33xx
📌 Trading Outlook
On higher timeframes, sellers still hold the advantage .
However, Gold may need to test resistance zones again to confirm.
If price reaches Storm Breaker 🌊 → Watch for reaction and prepare to Sell.
If price drops to Golden Harbor 🏝️ → Strong support remains for short-term Buy opportunities.
⚓ Captain Vincent’s Note
"When the sharks sweep the waves, retail traders panic. But those holding the key level map will always know where the safe harbor lies."

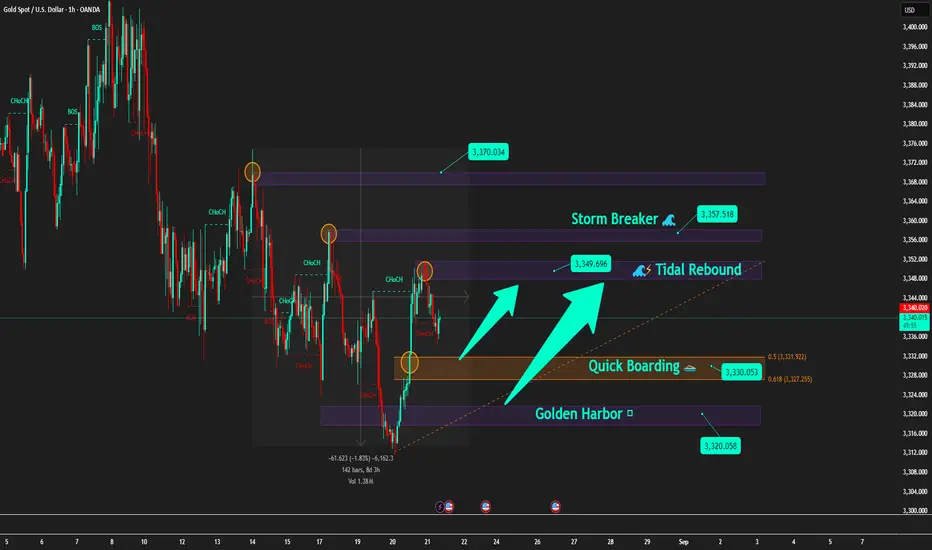
Gold after FOMC: Just a pullback or the start of a new wave?[Background
After the early morning FOMC session , Gold is showing signs of a sell-side pullback to gain momentum.
On higher timeframes (H4–D1), the structure remains bearish with lower highs .
However, consistent buying pressure around 3320 – 3330 keeps this zone as the key battlefield .
🪙 Key Levels Today
🔹 Storm Breaker 🌊 (Sell Zone 3357 – 3355)
SL: 3362
TP: 3350 → 3345 → 3340 → 33xx
🔹 Tidal Rebound 🌊⚡ (Sell Scalp 3349 – 3347)
SL: 3353
TP: 3345 → 3340 → 3335 → 33xx
🔹 Quick Boarding 🚤 (Buy Scalp 3330 – 3328)
SL: 3322
TP: 3335 → 3337 → 3339 → 3341
🔹 Golden Harbor 🏝️ (Buy Zone 3320)
SL: 3313
TP: 3325 → 3330 → extend further
📌 Trading Scenarios
After FOMC, the market may show rebound waves .
During Asia–Europe, price may consolidate between 3345 – 3357 .
If price tests Storm Breaker 🌊 → Prioritise Sell setups in line with the main bearish trend.
If price drops to Quick Boarding 🚤 or Golden Harbor 🏝️ → Short-term Buy scalps on pullback moves.
📰 Market Context
FED remains dovish leaning , with high probability of a rate cut in September (~82%, CME FedWatch) .
Geopolitical variables (Trump–Putin, Ukraine) remain unpredictable and may spark sudden volatility.
⚓ Captain’s Note
"Let Storm Breaker 🌊 test the buyers’ strength. Those who board at Golden Harbor 🏝️ will be lifted by the waves, but those who drift into the storm will soon feel the sea’s fury."
GOLD PLAN – Captain Vincent🏴☠️ GOLD PLAN – Captain Vincent ⚓
Background
After the Nonfarm payrolls, Gold created a Captain’s Liquidity Void (large imbalance zone). Price has now almost completely filled this gap.
On higher timeframes, Gold still maintains a Lower High – Lower Low structure, confirming that sellers remain in control .
However, during the Asian & European sessions, we usually see technical pullbacks to collect liquidity – those moves will be our chance to enter in line with the main direction.
📍 Key Levels for Today
🔹 Captain’s Trap Zone (3330 – 3332)
Confluence of Fibo 0.5 – 0.618 and trendline breakout.
Main SELL setup at this zone.
SL: 3336 – 3338
TP: 3325 → 3320 → 3315 → 33xx
🔹 Captain’s Quick Shot (3313)
Nonfarm breakout zone , heavy SELL volume.
Suitable for short BUY scalp if price reacts strongly.
SL: 3308
TP: 3318 → 3322 → 3326
🔹 Captain’s Safe Harbor (3300 – 3302)
Start of previous bullish leg, strongest support of the day .
If Quick Shot breaks, this becomes the main BUY accumulation zone .
SL: 3293
TP: 3305 → 3310 → 3315 → 33xx
🔹 Captain’s Shield (3313)
If held multiple times → becomes a short-term key support .
⚡ Trading Scenarios
Sell Priority : Short at Captain’s Trap Zone.
Quick Buy : Scalp around Captain’s Quick Shot if sharp reaction.
Breakdown : If 3313 fails → Buy at Safe Harbor (3300 – 3302).
📌 Captain’s Reminder
SELL bias is still dominant → Do not FOMO buy without clear signals.
The US session may bring high volatility from geopolitical headlines. Manage your capital with discipline.

Red CHoCH Confirms the Bears – Sell at Premium Zone📌 Gold Plan – M30 Timeframe | Captain Vincent ⚓
Background
On the D1 chart, the candle closed lower, showing bearish pressure still dominates.
On H4, the bearish structure continues.
However, Gold is currently stuck around 3345/oz, unable to make a clear breakout.
The 3323 – 3335 zone remains strong support – a level where Vincent has bought multiple times before with solid profits. But with the current structure, today’s priority will be Sell in line with the main trend.
Sell Zone – Premium 🎯
Entry: 3345 – 3347
SL: 3352
TP: 3340 → 3335 → 3330 → 33xx
SMC Note (CHoCH 🔴)
On the M30 timeframe, a recent red CHoCH has appeared – a signal confirming that sellers have regained control.
This strengthens the case for selling at upper resistance zones.
Today’s Scenarios
If price holds below 3345 – 3347 → Prioritise short setups, selling in line with the downtrend.
If price breaks below current support → High chance the market will move to fill the previous FVG. In that case, wait for a Breakout Down retest to enter safer.
Consider entering one small probe trade first, then go in stronger once a reversal candle confirmation appears.
Resistance to watch: 3337 – 3345
Support to watch: 3323 – 3335
⚠️ Captain’s Note:
"SMC structure with a red CHoCH has confirmed that the bears are steering the market. We will flow with the main current – Sell at the Premium Zone – but always with discipline, waiting for clear confirmation before taking action."

Gold Plan 18/08 – Captain VincentBackground
For the past two days, Gold has repeatedly tested the 3332 – 3334 zone and slipped down to 3323, showing that buyers at this level are losing strength.
The broader trend still leans bullish, but the market is heavily influenced by geopolitics and news events:
📰 US–Russia preparing for a new round of Ukraine talks (15 Aug, Alaska).
🌐 Trump’s tariff stance remains unclear, adding volatility to Gold.
💵 Fed is likely to cut 25bps in September, keeping Gold in “defensive but ready to break out” mode.
➡ With this backdrop, today’s plan requires flexibility: Buy with trend, Sell scalp at key resistances.
1. Buy Scalp – Quick Boarding 🚤
Entry: 3324 – 3326
SL: 3320
TP: 3328 → 3332 → 3336 → 33xx
Note: Only suitable for quick scalps, avoid holding longer.
2. Main Buy Zone – Safe Harbor ⚓
Entry: 3313 – 3311
SL: 3304
TP: 3314 → 3319 → 3325 → 3330
Meaning: This is the main launchpad for buyers if price corrects deeper.
3. Sell Scalp Zone – Storm Breaker 🌊
Entry: 3366 – 3377
SL: 3383
TP: 3362 → 3355 → 33xx
Meaning: Short-term resistance, ideal for quick reaction sells.
4. Main Sell Zone – Watchtower ⛩
Entry: 3396 – 3394
SL: 3402
TP: 3390 → 3385 → 3380 → 33xx
Meaning: Strong resistance zone, highly likely to trigger a bearish reaction.
If broken, Gold may extend further into 34xx.
Today’s Scenarios
If price dips to 3324 – 3326 → Quick Buy Scalp.
If price drops deeper → Prefer to Buy at Safe Harbor (3313 – 3311).
If price rises to 3366 – 3377 → Short-term Sell Scalp.
If price tests 3396 – 3394 → Stronger Sell, this is the main resistance.
Captain’s Note:
"The Gold ship still sails North ⚓ today, but each time it hits Storm Breaker 🌊 or Watchtower ⛩, the sails will drop for a quick strike before retreating. Waves from Trump–Putin headlines and the Fed’s next move may stir up rough seas. Remember, mates: better to miss one trade than let the waves sink the ship." 🏴☠️

A Classic Inverted Head & Shoulders What we’re looking at here is a textbook inverted head & shoulders formation unfolding on the chart.
🔴 & ⚪ – show the prior lower high, lower low continuation of the downtrend.
⚪ – represents the head, formed with a solid consolidation base.
🟢 – marks the structure shift, where the market starts printing higher lows.
🟡 – the counter trendline / neckline of this pattern, which price has now tested.
This structural shift is Highlight of this Post
Disclaimer: This post is purely for chart structuring and educational discussion. It is not a buy/sell recommendation or investment tip. Always do your own research before making trading decisions.

Gold Plan 15/08 – Captain VincentBackground
Yesterday, Gold revisited the BUY Scalp – Quick Boarding 🚤 (3332 – 3334) zone and bounced 140 pips.
This is the second consecutive day the zone has shown strong reaction, but today its support strength may weaken.
The main H1 trend is leaning bearish , so the priority is to look for sell setups at major resistance zones.
Zone 1 – Storm Gate 🚪 (Main Sell Zone – SMC Supply)
Entry: 3,355 – 3,357
SL: 3,361
TP: 3,351 → 3,347 → 3,342 → 33xx
Note: SMC Supply zone confluenced with Fibo 0.5 – 0.618. Wait for strong price reaction before entry.
Zone 2 – BUY Scalp – Quick Boarding 🚤
Entry : 3,332 – 3,334
SL: 3,327
TP: 3,336 → 3,339 → 3,342 → 33xx
Note: This zone has reacted twice in a row. Today, only use for quick scalps, avoid holding for long.
Zone 3 – Deep Harbor 🏝️ (Main Buy Zone – SMC Demand)
Entry: 3,290 – 3,292
SL : 3,284
TP: 3,296 → 3,300 → 3,304 → 33xx
Note: Deepest support of the day. Buy only if price drops sharply and clear reversal signals appear.
Today’s Scenarios
If price tests Storm Gate → Look for short-term sells in line with the downtrend.
If price breaks below BUY Scalp → Wait for a retest to sell further, as there’s a high chance of filling the previous Fair Value Gap.
If price reaches Deep Harbor → Attempt a bottom buy, but keep profit expectations short since the overall trend is bearish.
Captain’s Note:
"Today, the golden sea has strong waves and heavy winds. The captain will set sails at Storm Gate to catch the downwind move. Deep Harbor stays open, but will only anchor if the skies are clear. BUY Scalp is like a speedboat – fast, sharp, decisive." 🏴☠️📉
Captain’s Friday Warning ⚠️
"It’s Friday – the wildest day of the week. Trade carefully, manage capital tightly, and protect your treasure chest. The weekend is long; don’t let one impulsive move sink the ship." ⛵💰

Gold Plan 14/08 – Captain VincentGold Plan 14/08 – Captain Vincent ⚓
Background
Yesterday, Gold touched the Sell Scalp zone and cruised smoothly for 220 pips 🎯.
However, it failed to break the previous Buy Zone and is now maintaining a bullish structure on the H1 chart, with higher lows forming.
Today, the market may move slower as traders await the US PPI data , so each entry point must be taken with caution.
Zone 1 – Golden Harbor 🏝️ (Main Buy Zone – SMC Demand)
Entry: 3,334 – 3,332
SL: 3,327
TP: 3,338 → 3,342 → 3,346 → 33xx
Note: This is the main buy zone, aligned with the SMC Demand Zone. Enter only if there’s a clear reversal signal (Pin Bar / Engulfing) on M15/H1.
Zone 2 – Storm Breaker 🌊 (Sell Zone – SMC Supply)
Entry: 3,398 – 3,400
SL: 3,407
TP: 3,394 → 3,390 → 3,386 → 33xx
Note: Strong sell zone. Watch price reaction before entry. Prefer partial profit-taking along the way.
Today’s Scenarios
If price tests Golden Harbor → Wait for pin bar or engulfing, then Buy in line with the uptrend.
If price approaches Storm Breaker → Look for short-term sell setups on reversal signals.
If price stays in the mid-range → Stay on the shore, save energy for the golden moment.
Captain’s Note:
"Today, the golden sea still rides the bullish tide, but the PPI winds may shift without warning. Keep the helm steady, and anchor only at safe harbors." 🏴☠️📈

Inside My Charts: A Trader’s PerspectiveI make educational content videos for swing / positional trading

Gold Plan 13/08 – Captain VincentGold Plan 13/08 – Captain Vincent ⚓
News Background
📊 Gold is holding steady near $3,350/oz after the US July CPI release.
Headline CPI : 2.7% (below forecast of 2.8%) 📉
Core CPI: 3.1% (up from 2.9%) 📈
➡ This cools down inflation fears from tariffs and increases the probability of a 25 bps Fed rate cut in September , which is bullish for Gold.
Key factors to watch:
💼 Market awaiting more data: PPI, jobless claims, retail sales.
🔍 Tariff drama: Trump says no tariffs, but US Customs just listed 1kg & 100oz gold bars under taxable imports.
🌐 US extends the trade truce with China for another 90 days.
🕊 US–Russia talks on Ukraine scheduled for 15 Aug in Alaska.
News conclusion:
Lower-than-expected CPI + higher Fed cut chances = Gold remains positive.
But tariff and geopolitical risks must be tracked closely.
Yesterday’s Action (12/08)
Gold tapped the Buy Scalp – Quick Boarding 🚤 zone and bounced ~290 pips .
However, it failed to break decisively above the zone and moved sideways around support.
Technical Plan – 13/08
1. Sell Scalp – Quick Boarding Reverse ⚓
Entry: 3,374 – 3,376
SL: 3,382
TP: 3,368 → 3,362 → 3,355 → 3,3xx
Reason: Short-term resistance, suitable for quick sell scalps when price retests higher.
2. Sell Zone – Storm Breaker 🌊
Entry: 3,405 – 3,406
SL: 3,411
TP: 3,395 → 3,385 → 3,375 → 3,365
Reason: Major resistance zone aligned with previous highs and trend channel.
Scenarios:
Price likely to rise from current sideways range to test either Sell Scalp or Storm Breaker.
Priority: Sell if reversal signals (pin bar, engulfing) appear on M15/H1 at these zones.
If price breaks above Storm Breaker and holds above 3,411 → cancel sell plan, wait for new structure.
Captain’s Note:
"The CPI wave has anchored the Gold ship near 3,350. Today, the crew is ready to set sail towards Sell Scalp and Storm Breaker, waiting for the winds to shift for a profitable turn." ⚓🌊

STAR CEMENT LTD | Strong Breakout After Long-Term Consolidation 📝 Description:
📌 Stock: STAR CEMENT LTD (NSE)
📅 Timeframe: 1D (Daily)
📈 Breakout Date: 04-Aug-2025
💼 Sector: Cement / Infrastructure
⚡️ Technical Setup:
Breakout Above Long-Term Resistance:
Price has finally broken through the ₹240–₹256 resistance zone, which had capped upside for nearly a year.
Strong Volume Confirmation:
The breakout is accompanied by a significant rise in volume, adding credibility to the move and indicating strong buyer interest.
Bullish Market Structure:
Price has shifted into a higher high–higher low structure over the last few weeks, confirming momentum build-up.
Range Built-Up Base:
Price consolidated within ₹190–₹240 for over 10 months, creating a solid foundation for the breakout.
🔍 Key Observations:
📊 Chart Pattern:
The chart shows a horizontal breakout from a long-term consolidation zone between ₹240–₹256. This breakout signals a bullish continuation, as the stock pushes above a multi-month supply zone with strong momentum.
📈 Recent Price Action:
• The stock gave a clean breakout on 04-Aug-2025, closing above the resistance zone required with strong follow-through.
• The rally was supported by 2.5× surge in volume, indicating institutional interest.
• Price structure shows confirming trend reversal from range-bound to bullish.
• This breakout comes after 10+ months of consolidation, adding more weight to the move.
Add-ons:-
✅ Clean breakout with follow-through above ₹256.
🔼 No immediate supply zone until ₹280–₹290 range.
🔁 ₹240 now becomes a key support level.
📊 Increasing volume supports institutional accumulation possibility.
📌 Trade View:
Aggressive Entry:
• Entry around current levels if price holds above the breakout zone (₹256+).
• Use a stop-loss as per your risk plan.
Conservative Entry:
• Wait for a retest of the breakout zone (₹240–₹256) with confirmation through price action and volume support.
• Ideal for traders preferring high conviction and lower risk.
•Bias: Bullish
•Support: ₹240 (flip level), ₹225 (minor swing)
•Invalidation: Close below ₹240
🧠 Rationale:
The long base, clean breakout, and strong volume together suggest a high-probability bullish continuation. Absence of nearby resistance offers a decent runway towards the ₹280–₹290 zone. This move is also backed by strength in the broader cement sector.
🚨 Disclaimer: This is not financial advice. All views are shared for educational purposes only. Always do your own research and manage risk responsibly before making any trading decisions.
What is your view please comment it down and also boost the idea this help to motivate us.

Gold Plan 12/08 – Captain VincentGold Plan 12/08 – Captain Vincent ⚓
Background:
After sliding from the Storm Breaker 🌊, Gold has broken below the 3358 zone and successfully retested it. The ship is now heading straight towards the Buy Scalp – Quick Boarding 🚤 dock.
Today’s Plan: Only buy when price reaches the pre-defined support zones — no chasing in open waters.
Zone 1 – Quick Boarding 🚤 (Buy Scalp)
Entry: 3,333 – 3,331
SL: 3,327
TP: 3,336 → 3,339 → 3,342 → 3,345 → 3,348 → 33xx
Note: Fast in & out. Take partial profits at each TP hit.
Zone 2 – Golden Harbor 🏝️ (Main Buy Zone)
Entry: 3,311 – 3,309
SL: 3,305
TP: 3,315 → 3,319 → 3,323 → 3,327 → 3,331 → 33xx
Note: Main accumulation zone. Hold longer if buying momentum stays strong.
Today’s Scenarios:
If price hits Quick Boarding → Wait for a reversal signal (pin bar, engulfing) on M15/H1 before entering.
If price dips to Golden Harbor → Observe the bounce strength; enter only on clear confirmation.
If neither zone is touched → Stay on the shore; wait for the next voyage.
Captain’s Note:
“The Gold ship has left the 3358 waters, turning its bow towards Quick Boarding 🚤. If docking is smooth, the crew will sail out swiftly to the open seas. Golden Harbor 🏝️ remains the main refuge if stronger waves push deeper.”
