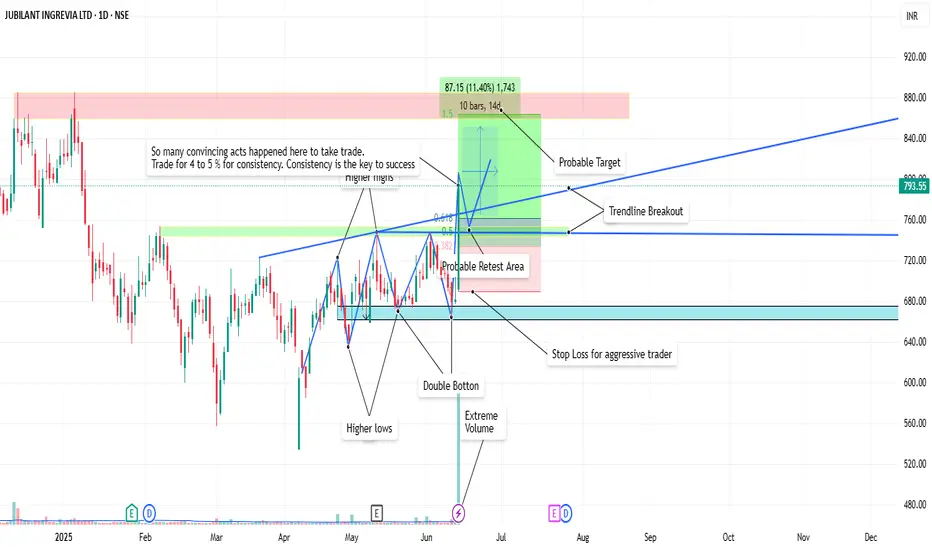
JUBLINGREA Breakout📊 1. Price Action & Pattern Analysis
Breakout Trigger:
Double Bottom at ₹660–₹670 confirmed.
Higher Lows and Higher Highs are clearly visible — a bullish trend structure.
Breakout from trendline resistance with a strong bullish candle on extreme volume confirms buyer interest.
Probable Retest Zone: Around ₹745–₹760, which overlaps with the 38.2–61.8% Fibonacci zone, indicating a good low-risk reentry area if price retests.
Stop-Loss (Aggressive): Just below ₹680 support zone (prior bottom and neckline).
🔍 2. Volume & Confirmation
Massive Volume Spike on breakout day — highest in recent months.
Volume confirms genuine buying pressure, validating the pattern breakout.
🧭 3. Stage Classification
✅ Current Stage: Stage 2 – Markup Phase (Early Stage)
Why:
Breakout from long consolidation.
Volume confirms institutional activity.
Trend structure shifting to higher highs/lows.
Strong retest and breakout of previous resistance zones.
🎯 4. Trade Plan Summary
Metric Value
📌 Entry Range ₹760–₹780 (retest possible)
🧯 Stop Loss (Aggressive) ₹675–₹680 zone
📈 Target 1 (Short-Term) ₹840–₹860 (as shown)
📈 Target 2 (Positional) ₹900+
🔎 Risk–Reward 1:2.5+ (Ideal Swing Setup)
🧠 “So many convincing acts happened here to take trade... Trade for 4 to 5% for consistency.”
✅ Conclusion
This is a classic Stage 2 early breakout with:
Multi-confirmation setup (pattern + trendline + volume)
Well-defined risk-reward
Excellent for swing-to-positional trades
Tradingview
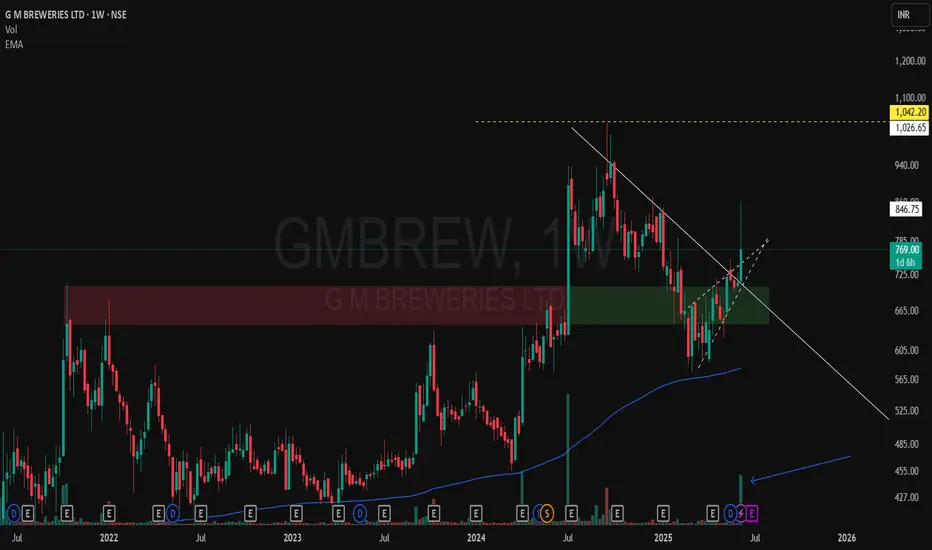
GM BREWERIES – A Classic CT Breakout with Strong Demand Flip🔍 A solid Weekly Time Frame (WTF) structure is visible here on GMBREW:
-The red-green zone highlights a classic supply turning into demand, supporting the structure.
-A clear Counter Trendline (CT) breakout (white line) is now visible, showing strength with increasing momentum.
-Notice the strong spike in volume – this breakout isn't silent. Participation has significantly picked up.
-Yellow line represents the MTF supply, which could act as the next area of interest.
-Price is currently showing a wick, so weekly closing behavior will be key from here.
-No predictions – just a technical snapshot. Structure, volume, and zones are aligning well here. Let’s see how it unfolds. 📊
KRISHANA PHOSCHEM LTD | Major Breakout Ahead? Hey Family, here’s another stock showing a strong technical setup! 🚀
Key Observations:
Pattern : Formation of a Rectangle Box Pattern on the Daily Timeframe (1D).
Range Period:
Stock moved within a horizontal range between June 2024 to April 2025.
Multiple tests near the upper resistance band during this period.
Resistance Behavior:
Price repeatedly tested the resistance zone around ₹278–₹285.
Now showing signs of a breakout attempt and trying to sustain above the range.
Volume Insight:
Noticeable volume accumulation over the past few sessions.
Volume spikes during breakout candles suggest strong buyer interest.
Candlestick Structure:
Strong bullish candles with minimal rejection indicate a genuine attempt to break out.
🚨 Disclaimer: What is your view please comment it down and also boost the idea this help to motivate us. We are Certified. All views shared on this channel are my personal opinion and is shared for educational purpose and should not be considered advise of any nature.
🚨 Note: Always manage risk and do your own research.

Multi time frame charting explained in GEPILI make educational content videos for swing / positional trading
GLong

4 Stocks. 4 Stories. Here's How I See Them Without Predictions..Purely chart-based view. No bias. No advice. Just how I interpret these right now
I make educational content videos on Swing trading .

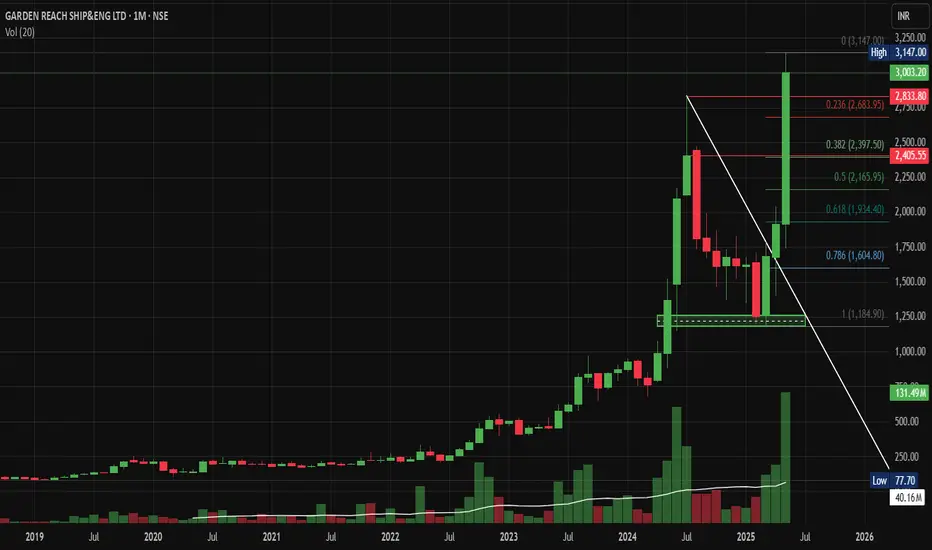
GRSE: Can this Defence Stock Double Your Money in 2025?NSE:GRSE : Can this Defence Stock Double Your Money in 2025? Let's analyse this weekend's My Chart of the Month
NSE:GRSE presents one of the most compelling technical setups in the defence sector, with the stock currently trading at ₹3,003 after a massive rally from its 2019 lows around ₹77. The chart reveals a textbook case of a multi-year accumulation followed by explosive breakout dynamics.
Price Action Analysis :
The stock underwent a dramatic transformation from a prolonged consolidation phase between 2019 and 2022, during which it traded in a narrow range of ₹150-300. The real fireworks began in late 2022, when GRSE broke out of its multi-year base with exceptional volume, signalling institutional accumulation.
The most striking feature is the parabolic move from ₹1,000 levels in early 2024 to the current high of ₹3,250. This represents over 200% gains in just over a year, accompanied by consistently high volumes averaging 40-130 million shares, indicating strong institutional participation.
Volume Analysis:
Volume patterns have been particularly bullish, with spikes coinciding with price advances. The recent correction has seen relatively lower volumes, suggesting profit-booking rather than institutional selling. The volume-weighted average price (VWAP) continues to trend upward, indicating underlying strength.
Key Technical Levels:
Support Zone: The stock has established strong support around ₹2,400-2,500 levels, coinciding with the 0.5 Fibonacci retracement from the recent rally.
Immediate Support: ₹2,683 (recent swing low)
Critical Support: ₹2,165 (0.618 Fibonacci level)
Resistance Levels: The stock recently touched ₹3,250 and is currently consolidating. The next major resistance lies at ₹3,500-3,600 based on measured move projections.
Trade Setup:
Entry Strategy:
- Primary Entry: ₹2,650-2,750 (current levels to slight dip)
- Aggressive Entry: ₹2,900-3,000 on any pullback
- Conservative Entry: ₹2,400-2,500 (major support retest)
Target Levels:
- Target 1: ₹3,400 (15% upside)
- Target 2: ₹3,800 (35% upside)
- Target 3: ₹4,200 (50% upside based on measured moves)
Stop Loss: ₹2,300 (below critical Fibonacci support)
Risk-Reward: Favourable 1:2 to 1:3 ratio across all entry points
Sectoral & Fundamental Backdrop:
The defence sector is experiencing a renaissance driven by the government's push for Atmanirbhar Bharat and increased defence spending. GRSE, being a premier shipbuilding company under the Ministry of Defence, is directly benefiting from:
1. Increased naval modernization programs
2. Export opportunities under government initiatives
3. Project 75(I) submarine program participation
4. Anti-submarine warfare corvette projects
The company's order book has been consistently growing, with recent announcements of significant contracts providing revenue visibility for the next 3-4 years. The shift towards indigenous defence production gives GRSE a strategic advantage in the naval segment.
Risk Factors:
Primary risks include overall market correction affecting high-beta defence stocks, profit-booking by retail investors after substantial gains, and any delays in government defence projects. The stock's high valuation multiple also makes it susceptible to sector rotation.
My Take:
GRSE represents a compelling blend of strong fundamentals backed by government policy support and technically sound chart patterns. The risk-adjusted returns appear favourable for medium-term investors, with the stock likely to test new highs once the Pullback is done. However, position sizing should account for the inherent volatility in defence stocks and the broader market environment. Therefore, BUY ON DIPS
The combination of sectoral tailwinds, robust order book, and technical breakout makes GRSE a candidate for continued outperformance, though investors should remain mindful of profit-booking opportunities at resistance zones.
Keep in the Watchlist.
NO RECO. For Buy/Sell.
📌Thank you for exploring my idea! I hope you found it valuable.
🙏FOLLOW for more
👍BOOST if you found it useful.
✍️COMMENT below with your views.
Meanwhile, check out my other stock ideas on the right side until this trade is activated. I would love your feedback.
Disclaimer: "I am not a SEBI REGISTERED RESEARCH ANALYST AND INVESTMENT ADVISER."
This analysis is intended solely for informational and educational purposes and should not be interpreted as financial advice. It is advisable to consult a qualified financial advisor or conduct thorough research before making investment decisions.
Price Action Case Study: Weekly Price action chart of SIGACHI 🔹 Key Structural Elements:
-White Solid Line: Primary Counter-Trendline (CT) connecting multiple swing highs, acting as dynamic resistance over several months.
-White Dotted Lines: Hidden supply lines derived from intermediary highs, often acting as secondary resistance.
-Yellow Lines: Higher timeframe resistance zones (MTF) — offering confluence markers for potential supply zones ahead.
🔹Volume Expansion:
The breakout candle is supported by significant volume (~36M), indicating strong participation. Volume here acts as a confirmation trigger, suggesting institutional interest or broad-based buying.
🔹Structure:
The breakout occurs after an extended consolidation and a series of higher lows.

Everyone’s Buying MMTC… I’m Waiting for this to happen✅ CT Breakout (WTF): Well-defined CT break cleared with strong bullish momentum.
✅ Volume Confirmation: Breakout candle accompanied by 269M+ volume, signaling genuine interest.
✅ Structure: Higher low before breakout reinforces structural reliability.
✅ Base Formation: Multiple weeks of tight consolidation at base builds a solid foundation for the move.
⚠️ Caution – DTF Overextension: On the daily timeframe (DTF), price shows back-to-back green candles, indicating a short-term overbought condition.
A retracement is healthy and preferred. A direct move from here risks a poor R:R swing
📌 Conclusion:
Solid weekly breakout with all structural prerequisites in place. However, due to the extended DTF structure, wait for a healthy pullback before initiating swing entries. Avoid chasing strength. Let the price offer a clean opportunity.
🔁 Following the yellow path = strategic patience + optimal R:R.

Venus Pipes Explodes 12% Breaking Out of 6-Month BaseNSE:VENUSPIPES Explodes 12%: Breaking Out of 6-Month Base Could Target ₹1,600 as it made a Beautiful Chart Structure Just Before Q4 FY25 Results.
Price Action Analysis
NSE:VENUSPIPES is experiencing a significant breakout moment, currently trading at ₹1,452.00 with an impressive 12.37% gain (₹159.80). The stock has decisively broken above a critical resistance zone around ₹1,400-1,420 after consolidating in a well-defined base for nearly six months. This breakout comes with strong momentum and represents a potential shift from accumulation to the markup phase.
Volume Analysis:
Volume is exceptionally strong at 626.33K shares compared to the average of 85.02K - nearly 7.5x times normal volume. This massive surge in participation validates the breakout and suggests institutional buying interest. The volume spike coinciding with the price breakout is a textbook confirmation signal that significantly increases the probability of continuation.
Key Support & Resistance Levels:
- Newly Broken Resistance: ₹1,400-1,420 zone (now potential support)
- Next Major Resistance: ₹1,500-1,520 (psychological level and previous resistance)
- Ultimate Target Resistance: ₹1,900-1,950 (red horizontal line - major resistance from earlier highs)
- Strong Base Support: ₹1,100-1,150 zone (multiple green arrows showing successful tests)
- Immediate Support: ₹1,380-1,400 (previous resistance becomes support)
Technical Patterns:
1. Rectangle Breakout: Clean break above the 6-month consolidation range (₹1,100-1,420)
2. Multiple Bottom Formation: Several tests of the ₹1,100-1,150 support zone (marked with green arrows)
3. Ascending Triangle: Recent price action shows higher lows approaching the ₹1,420 resistance
4. Volume Breakout Pattern: Classic high-volume breakout from a prolonged base
Trade Setup - Breakout Continuation
Primary Entry Strategy:
- Entry Point: ₹1,440-1,460 (current levels or minor pullback)
- Aggressive Entry: ₹1,420-1,430 (on any retest of breakout level)
Target Levels:
- First Target: ₹1,520-1,540 (psychological resistance and measured move)
- Second Target: ₹1,650-1,680 (extension target based on base width)
- Ultimate Target: ₹1,800-1,850 (major resistance zone approach)
Risk Management:
- Stop Loss: ₹1,350 (below the breakout zone and recent support)
- Tight Stop: ₹1,390 for short-term traders
- Position Size: Maximum 2-3% of portfolio at risk
Alternative Setup - Conservative Approach
For risk-averse traders:
- Entry: ₹1,480-1,500 (after clearing first resistance convincingly)
- Stop Loss: ₹1,420 (below confirmed breakout level)
- Targets: ₹1,600, ₹1,750
Pattern Analysis:
The stock has formed a solid 6-month base between ₹1,100-1,420, allowing for significant accumulation. The multiple tests of support around ₹1,100-1,150 (green arrows) demonstrate strong buying interest at lower levels. The recent ascending triangle formation within the larger rectangle pattern suggests building momentum that has now been released.
Risk-Reward Assessment:
- Primary Setup R:R: 1:2.8 (Entry ₹1,450, Stop ₹1,350, Target ₹1,730)
- Breakout Target: Rectangle pattern suggests potential for 25-30% move
- Failure Risk: Breakdown below ₹1,380 would invalidate the bullish setup
Key Technical Factors:
The convergence of multiple bullish signals - rectangle breakout, volume confirmation, successful base building, and momentum surge - creates a high-probability setup. The stock has spent considerable time building this base, and the breakout with such strong volume suggests genuine institutional participation rather than retail speculation.
Trading Strategy:
Traders should look for any minor pullbacks to the ₹1,420-1,440 zone as ideal entry opportunities. The key is to ensure the breakout level holds as support. A sustained move above ₹1,500 would confirm the pattern and likely attract momentum buying, potentially accelerating the move toward the ₹1,650-1,700 zone.
Monitor for any evening star or shooting star patterns at resistance levels, which could signal temporary exhaustion and provide profit-taking opportunities.
Keep in the Watchlist.
NO RECO. For Buy/Sell.
📌Thank you for exploring my idea! I hope you found it valuable.
🙏FOLLOW for more
👍BOOST if you found it useful.
✍️COMMENT below with your views.
Meanwhile, check out my other stock ideas on the right side until this trade is activated. I would love your feedback.
Disclaimer: "I am not SEBI REGISTERED RESEARCH ANALYST AND INVESTMENT ADVISER."
This analysis is intended solely for informational and educational purposes and should not be interpreted as financial advice. It is advisable to consult a qualified financial advisor or conduct thorough research before making investment decisions.

USHA MARTIN BREAKS OUT! 7.5% SURGE SIGNALS MASSIVE RALLY AHEADNSE:USHAMART Made Beautiful Chart Structure of Kinda Triple Bottom Reversal Pattern today after Q4 Results with Good Price and Volume action and Breaking the Trendline.
Price Action:
- The stock has been in a downtrend since November 2024, forming a clear descending resistance line (white diagonal Trendline)
- Currently showing strong breakout momentum at ₹334.85, up ₹23.75 (+7.46%) in today's session
- Successfully broken above both the downtrend line and horizontal resistance at ₹320-325
- Multiple tests of support at the ₹290 level have created a solid base for the current rally
- Higher lows forming since March indicate increasing buying pressure
Volume Analysis:
- Today's volume at 4.98M shares vs. average of 688.65K (over 7x normal volume)
- Previous support bounces (green arrows) also occurred with increased volume
- Extremely high volume on today's breakout confirms strong institutional interest
- Volume profile shows healthy accumulation during support tests
Key Support and Resistance Levels:
- Strong support established at ₹290 level (green horizontal line)
- Intermediate resistance/support at ₹320-325 (lower red horizontal line)
- Major resistance at ₹350 level (upper red horizontal line)
- The previous rejection point at ₹350 (red arrow) now becomes the next target
- Long-term resistance from October to December 2024 around ₹420
Technical Patterns:
1. Downtrend Line Breakout*- Price has decisively broken above the multi-month downtrend line
2. Kinda Triple Bottom- Formed at ₹290 level (February-May), creating a solid foundation
3. Ascending Triangle- Recent price action shows higher lows against horizontal resistance
4. Volume Confirmation- Massive volume spike validates the technical breakout
5. Bullish Engulfing Candle- Today's price action engulfs previous bearish candles
Trade Setup:
- Pattern: Downtrend line breakout + horizontal resistance break
- Confirmation: Strong price action with 7x normal volume
- Context: Potential trend reversal after extended downtrend and base formation
Entry Points:
1. Aggressive Entry: Current price (₹334.85) with partial position
2. Pullback Entry: On retest of breakout level ₹320-325
3. Confirmation Entry: Add positions on close above ₹350 (previous resistance)
Exit Strategy:
- Target 1: ₹350 (immediate resistance)
- Target 2: ₹380 (intermediate resistance based on prior support level)
- Target 3: ₹420 (major resistance from December 2024)
- Trailing Stop: Implement a 5% trailing stop after Target 1 is achieved
Stop Loss Placement:
- Aggressive Stop: ₹315 (below breakout level)
- Conservative Stop: ₹305 (midpoint between support and breakout)
- Pattern-Based Stop: ₹290 (below the triple bottom support)
Risk Management:
- Position sizing: Limit risk to 1-2% of trading capital
- Risk-reward ratio: Maintain at least 1:1.5 (with aggressive stop)
- Consider scaling in: 50% at current level, 25% on pullback, 25% on further confirmation
- Scale out: 30% at Target 1, 40% at Target 2, hold remainder with trailing stop
Today's powerful breakout on record volume after forming a kinda triple bottom pattern suggests a potential trend reversal. The breakout above both the descending trendline and horizontal resistance provides a compelling technical case for upside continuation. If the stock can maintain momentum above the ₹325 level, it could target the next resistance at ₹350 quickly, with potential for a move toward ₹380-420 in the coming weeks.
Keep in the Watchlist.
NO RECO. For Buy/Sell.
📌Thank you for exploring my idea! I hope you found it valuable.
🙏FLLOW for more
👍BOOST if useful
✍️COMMENT below with your views.
Meanwhile, check out my other stock ideas on the right side until this trade is activated. I would love your feedback.
Disclaimer: "I am not a SEBI REGISTERED RESEARCH ANALYST AND INVESTMENT ADVISER."
This analysis is intended solely for informational and educational purposes and should not be interpreted as financial advice. It is advisable to consult a qualified financial advisor or conduct thorough research before making investment decisions.

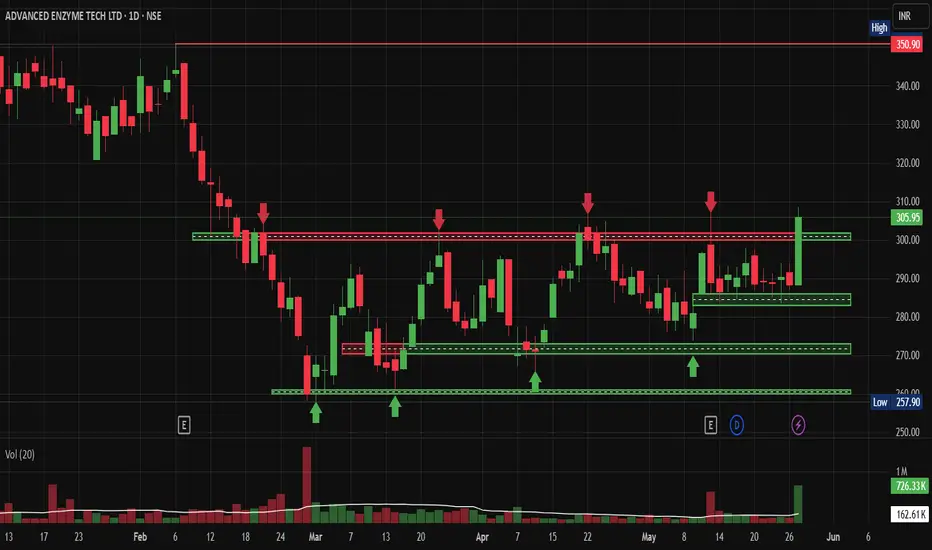
Advanced Enzymes: Fresh Breakout Above Key ResistanceNSE:ADVENZYMES Made a Beautiful Chart Structure, Gave Fresh Breakout Above Key Resistance, Could Now Trigger 20% Rally - Time to Buy the Dip?
Pattern Recognition and Base Formation:
NSE:ADVENZYMES has been consolidating in a well-defined rectangular trading range for the past 3-4 months, oscillating between ₹260-305 levels. This sideways consolidation represents a healthy digestion phase after the stock's earlier decline from highs around ₹350.
The most recent price action shows a decisive breakout above the ₹305 resistance level on strong volume expansion, suggesting institutional participation and potential trend reversal. The stock appears to be forming a classic "rectangle breakout" pattern, which typically signals continuation of the prevailing trend or reversal from consolidation.
Key Technical Levels Analysis:
Key Support Levels:
- Immediate Support: ₹285-290 (recent breakout zone, now expected to act as support)
- Major Support: ₹270-275 (mid-range consolidation area with multiple touches)
- Critical Support: ₹260-265 (lower boundary of the rectangle pattern)
- Ultimate Floor: ₹257.90 (52-week low and absolute support)
Key Resistance Levels:
- Immediate Resistance: ₹315-320 (psychological round number resistance)
- Next Target: ₹330-335 (halfway to previous highs)
- Major Target: ₹350 (previous high retest)
- Extension Target: ₹365-370 (measured move from rectangle pattern)
Volume Spread Analysis:
Today's volume surge to 776.33K shares represents nearly 5x the average daily volume of 162.61K, indicating significant institutional interest. This volume expansion accompanying the breakout is a critical confirmation signal that validates the technical setup.
The volume pattern during the consolidation phase showed typical accumulation characteristics - higher volume during declines and moderate volume during bounces, until today's breakout, which shows strong participation.
Technical Pattern Assessment:
Primary Pattern: Rectangle/Trading Range Breakout
- Formation Period: February 2025 - May 2025
- Range: ₹260-305 (approximately ₹45 range)
- Breakout Level: ₹305 (achieved with volume confirmation)
- Measured Target: ₹350+ (adding range height to breakout point)
The pattern shows multiple tests of both support and resistance levels, indicating a mature base formation with strong hands accumulating positions during weakness.
Trade Setup:
Setup Classification: Breakout Play with Volume Confirmation
Entry Strategies:
- Aggressive Entry: ₹300-305 (current levels on any minor pullback)
- Conservative Entry: ₹285-290 (on retest of breakout level for better risk-reward)
- Value Entry: ₹275-280 (if deeper pullback occurs, though less likely given volume surge)
Position Sizing:
- Initial Allocation: 1-2% of portfolio (given setup quality and volume confirmation)
- Scaling Strategy: Add on pullbacks to support levels
Profit Taking Approach:
- Target 1: ₹325-330 (6-8% upside) - Book 30% of position
- Target 2: ₹345-350 (12-15% upside) - Book 40% of position
- Target 3: ₹365-370 (18-20% upside) - Hold remaining 30% for potential extension
Risk Management Framework:
- Tight Stop: ₹295 (3-4% downside for short-term traders)
- Swing Stop: ₹285 (7-8% downside for position traders)
- Pattern Stop: ₹275 (10% downside - invalidates bullish setup if breached)
Sectoral and Fundamental Backdrop:
NSE:ADVENZYMES operates in the speciality chemicals and biotechnology space, focusing on enzyme manufacturing for various industrial applications. The sector dynamics are currently favourable due to:
Industry Tailwinds:
- Growing demand for sustainable and eco-friendly industrial processes
- Increasing adoption of enzyme-based solutions in food processing, textiles, and pharmaceuticals
- Government push for bio-based manufacturing and green chemistry initiatives
- Rising exports of speciality chemicals from India
Company Specific Factors:
- Strong research and development capabilities in enzyme technology
- Diversified application portfolio reducing single-sector dependency
- Established client relationships in domestic and international markets
- Beneficiary of the "Make in India" initiative in speciality chemicals
Fundamental Support:
- Consistent revenue growth trajectory in recent quarters
- Improving operating margins due to product mix optimization
- Strong balance sheet with manageable debt levels
- Increasing focus on value-added enzyme products
Risk Assessment:
Bullish Catalysts:
- Volume-confirmed breakout from 3-month consolidation
- Strong sectoral tailwinds supporting long-term growth
- Technical pattern completion with clear target levels
- Established support base providing downside protection
Risk Factors:
- Broader market volatility could impact momentum stocks
- The speciality chemicals sector's sensitivity to raw material costs
- Global economic slowdown affecting industrial demand
- Competition from larger multinational enzyme manufacturers
My Take and Recommendation:
NSE:ADVENZYMES presents a compelling technical setup with the stock breaking out of a well-established 3-month trading range on exceptional volume. The combination of strong technical patterns, sectoral tailwinds, and reasonable fundamental backdrop creates an attractive risk-adjusted opportunity.
The immediate focus should be on the stock's ability to sustain above the ₹305 breakout level and build momentum toward the ₹325-330 resistance zone. Any pullback to the ₹285-290 area would offer an excellent secondary entry point with improved risk-reward parameters.
Given the volume confirmation and sector dynamics, the stock appears positioned for a potential move toward its previous highs around ₹350, representing approximately 15% upside from current levels. However, traders should maintain disciplined risk management and respect the established support levels to protect capital in case of adverse market conditions.
The next few trading sessions will be crucial to determine whether this breakout has the sustainability to trigger the next leg of the rally or if it represents a false breakout requiring reassessment of the bullish thesis.
Keep in the Watchlist.
NO RECO. For Buy/Sell.
📌Thank you for exploring my idea! I hope you found it valuable.
🙏FOLLOW for more
👍BOOST if you found it useful.
✍️COMMENT below with your views.
Meanwhile, check out my other stock ideas on the right side until this trade is activated. I would love your feedback.
Disclaimer: "I am not a SEBI REGISTERED RESEARCH ANALYST AND INVESTMENT ADVISER."
This analysis is intended solely for informational and educational purposes and should not be interpreted as financial advice. It is advisable to consult a qualified financial advisor or conduct thorough research before making investment decisions.
India Cements Reversal TradeNSE:INDIACEM is looking good for a reversal trade as it bounced back from key levels which were the previous breakout zone where good buying was seen with Huge Volumes post the news of NSE:ULTRACEMCO acquisition.
About:
NSE:INDIACEM is a leading cement manufacturing company headquartered in Chennai. It was incorporated in the year 1946 by Shri S N N Sankaralinga Iyer and Sri T S Narayanaswami. While retaining cement over the years as its mainstay, India Cements has ventured into related fields like shipping, captive power and coal mining that have purposeful synergy with the core business. The co is also a sponsor of the IPL franchise “Chennai Super Kings”.
Trade Setup:
Could be a good Positional Trade with Buy on Dips Approach that May Retest the Breakout Zones again and then go upwards thereafter as MACD starts Trending Upwards.
Target(Take Profit):
Around 335 Levels or Falling 100 DSMA.
Stop Loss:
Entry Candle Low or The Key Levels Marked.
📌Thank you for exploring my idea! I hope you found it valuable.
🙏FLLOW for more
👍BOOST if useful
✍️COMMENT Below your views.
Meanwhile, check out my other stock ideas on the right side until this trade is activated. I would love your feedback.
Disclaimer: "I am not SEBI REGISTERED RESEARCH ANALYST AND INVESTMENT ADVISER."
This analysis is intended solely for informational and educational purposes only and should not be interpreted as financial advice. It is advisable to consult a qualified financial advisor or conduct thorough research before making investment decisions.

EPL - Breakout Post Good Q4NSE:EPL Made Beautiful Chart Structure today after posting good Q4 Results with Good Price and Volume action.
Price Action Analysis:
Resistance Breakout:
1. Primary Resistance Break: The stock has successfully broken above the well-defined resistance zone at ₹203-205 (lower red rectangle), which had contained price movements since mid-April.
2. Approaching Major Resistance: With today's 4.57% gain, EPL is now testing a critical longer-term resistance level at ₹210-213 (upper red rectangle), which has capped prices since late February after a sharp decline from the ₹250+ level.
3. Base Formation: After hitting lows around ₹183 in early April, the stock has formed a constructive base pattern with higher lows, suggesting accumulation and buying support at progressively higher levels.
Volume Analysis:
Today's volume characteristics strongly support the bullish case:
- Volume of 3.34M shares is significantly above the 20-day average of 895.96K (nearly 4x normal volume)
- The volume spike coincides perfectly with the upside breakout
- Prior consolidation showed decreasing volume, typically a precursor to a volume-supported breakout
- The recent accumulation phase (late April to early May) displayed positive volume patterns
Key Support and Resistance Levels:
Key Resistance Levels:
1. Immediate Resistance: ₹210-213 (upper red rectangle - critical level being tested now)
2. Intermediate Resistance: ₹225 (reaction high from mid-February)
3. Major Resistance: ₹250-255 (February high)
Key Support Levels:
1. New Support: ₹203-205 (previous resistance now converted to support)
2. Secondary Support: ₹195-198 (consolidation range from late April)
3. Strong Support: ₹183-185 (April lows and beginning of current base)
Technical Patterns:
1. Double Bottom: The March and April lows near ₹183-190 formed a double bottom pattern, typically a reversal signal.
2. Range Breakout: Today's move represents a clear breakout from the April-May trading range.
Volume Confirmation:
The volume trend provides strong confirmation:
- Clear volume divergence during the April bottom (decreasing volume on downmoves)
- Increasing volume during recovery phases
- Today's substantial volume spike on breakout (3.34M shares)
- Volume well above average throughout May, suggesting institutional participation
My Outlook:
The combination of a multi-week base breakout with exceptionally strong volume support signals a potentially significant shift in momentum. The key technical question now is whether EPL can overcome the major resistance at ₹210-213.
If the stock can close convincingly above ₹213 in the coming sessions, it would complete a substantial bottoming pattern with potential upside targets at ₹225 initially and ₹240-250 longer-term. Conversely, failure at this resistance could lead to a retest of the breakout level at ₹203-205, which should now provide support.
Keep in the Watchlist and on your Radar.
NO RECO. For Buy/Sell.
📌Thank you for exploring my idea! I hope you found it valuable.
🙏FLLOW for more
👍BOOST if useful
✍️COMMENT below with your views.
Meanwhile, check out my other stock ideas on the right side until this trade is activated. I would love your feedback.
Disclaimer: "I am not SEBI REGISTERED RESEARCH ANALYST AND INVESTMENT ADVISER."
This analysis is intended solely for informational and educational purposes and should not be interpreted as financial advice. It is advisable to consult a qualified financial advisor or conduct thorough research before making investment decisions.

Multi-Month Triangle Breakout Can Signal Move to ₹750+NSE:TIPSMUSIC Made a Beautiful Chart Structure Today and Breaks Free of Multi-Month Triangle Breakout and Could Signal Explosive Move to ₹750+
Price Action Analysis:
NSE:TIPSMUSIC is currently trading at ₹676.80, up 3.68% (₹24.00) today. The stock has been consolidating in a narrowing range since January 2025, forming a classic symmetrical triangle pattern. After testing the lower support multiple times around ₹580-600, the stock is now approaching the apex of the triangle and showing signs of a potential upside breakout. The recent price action shows higher lows being formed, indicating growing buying interest at lower levels.
Volume Analysis:
Volume is healthy at 319.61K shares, significantly above the average of 192.25 K. The increased participation suggests growing interest as the stock approaches a crucial decision point. Volume patterns show consistent buying support during dips to the triangle's lower boundary, while recent sessions have seen upticks in volume accompanying the move higher.
Key Support & Resistance Levels:
- Immediate Resistance: ₹720-730 zone (upper triangle boundary and previous resistance)
- Major Resistance: ₹750-760 (prior swing high from December)
- Triangle Support: ₹580-600 zone (marked with green arrows - multiple successful tests)
- Key Support: ₹560-570 (breakdown level that would invalidate the pattern)
- Dynamic Resistance: Descending trendline from November highs
Technical Patterns:
1. Symmetrical Triangle: Well-defined triangle formation since January, with converging trendlines
2. Triple Bottom: Multiple successful tests of the ₹580-600 support zone (green arrows)
3. Ascending Triangle Element: The recent higher lows suggest buyers are becoming more aggressive
4. Compression Pattern: Decreasing volatility as price approaches the triangle apex, typically before significant moves
Trade Setup - Breakout Play:
Entry Strategy:
- Primary Entry: ₹695-700 on confirmed breakout above triangle resistance with volume
- Secondary Entry: ₹680-685 on any pullback to current levels (anticipatory entry)
Targets:
- First Target: ₹730-735 (immediate resistance)
- Second Target: ₹760-770 (measured move from triangle base)
- Final Target: ₹800-820 (extension target based on triangle height)
Risk Management:
- Stop Loss: ₹640 (below recent swing low and triangle support)
- Tight Stop: ₹660 for aggressive traders
- Position Size: Maximum 2% of portfolio at risk
Alternative Setup - Continuation Play
For conservative traders waiting for confirmation:
- Entry: ₹735-740 (after clearing first resistance zone)
- Stop Loss: ₹695 (below breakout level)
- Targets: ₹780, ₹820, ₹860
Risk-Reward Analysis:
- Primary Setup R:R = 1:2.5 (Entry ₹690, Stop ₹640, Target ₹770)
- The triangle pattern suggests a potential 15-20% move upon breakout
- A failed breakout risk exists if volume doesn't confirm the move
Key Catalysts to Watch:
The stock appears to be in the final stages of its triangle consolidation. A breakout above ₹720 with strong volume (above 400K shares) would confirm the pattern and likely trigger momentum buying. Conversely, a breakdown below ₹640 would invalidate the bullish setup and could lead to a test of ₹560-570 levels.
The decreasing volatility and tightening price range suggest a significant move is imminent. Given the multiple successful tests of support and the overall market context, the probability favours an upside resolution, making this an attractive risk-reward setup for both swing and position traders.
Traders should monitor volume closely on any breakout attempt, as genuine breakouts from triangle patterns typically require volume confirmation to sustain the move.
Keep in the Watchlist.
NO RECO. For Buy/Sell.
📌Thank you for exploring my idea! I hope you found it valuable.
🙏FOLLOW for more
👍BOOST if you found it useful.
✍️COMMENT below with your views.
Meanwhile, check out my other stock ideas on the right side until this trade is activated. I would love your feedback.
Disclaimer: "I am not a SEBI REGISTERED RESEARCH ANALYST AND INVESTMENT ADVISER."
This analysis is intended solely for informational and educational purposes and should not be interpreted as financial advice. It is advisable to consult a qualified financial advisor or conduct thorough research before making investment decisions.

ASTRAMICRO in Bullish modeHey Family, here’s another stock showing a strong technical setup! 🚀
📈 Stock: Astra Microwave Ltd (NSE: ASTRA)
🔍 Key Observations:
📊 Chart Pattern:
The chart shows a Horizontal Breakout from a long-term consolidation zone. This is a bullish continuation setup, signaling potential for further upside as the stock breaks above key resistance levels.
📈 Recent Price Action:
• The stock broke out last week, showing strong bullish momentum.
• This week’s price action indicates a healthy consolidation above the breakout level, suggesting buyer strength and continued interest.
• Volume activity supports the move, adding conviction to the breakout.
💡 Trading Recommendation:
Aggressive Entry:
• Enter based on current price structure to ride the breakout early.
• Use a stop-loss according to your risk tolerance and trading capacity.
Conservative Entry:
• Wait for a decisive move above the highlighted supply zone for confirmation.
• This approach helps minimize risk and confirms sustained strength.
🧠 Rationale:
The breakout from horizontal resistance, backed by solid price and volume structure, suggests a high-probability bullish continuation. Choose an entry style that aligns with your trading plan and risk profile.
🚨 Disclaimer: This is not financial advice. All views are shared for educational purposes only. Always do your own research and manage risk responsibly before making any trading decisions.
What is your view please comment it down and also boost the idea this help to motivate us.

LIC Share Price Analysis – Key Support & Resistance Levels🕒 Timeframe: Daily | Symbol: NSE:LICI
LIC stock is currently showing a consolidation pattern after a decent rally from previous lows. Price action suggests that the stock is preparing for a directional move. Traders should keep an eye on the following critical levels:
🔹 Support Zone: ₹807 – ₹830
This range has held strong multiple times, indicating buying interest around this zone. A breakdown below ₹723 could lead to a deeper correction.
🔹 Resistance Zone: ₹866 & ₹1000
LIC has struggled to sustain above ₹826. A breakout with volume above ₹866 may lead to bullish momentum toward ₹1000+.
📌 Trading Viewpoint:
✅ Bullish Bias if price sustains above ₹866 & ₹1000 with volume
⚠️ Bearish Below ₹723 (watch for a breakdown retest)
🛑 Disclaimer: This is for educational purposes only. Not financial advice. Do your own research before investing.
#LIC #LICShareAnalysis #LICI #TradingView #StockMarketIndia #SupportAndResistance #NSE #LICBreakout #LICStock #TechnicalAnalysis #SwingTrading

Grindwell Norton - Powerful RetestNSE:GRINDWELL Made Beautiful Chart Structure today before Q4 Results with Good Price and Volume action.
Price Action Analysis:
Base Formation and Breakout: a critical technical development with today's powerful price surge:
1. Base Structure: Grindwell Norton formed a well-defined horizontal base in the ₹1,750-1,800 range (highlighted in green), which has served as strong resistance since January 2025. This level has been tested multiple times and rejected, creating a clear technical ceiling.
2. Today's Retest: With a massive 14.67% gain, the stock has finally retested through this stubborn resistance zone after multiple failed attempts. This represents a significant technical event after approximately 4 months of price struggle at this level with Volumes.
3. Prior Downtrend Context: The Retest is especially meaningful as it comes after a prolonged downtrend from the ₹2,300 level in late 2024, indicating a potential trend reversal.
Volume Analysis:
The volume characteristics strongly support the Retest breakout's validity:
- Today's volume at 79.44K shares is substantially higher than normal trading activity
- The volume spike (visible as a large green bar at the bottom) coincides perfectly with the price breakout
- Prior resistance tests showed diminishing volume, indicating sellers were becoming exhausted
- The volume pattern shows classic accumulation characteristics before the breakout
Key Support and Resistance Levels:
Key Resistance Levels
1. Immediate Resistance: ₹1,900-1,950 (prior consolidation zone)
2. Intermediate Resistance: ₹2,100 (previous reaction high)
3. Major Resistance: ₹2,300 (52-week high)
Key Support Levels
1. New Support: ₹1,750-1,800 (previous resistance may likely to act as support - this is critical)
2. Secondary Support: ₹1,550-1,600 (consolidation zone from April)
3. Strong Support: ₹1,400 (major reaction low from February/March)
Technical Pattern Recognition:
The chart demonstrates a classic "break and retest" pattern:
- Initial drop below the ₹1,800 level in early 2025
- Multiple attempts to reclaim this level
- Extended period of base-building and consolidation
- Final powerful Retest on exceptional volume
This pattern often precedes sustained upward movements, particularly when the Retest breakout occurs on high volume, as seen today.
Accumulation Indicators:
Several signs of institutional accumulation appear in the chart:
- Increasing volume on up days versus declining volume on down days
- Formation of higher lows since the March bottom
- Clear volume divergence during the April-May consolidation phase
- Today's massive volume spike suggests strong institutional buying
Technical Outlook:
The combination of a decisive breakout from a multi-month base coupled with exceptional volume support suggests the potential for continued upward momentum. The prior resistance level at ₹1,750-1,800 should now function as support in any pullbacks.
Traders should closely monitor whether the stock can maintain positions above the breakout level in subsequent sessions, as this will confirm the pattern's validity and potential for a new uptrend toward the ₹2,000-2,100 range.
Keep in the Watchlist and on your Radar.
NO RECO. For Buy/Sell.
📌Thank you for exploring my idea! I hope you found it valuable.
🙏FLLOW for more
👍BOOST if useful
✍️COMMENT below with your views.
Meanwhile, check out my other stock ideas on the right side until this trade is activated. I would love your feedback.
Disclaimer: "I am not SEBI REGISTERED RESEARCH ANALYST AND INVESTMENT ADVISER."
This analysis is intended solely for informational and educational purposes and should not be interpreted as financial advice. It is advisable to consult a qualified financial advisor or conduct thorough research before making investment decisions.

KRISHANA PHOSCHEM LTD | Major Breakout Trade UpdateHey Family, here’s another stock showing a strong technical setup! 🚀
Key Observations:
Gain About From 279 to 348 (24% Approx.)
Pattern: Formation of a Rectangle Box Pattern on the Daily Timeframe (1D).
Volume Insight:
Noticeable volume accumulation over the past few sessions.
Volume spikes during breakout candles suggest strong buyer interest.
Candlestick Structure:
Strong bullish candles with minimal rejection indicate a genuine attempt to break out.
🚨 Disclaimer: What is your view please comment it down and also boost the idea this help to motivate us. We are Certified. All views shared on this channel are my personal opinion and is shared for educational purpose and should not be considered advise of any nature.
🚨 Note: Always manage risk and do your own research.

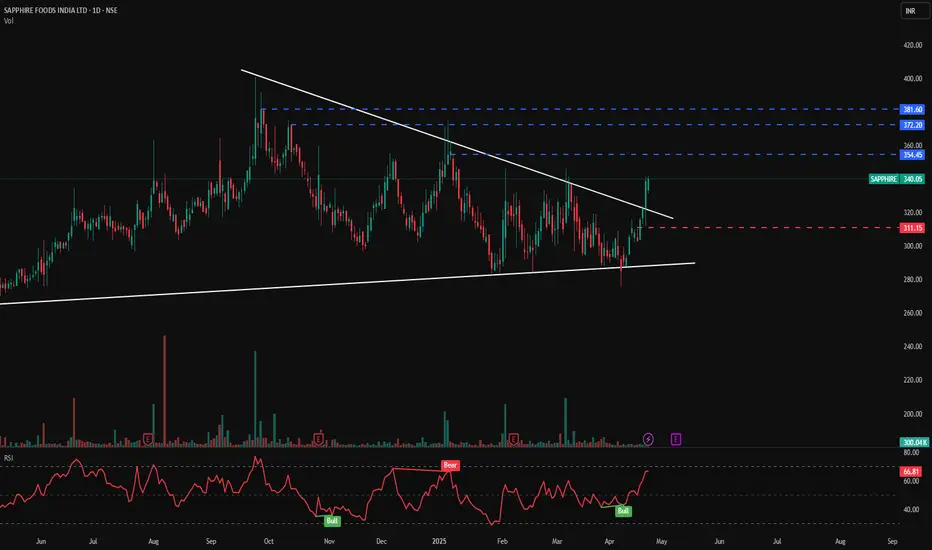
SAPPHIRE FOODS - Bullish Breakout From Falling Wedge📊 SAPPHIRE FOODS – Bullish Breakout from Falling Wedge
🕰️ Timeframe: 1D | 📉 Pattern: Falling Wedge Breakout
🔍 Technical Breakdown:
SAPPHIRE has broken out of a well-defined falling wedge pattern — a bullish reversal signal — backed by a sharp move on increased volume.
This wedge has been forming since early February, and the recent breakout above the upper trendline suggests renewed momentum and buying interest.
🔑 Key Technical Levels:
🔵 Resistance Zones (Upside Targets):
₹354.45
₹372.20
₹381.60
🔴 Support Zone:
₹311.15 (previous resistance turned support post-breakout)
⚪ Wedge Support Line: Well-held and now acting as a base for this breakout rally
📊 Volume & Indicator Insights:
🔺 Breakout is supported by a volume surge (300K), indicating institutional or smart money participation.
🔄 RSI at 66.81, nearing overbought territory but still in healthy uptrend range — confirming strength.
📉 RSI signals:
Bullish crossover (around ₹300) confirmed breakout
Prior “Bear” signal in Feb has now reversed to “Bull” (label shown)
🧠 Bias: Strongly Bullish
📍 Retest of ₹311–₹320 zone could offer re-entry opportunity with favorable risk-reward.
⚠️ Disclaimer: This chart is for educational purposes only. Please conduct your own due diligence or consult a professional before investing.
📈 Follow for more breakout pattern setups | PriceAction_Pulse
💬 Share your views on this wedge breakout in the comments!
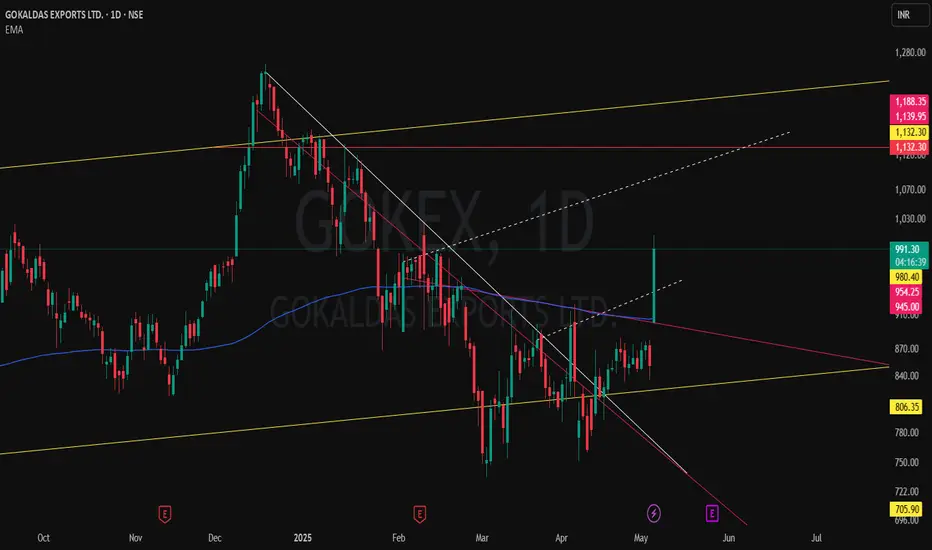
Massive Breakout Loading? GOKEX Smashes Through Triple TimeframeGOKALDAS EXPORTS LTD (GOKEX) is showing serious strength with a powerful breakout candle currently in play – but the real story is the multi-timeframe technical alignment:
📏 MTF Structure
Yellow Parallel Channel from Monthly shows a long-term structure still intact.
Red Horizontal Resistance marks the previous MTF peak – now under threat.
🔻 WTF Pressure
Pink Counter-Trendlines acted as significant resistance on the Weekly – both pierced.
⚡ DTF Precision
White CT Line (Daily) finally broken with conviction.
Dotted White Lines reveal multiple hidden resistances — all cleanly taken out by today's surge.
📊 Volume & Candle Strength
Volume spiking, price up over 16% intraday — just waiting on confirmation at close.
🧠 Watch Closely: A close above today’s highs could flip this into a full-blown A+ breakout setup.
Data Patterns - Trendline BO with High Vol. - Chart of the MonthNSE:DATAPATTNS showed good price action this month, breaking the trendline with high volumes, showcasing strength in this market. Defence Industry Stocks are showing relative strength and looking to continue that further, qualifying for my Chart of the Month.
About:
NSE:DATAPATTNS is one of the fastest-growing companies in the Defence and Aerospace Electronics sector in India. It is among the few vertically integrated defence
and aerospace electronics solutions providers catering to the indigenously developed defence products industry. It is focused on in-house development and manufacturing facilities led by innovation and design, and development efforts. It has been in business for over 35 years. It has supplied products catering to all the platforms, viz., space, air, land and sea, including products for LCA-Tejas.
Trade Setup:
Buy on Dips near Trendline Support or the base for Positional Traders and on breakout of the candle high for Swing Traders.
Target:
Around ATH Zones, ideally, if sustained,d can go further up.
Stop Loss:
Entry Candle Low For Swing Traders and Base Marked for Positional Traders.
📌Thank you for exploring my idea! I hope you found it valuable.
🙏FLLOW for more
👍BOOST if useful
✍️COMMENT below with your views.
Meanwhile, check out my other stock ideas on the right side until this trade is activated. I would love your feedback.
Disclaimer: "I am not SEBI REGISTERED RESEARCH ANALYST AND INVESTMENT ADVISER."
This analysis is intended solely for informational and educational purposes and should not be interpreted as financial advice. It is advisable to consult a qualified financial advisor or conduct thorough research before making investment decisions.

Clean Breakouts Don’t Lie — TFCILTDSupport Trendline holding beautifully from mid-2021.
CT (Counter Trendline) broken decisively this month with strong volume ✅.
Supply-Demand Zone (marked in green) retested and held.
Hidden Line (dotted pink) showing internal resistance structure — now taken out 🔥.
Current Structure:
A classic breakout with multiple confirmations — trend support, supply zone defense, CT break, hidden resistance breach — aligning well together.
🚀 As always, follow strict risk management. No trade is sure-shot — but structures like these offer probability edges.

WAAREE ENERGIES LTD - Cup Breakout with Rising RSI⚡ WAAREE ENERGIES LTD – Cup Breakout with Rising RSI
🕒 Timeframe: 1D | NSE: WAAREENER
📅 Date: April 22, 2025
💰 CMP: ₹2,444.20
📈 Volume: 2.15M
🔍 Chart Observations
☕ Cup Formation visible on the daily chart – smooth rounding bottom structure, signifying accumulation.
📐 Breakout from Downtrend Line confirms bullish intent with strong momentum and volume.
🧱 Key Levels
🔵 Resistance Zones (Targets):
₹2,674.55 – recent swing high
₹2,869.00 – key psychological resistance
🔴 Support Level:
₹2,229.60 – neckline of cup & breakout retest zone
📉 Trendline:
Long descending trendline (white) has been broken on the upside
📊 Technical Indicators
📈 RSI (Relative Strength Index)
Currently at 63.93, comfortably in bullish territory
Recent “Bull” label marks bullish RSI divergence & breakout
Still has room to rise before overbought zone
✅ Conclusion
Cup pattern breakout with strong volume & positive RSI = bullish structure
Sustained move above ₹2,444 could invite targets of ₹2,670+ in coming sessions
Ideal setup for swing traders with a clear SL below ₹2,229
📉 Chart by: PriceAction_Pulse
📘 For educational use only. Always DYOR before making any trading decisions.
