Breakout Alert on Ntpc Green LTD🔹 Counter Trendline Breakout (CT BO)
Price action has broken a well-respected counter trendline, indicating a potential shift in momentum from bearish to bullish. This breakout isn’t just symbolic — it's backed by conviction.
🔹 Volume-Based Confirmation
Today's bullish candle comes with significantly high volume, suggesting institutional activity and strong buyer interest. Volume is one of the most critical confirmation tools in breakout trading — and it's speaking loud and clear here.
🔹 Low → Higher Low → Breakout
A major Low was established earlier.
Price then formed a Higher Low Zone, indicating accumulation and a potential trend reversal.
The breakout candle confirms the Higher High – Higher Low (HH-HL) market structure — a classic signal of trend reversal and early uptrend formation.
🔔 Add to your watchlist.
📍 Mark the breakout zone.
📈 Let price action guide your decision.
Tradingview

GRSE - Chart of the Week, Breaking Trendline and Made a BaseNSE:GRSE has a beautiful structure on the Weekly Timeframe to Qualify for my Chart of the Week idea, it saw Decent Volumes this week around the marked Key Levels of 100 WSMA and also broke the trendline with RSI Trending Upwards.
About:
NSE:GRSE is a premier shipbuilding company in India under the administrative control of the Ministry of Defence, primarily catering to the shipbuilding requirements of the Indian Navy and the Indian Coast Guard.
NSE:GRSE is a diversified, profit-making and the first Shipyard in the country to export warships and deliver 100 warships to the Indian Navy and Indian Coast Guard.
Trade Setup:
Could be a good Positional Trade with the 100 WSMA Being a Major Support along with Marked Key Levels, Buy on Dips as the Entire Defense Sector is in an Uptrend and it Broke the Trendline Strongly this week.
📌Thank you for exploring my idea! I hope you found it valuable.
🙏FLLOW for more
👍BOOST if useful
✍️COMMENT Below your views.
Meanwhile, check out my other stock ideas on the right side until this trade is activated. I would love your feedback.
Disclaimer: "I am not SEBI REGISTERED RESEARCH ANALYST AND INVESTMENT ADVISER."
This analysis is intended solely for informational and educational purposes only and should not be interpreted as financial advice. It is advisable to consult a qualified financial advisor or conduct thorough research before making investment decisions.

Archean Chemical - Chart of the WeekNSE:ACI has a beautiful structure in the Weekly Timeframe that qualifies for my Chart of the Week idea. It saw Decent Volumes this week and closed above its recent swing high, with RSI and MACD Trending Upwards and Closing Above all Major Short moving Averages, breaking the Trendline.
About:
NSE:ACI is India's largest exporter of bromine and industrial salt in Fiscal 2021. The company is the leading specialty marine chemical manufacturer in India and is focused on producing and exporting bromine, industrial salt, and sulphate of potash to customers around the world.
Brokerage View:
ICICI Securities research report on Archean Chemical Industries
ACI has a plethora of opportunities – each carrying strong value creation potential – along its path ahead. Right off the bat, the expansion in bromine derivatives, and thus, higher captive bromine consumption would likely provide a strong fillip to ACI’s bromine business. Separately, Oren shall help cater to chemicals’ demand for O&G exploration services along with bromine compounds. Also, the success in its SOP flotation process could unlock extensive value. Further, its foray into SiC chip production – likely production FY28E onwards – would place ACI among the few Indian producers in semiconductors.
Outlook:
It is also exploring a giga-factory in ZincGel batteries using zinc-bromide electrolyte, which exhibits synergies with its bromine. In our view, the stock has little to lose due to undemanding valuations (12.8x FY27E PE). Retain BUY and TP of INR 675 (based on 15x FY27E EPS).
Trade Setup:
It has broken the falling trendline and respected a Major Support Zone, Buy on Dips will the way to play this counter because of the uncertain environment of trump tariffs.
Stop Loss:
Swing Low Levels around the Levels Marked on a Weekly Closing Basis only.
📌Thank you for exploring my idea! I hope you found it valuable.
🙏FLLOW for more
👍BOOST if useful
✍️COMMENT below with your views.
Meanwhile, check out my other stock ideas on the right side until this trade is activated. I would love your feedback.
Disclaimer: "I am not SEBI REGISTERED RESEARCH ANALYST AND INVESTMENT ADVISER."
This analysis is intended solely for informational and educational purposes and should not be interpreted as financial advice. It is advisable to consult a qualified financial advisor or conduct thorough research before making investment decisions.

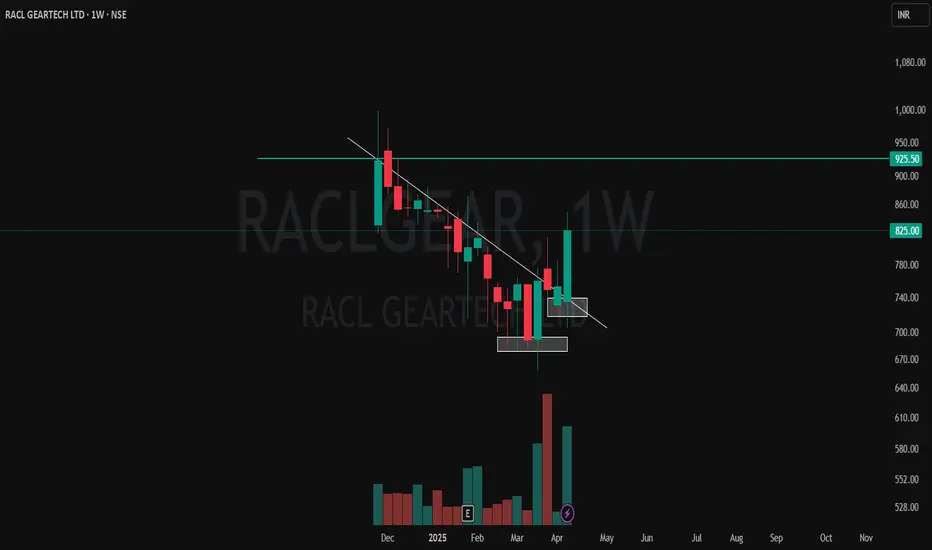
Simple CT-Based Price Action Breakout | Volume + Price Alignment✅ White Line: Represents a well-respected CT trendline — multiple touches before finally getting broken with conviction.
✅ Volume Breakout: Strong volume spike confirms the breakout — classic case of price and volume moving in sync.
✅ White Zones: Marking clear Higher Low formations — price respecting structure before launching up.
✅ Green-Cyan Line: Marks a multi-timeframe supply zone. This level will be critical for continuation or rejection watch.
Structure, volume, and context are lining up — keeping this one on radar for further price action development. 📊
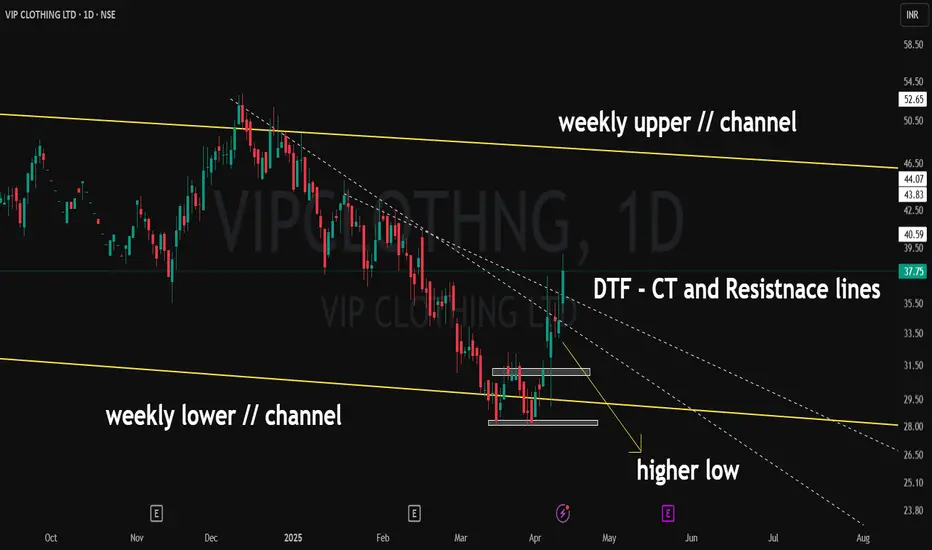
Vip Clothing - Power Breakout🟡 WTF Parallel Channel
The stock was respecting a long-term descending parallel channel (yellow lines), and recently took support off the lower boundary.
📉 Higher Low Formed
It created two clear demand zones (marked boxes), confirming higher lows — a classic signal of accumulation and reversal strength.
📊 Supply Zone Broken
Not just any breakout — it smashed through the supply zone with strong bullish candles, showing conviction and volume support.
📐 Trendline Breakout
Today, it broke out of the counter trendline (CT) and the descending resistance (2 dotted lines) — both gone in a single strong move, putting it in a clear breakout zone.
🎯 What's Next?
Kalyan - Pullback SwingNSE:KALYANKJIL today gave a Breakout of Falling Trendline and Closed above its Swing Highs With Good Volumes after Making a Base Just Around The Same Levels Previously in One Sided Fall From Top. Today closed above 50 DEMA with RSI trending upwards.
About:
NSE:KALYANKJIL designs, manufactures, and sells a range of gold-studded and other jewellery products at various prices. It is one of the largest jewellery retailers in India.
F&O Activity:
Significant Long Buildup With 460 PE OI Increasing Significantly.
Trade Setup:
Can Swing Back to 200 DSMA as it failed last time? Visible on Charts, it may create the same swing, and if sustained, it can further give good swing results. The season is on.
Target (Take Profit):
Around 200 DSMA, i.e 600 Levels as of Now
Stop Loss:
Swing Low Base as Shown.
📌Thank you for exploring my idea! I hope you found it valuable.
🙏FLLOW for more
👍BOOST if useful
✍️COMMENT Below with your views.
Meanwhile, check out my other stock ideas on the right side until this trade is activated. I would love your feedback.
Disclaimer: "I am not SEBI REGISTERED RESEARCH ANALYST AND INVESTMENT ADVISER."
This analysis is intended solely for informational and educational purposes and should not be interpreted as financial advice. It is advisable to consult a qualified financial advisor or conduct thorough research before making investment decisions.

Tata Consumer Prod. - Chart of the WeekNSE:TATACONSUM has a beautiful structure in the Weekly Timeframe that qualifies for my Chart of the Week idea. It saw Decent Volumes this week and closed above its recent swing high, with RSI and MACD Trending Upwards and Closing Above all Major Moving Averages.
About:
NSE:TATACONSUM is one of the leading companies of the Tata Group, with presence in the food and beverages business in India and internationally. It is the second-largest tea company globally and has significant market presence and leadership in many markets. In addition to South Asia (mainly India), it has presence in various other geographies including Canada, the UK, North America, Australia, Europe, the Middle East and Africa.
F&O Activity:
Significant Shorts are getting covered with 1050 PE OI Increasing Significantly.
Trade Setup:
It is Forming Like a Falling Wedge, it can test the upper edge and can give a good swing towards
1186-1190 Levels. So buy on Dips Until it closes below the Swing Low, ideally around the Marked Green Levels.
Target(Take Profit):
Around the Upper Edge of the Falling Wedge.
Stop Loss:
Swing Low Levels around 950-930.
📌Thank you for exploring my idea! I hope you found it valuable.
🙏FLLOW for more
👍BOOST if useful
✍️COMMENT below with your views.
Meanwhile, check out my other stock ideas on the right side until this trade is activated. I would love your feedback.
Disclaimer: "I am not SEBI REGISTERED RESEARCH ANALYST AND INVESTMENT ADVISER."
This analysis is intended solely for informational and educational purposes and should not be interpreted as financial advice. It is advisable to consult a qualified financial advisor or conduct thorough research before making investment decisions.

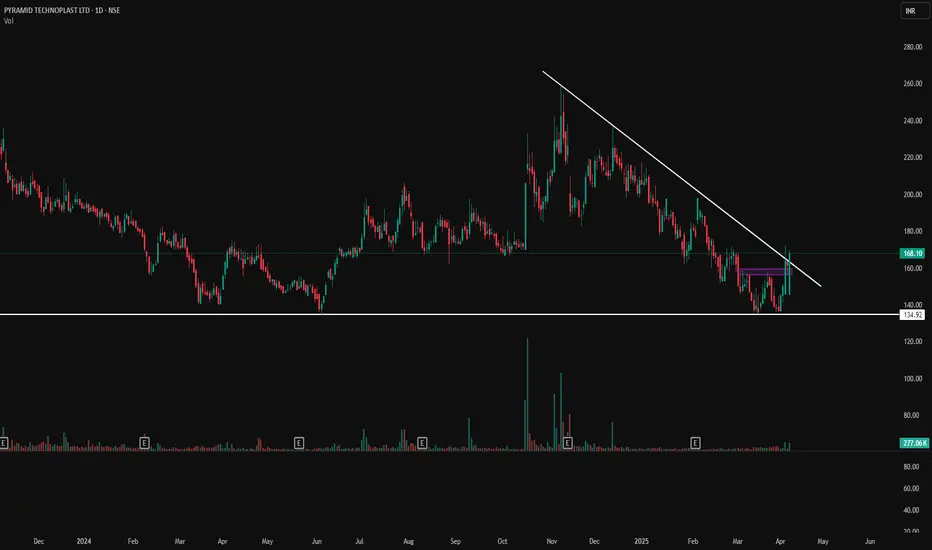
Pyramid Technoplast Ltd - Falling Trendline Breakout!Pyramid Technoplast Ltd – Falling Trendline Breakout! 💥
📅 Date: April 8, 2025
📊 Chart Analysis:
The stock has successfully broken out of a long-term falling trendline, indicating a potential reversal of the previous downtrend. This move is backed by strong bullish candles and an increase in volume.
📌 Key Levels:
📉 Major Support: ₹134.92
🔄 Previous Resistance/Flip Zone: ₹160-165 (now acting as support)
📈 Immediate Resistance Levels: ₹180, ₹195, ₹210
📈 Technical Indicators & Patterns:
Falling Trendline Breakout visible with strong bullish momentum.
Volume confirmation indicates institutional interest.
Price closing above ₹165 can lead to further upside.
🔍 Volume Insight:
Volume surged to 277K, which is significantly higher than the average, adding credibility to the breakout.
🚀 Potential Setup:
If price holds above ₹165–₹168, next targets could be ₹180 and ₹195.
Pullback toward ₹160–₹165 zone can be seen as a retest and buying opportunity.
📌 Disclaimer: This is for educational and analysis purposes only. Always consult your financial advisor before making investment decisions.
XAU/USD Holding Above $3,050 – Breakout or Pullback Next?XAU/USD Update 📊
Gold just touched $3,061 and is now hovering around $3,056. Price is holding within the ascending channel, showing signs of consolidation.
🟢 Bullish Scenario: If buyers defend this level, we could see another push toward $3,100+, with $3,153 still in play as a key resistance.
🔴 Bearish Risk: A break below $3,050 - $3,020 could trigger a deeper correction toward $2,980, where stronger demand may step in.
📉 Watching price action closely—let’s see how it reacts from here! 🚀

Sumitomo Chemical - Chart of the MonthNSE:SUMICHEM showed good price action this month, showcasing strength in this market and looking to continue that further, hence qualifying for my Chart of the Month.
About:
NSE:SUMICHEM is one of the leading players in the industry, which has a balanced portfolio of technical and formulation products along with backward integration for some products.
The Company is known for domestic marketing of proprietary products of its Japanese parent, TSE:4005 in agrochemicals, animal nutrition, and environmental health business segments. With the integration of Excel Crop Care Limited, the Company now has a strong portfolio of generics in addition to specialty products and a strong combined marketing network.
Trade Setup:
It crossed major Swing High Levels this Month and is now looking to cross ATH, RSI & MACD Trending Upwards. Buy on DIPS can be done if it consolidates. The Base Formed Will be an Ideal Stop Loss.
Target:
Around 672 Levels can book a partial at the ATH Zones.
Stop Loss:
Entry Candle Low For Swing Traders and Base Marked for Positional Traders.

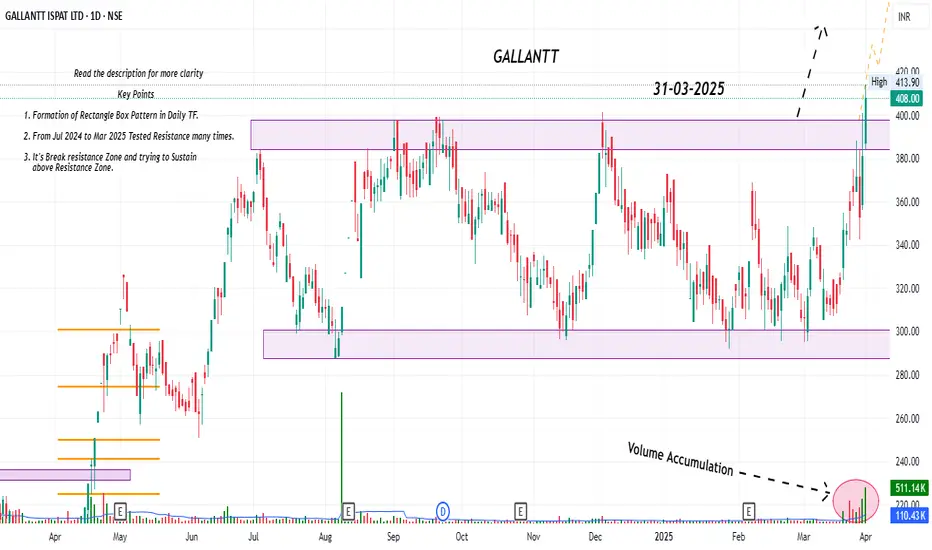
GALLANTT Breakout Possible with a good upside potentialHey Family, there is a one more stock Which is showing a great opportunity.
Key Points:-
* Formation of Rectangular box Pattern in Daily TF.
* From Jul 2024 to Mar 2025 its in range.
* From Jul 2024 to Mar 2025 Tested & Moving Near Resistance Many times.
* It's Break resistance Zone and trying to sustain above Resistance Zone, Only Enter when good volume good closing.
* Volume is Rising (Volume Accumulation).
What is your view please comment it down and also boost the idea this help to motivate us. We are Certified. All views shared on this channel are my personal opinion and is shared for educational purpose and should not be considered advise of any nature.
HDFC Bank - Swing Trade NSE:HDFCBANK is looking Super Strong on the Daily time frame after forming a perfect base today it broke out and closed significant levels with MACD and RSI Trending Upwards it Can retest its ATH Levels soon.
About:
NSE:HDFCBANK is an Indian banking and financial services company headquartered in Mumbai. It is India's largest private sector bank by assets and the world's tenth-largest bank by market capitalization as of May 2024.
As of April 2024, NSE:HDFCBANK has a market capitalization of $145 billion, making it the third-largest company on the Indian stock exchanges. It is India's one of 3 systemically important banks with a 15% market share in the banking sector’s advances and a 37% market share in the private sector banks’ advances as of FY24.
F&O Activity:
Short's Getting Covered in Futures with decreasing OI with 1740 CE OI covering Significantly.
Trade Setup:
Buy on Dips if Possible Near Base Levels or Start with a Few Qty to see the momentum if continues further Sharply or Consolidates.
Target(Take Profit):
Ideally around ATH Levels near 1860 to 1880 Levels
Stop Loss:
Entry Candle Low for Swing Traders and Swing Low Base Formed as Mentioned for Positional and Buy on Dips Traders.
📌Thank you for exploring my idea! I hope you found it valuable.
🙏FLLOW for more
👍BOOST if useful
✍️COMMENT Below your views.
Meanwhile, check out my other stock ideas on the right side until this trade is activated. I would love your feedback.
Disclaimer: "I am not SEBI REGISTERED RESEARCH ANALYST AND INVESTMENT ADVISER."
This analysis is intended solely for informational and educational purposes only and should not be interpreted as financial advice. It is advisable to consult a qualified financial advisor or conduct thorough research before making investment decisions.

WHY DO 97% OF TRADERS LOSE MONEY IN THE MARKET?🧠 WHY DO 97% OF TRADERS LOSE MONEY IN THE MARKET?
And what should you truly prepare before you begin?
You’ve probably heard this one before:
“97% of traders lose money.”
Not because they’re not smart.
Not because they lack a good strategy.
But because they enter the market with the wrong mindset and unrealistic expectations.
❌ The market is not a gold mine — not for everyone
Many people step into trading thinking:
“Forex is a money printer. Anyone can just come in and take what they want.”
But here’s the truth:
👉 The market doesn’t hand out profits. It takes money from the unprepared and gives it to the disciplined.
It doesn’t care about your dreams — it only respects your readiness.
💸 You will lose money — and it will sting
Even if you believe your strategy is solid, it will fail at some point.
And when it does, the price you pay is real money — your own money.
And because it’s your hard-earned money, you’ll feel the pain. You’ll get emotional.
You’ll want to get it back. You’ll enter trades impulsively.
And that’s exactly when the market will drag you by the nose.
⚠️ The biggest mistake: thinking a good strategy is enough
Most new traders believe:
“Once I have a working strategy, I’ll be consistently profitable.”
But the truth is:
Every strategy fails sometimes
The market doesn’t follow your logic
A bad entry isn’t what ruins you — refusing to cut the loss is
🧘♂️ So what should you actually prepare before trading?
If you’re about to start trading — or afraid to fail early — make sure to prepare:
✅ A solid foundation of knowledge
✅ A mindset that accepts loss without losing control
✅ The ability to say: “It’s okay to lose a trade — I just need to survive long enough to learn and grow.”
📌 Other people’s strategies won’t make you profitable
Yes, I often share my outlooks, plans, and even potential entry zones.
But always remember:
My view is just a perspective — not a guarantee of success.
Trading is personal.
You’ll only become consistently profitable when:
You trust in a system you’ve practiced yourself
You take trades because you see the logic, not because someone else agrees with you
🔄 Trading is a process: Try – Fail – Learn – Repeat
I’ve lost. I’ve been stubborn. I’ve gotten emotional.
And I learned:
You don’t need to win all the time.
You just need to survive your losses and come back smarter.
A stop-loss isn’t failure.
It’s the most mature decision you can make in a chaotic environment.
🤝 I won’t promise that you’ll make money
The knowledge I share — the views I post —
may not make you rich.
But I believe:
They can help you avoid losing money needlessly.
Don’t believe anyone 100% — not even me.
Take what you learn, test it, and turn it into your own conviction.
That’s how you grow.
❤️ Final thoughts
Trading isn’t a game of prediction — it’s a test of psychology.
You don’t have to be the best trader.
You just need to protect your capital, protect your mindset, and keep showing up.
Wishing you all a peaceful weekend with your loved ones.
Tomorrow, we return to the market — sharper, calmer, and more disciplined.
The market will always be there. The real question is: will you still be here to trade it next month, next year?
— AD | Money Market Flow

XAU/USD 1H – Bullish Continuation from Demand Zone?📊 XAU/USD (Gold) 1H Analysis – Bullish Continuation Setup
🔹 Market Structure: Gold has been in a strong uptrend, with price currently consolidating near a key demand zone.
🔹 Key Levels:
🔴 Resistance: $3,050 - $3,060 (Potential target)
🟣 Demand Zone: $3,030 - $3,035 (Support area)
🟠 Deeper Support: $3,025 (Break below weakens bullish bias)
📈 Potential Trade Setup:
1️⃣ A possible pullback into the demand zone could attract buyers.
2️⃣ Price may wick below liquidity before reversing.
3️⃣ If support holds, we anticipate a move toward $3,050+.
✅ Entry Zone: $3,030 - $3,035
🎯 Target: $3,050 - $3,060
🚨 Stop Loss: Below $3,025
⚠️ Watch for price action confirmation before entering. A strong bullish candle from support could signal entry. Let the market show its hand! 🚀✨

DOMS - ABCD Pattern, Crossing Swing Highs.NSE:DOMS Crossing Swing Highs with Strong Candles With RSI and MACD Trending Upwards and according to ABCD Pattern it's Likely to Cross ATH in Short Term.
About:
Incorporated in 2006, NSE:DOMS is a stationery and art product company primarily engaged in designing, developing, manufacturing, and selling a wide range of these products under the flagship brand, NSE:DOMS is the 2nd largest player in India’s branded 'stationery and art' products market. It held 29% and 30% market share for its core products in FY23 for pencils and mathematical instrument boxes.
Trade Setup:
A Swing Trade Can be Done as per the ABCD Pattern and Bullish Price Action. Keep Position Size as Per Appetite.
Target (Take Profit):
Near ATH Levels of 3115
Stop Loss:
Entry Candle Low for Aggressive Swing Traders and Swing Low in General.
📌Thank you for exploring my idea! I hope you found it valuable.
🙏FLLOW for more
👍BOOST if useful
✍️COMMENT Below your views.
Meanwhile, check out my other stock ideas on the right side until this trade is activated. I would love your feedback.
Disclaimer: "I am not SEBI REGISTERED RESEARCH ANALYST AND INVESTMENT ADVISER."
This analysis is intended solely for informational and educational purposes only and should not be interpreted as financial advice. It is advisable to consult a qualified financial advisor or conduct thorough research before making investment decisions.

Tata Steel - Swing TradeNSE:TATASTEEL today looked good technically on the back of China announcing that it would restructure its steel industry to cut its total output. The latest move by China is expected to reduce the dumping of cheap steel into the Indian market, which would act as a major positive for domestic steel companies.
About:
NSE:TATASTEEL is Asia's first integrated private steel company set up in 1907. The company has a presence across the entire value chain of steel manufacturing from mining and processing iron ore and coal to producing and distributing finished products. The company has a target to increase domestic steelmaking capacity to 30 MnTPA by 2025.
Trade Steup:
It Made Good Short Term Base on Daily Charts and Taking Support of 50 DSMA and MACD Trending Upwards Now Looking Good for a Swing Trade.
F&O Activity:
Long Buildup Seen in Futures With 140 PE Gaining Significant OI Addition.
Target (Take Profit):
Around 158 for Positional Trader and 200 DSMA for Swing Trader
Stop Loss:
Entry Candle Low for Swing Trader and 50 DSMA for Positional Trader.
📌Thank you for exploring my idea! I hope you found it valuable.
🙏FLLOW for more
👍BOOST if useful
✍️COMMENT Below your views.
Meanwhile, check out my other stock ideas on the right side until this trade is activated. I would love your feedback.
Disclaimer: "I am not SEBI REGISTERED RESEARCH ANALYST AND INVESTMENT ADVISER."
This analysis is intended solely for informational and educational purposes only and should not be interpreted as financial advice. It is advisable to consult a qualified financial advisor or conduct thorough research before making investment decisions.

Triveni Turbine - Chart of the Week NSE:TRITURBINE has a beautiful structure on the Weekly Timeframe to Qualify for my Chart of the Week idea, it saw Decent Volumes around the marked Key Levels which is 0.786% Fib Retracement Levels and also a Rising trendline which has been defending since June 2022 Several Times.
About:
NSE:TRITURBINE primarily manufactures and supplies power-generating equipment and solutions. It was a division of NSE:TRIVENI since the 1970s and was demerged w.e.f from Oct 2010 into a separate entity.
Trade Setup:
Could be a good Positional Trade with the Rising Trendline Being a Major Support along with FIb Levels.
📌Thank you for exploring my idea! I hope you found it valuable.
🙏FLLOW for more
👍BOOST if useful
✍️COMMENT Below your views.
Meanwhile, check out my other stock ideas on the right side until this trade is activated. I would love your feedback.
Disclaimer: "I am not SEBI REGISTERED RESEARCH ANALYST AND INVESTMENT ADVISER."
This analysis is intended solely for informational and educational purposes only and should not be interpreted as financial advice. It is advisable to consult a qualified financial advisor or conduct thorough research before making investment decisions.

GSK Pharma - Chart of the MonthNSE:GLAXO has a beautiful structure on the Monthly Timeframe to Qualify for my Chart of the Month idea, it saw Heavy Volumes around the marked Key Levels which broke out and retested went to ATM and Again Retested and Bounced from that Place With Volumes in Last Month.
Also if we Use Fibonacci retracement it bounced from Crucial 0.618 Levels.
About:
NSE:GLAXO researches, manufactures and makes available a broad range of medicines and vaccines that benefit people, It's a Leading Global healthcare company part of GlaxoSmithKline plc (GSK), a British multinational pharmaceutical company headquartered in London.
Trade Setup:
Could be a good Positional Trade with those Key Levels as Major Support and AIM for New ATH.
📌Thank you for exploring my idea! I hope you found it valuable.
🙏FLLOW for more
👍BOOST if useful
✍️COMMENT Below your views.
Meanwhile, check out my other stock ideas on the right side until this trade is activated. I would love your feedback.
Disclaimer: "I am not SEBI REGISTERED RESEARCH ANALYST AND INVESTMENT ADVISER."
This analysis is intended solely for informational and educational purposes only and should not be interpreted as financial advice. It is advisable to consult a qualified financial advisor or conduct thorough research before making investment decisions.

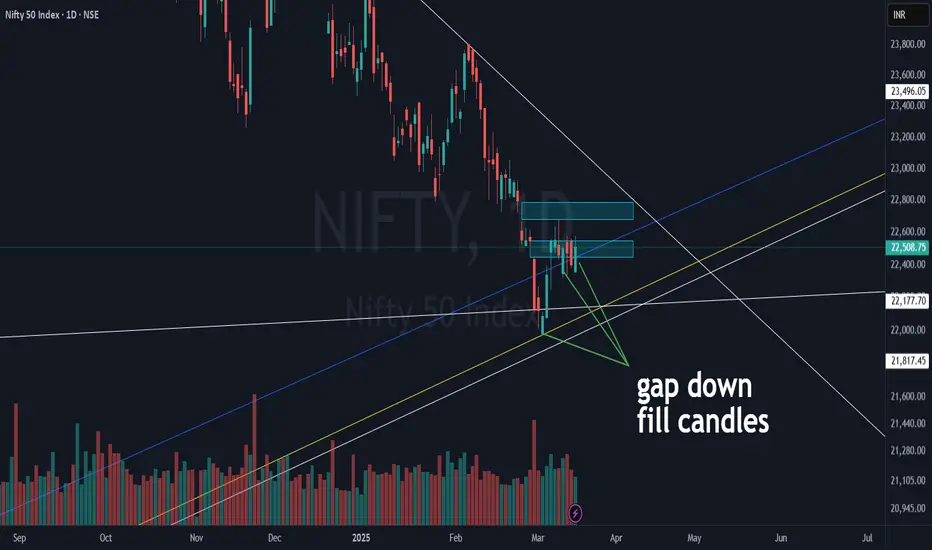
NIFTY 50 | Critical Levels & Gap-Fill Zones in Play!Nifty 50 continues to react strongly to key levels, but the overall structure still remains in correction mode. Let’s break it down:
White Lines (DTF Trendlines) ⚪:
2 key support lines and 1 counter-trendline (CT).
The DTF CT (near-term resistance) is around 500 points away from CMP, making it the next big test for bulls.
Blue & Yellow Trendlines (WTF & MTF Support) 📉:
A cluster of support created a bounce, but not as strong as past recoveries seen in 2023 or early 2024.
Despite FII selloffs & global stress, technical levels are holding up well!
Gap Zones (Blue Boxes) 📦:
The nearest gap got filled, and the next one sits just below our DTF white CT.
This could act as a magnet for price action in the near term.
Gap Down Fill Candles :
A few gaps got filled in a single session, showing bullish pressure at lower levels.
But, without a higher high - higher low structure or a DTF white CT breakout, the index stays in a corrective phase.
XAU/USD Bullish Outlook: Wyckoff Accumulation & Breakout PotentXAU/USD (Gold) - 2H Chart Analysis 🏆📈
🔹 Wyckoff Structure Insight
The chart shows signs of a Wyckoff Accumulation phase.
UTAD (Upthrust After Distribution) at the previous highs suggests a liquidity grab.
Test of the resistance level before a strong rejection downward.
SOW (Sign of Weakness) was observed, but buyers regained control.
🔹 Key Technical Levels
Fair Value Range marked below, showing a potential area of demand.
Unfilled Imbalance (EMB unfilled) signals an area where price might revisit before continuing upward.
Gap below indicates a previous liquidity sweep before the bullish reversal.
🔹 Trend & Price Action
Current price action is showing higher lows and bullish structure development.
Projected bullish move 📈 is expected to test the $2,940+ region.
🔹 Trading Bias: Bullish ✅
A retracement to the EMA or minor pullback could offer re-entry opportunities.
Invalidation level: Below $2,900, where momentum could shift bearish.
🚀 Gold remains strong; watch for breakouts above $2,940!

Voltas - Reversal Trade after Gap Filling Made a BaseNSE:VOLTAS today confirmed making a base and Sharp Reversal From it after Filling the gap formed on daily charts in April 2024, the MACD has Become Positive and is trending Upwards along with RSI Showing Strength after the CLSA Report on the Indian Summer Season.
It says India's warmest February in 124 years could spur a demand uptick in cooling product categories like air-conditioners, air-coolers, refrigerators and fans
The weather office has warned of further rise in temperature and heatwave days going ahead.
About:
NSE:VOLTAS is engaged in the business of air conditioning, refrigeration, and electro-mechanical projects as an EPC contractor both in domestic and international geographies (Middle East and Singapore) and engineering product services for mining, water management and treatment, construction equipment and textile industry.
NSE:VOLTAS was created 6 decades ago when Tata Sons joined hands with a Swiss company Volkart Brothers. Voltas is also one of the most reputed engineering solution providers specializing in project management. The company has 5,000+ Customer sites actively managed across India.
F&O Activity:
Shorts in the System Getting Covered with 1400 & 1420 CE OI being Shed.
Trade Setup:
Looks like a good 1:1 Risk - Reward Trade, may find some Resistance Towards 200 DSMA so Swing till there can be played, if sustained and even go further.
Target(Take Profit):
Around 200 DSMA for Swing Trade and around 1700-1706 for Positional Trader.
Stop Loss:
Entry Candle Low for Swing Traders and Swing Low Levels Marked for Positional Traders.
📌Thank you for exploring my idea! I hope you found it valuable.
🙏FLLOW for more
👍BOOST if useful
✍️COMMENT Below your views.
Meanwhile, check out my other stock ideas on the right side until this trade is activated. I would love your feedback.
Disclaimer: "I am not SEBI REGISTERED RESEARCH ANALYST AND INVESTMENT ADVISER."
This analysis is intended solely for informational and educational purposes only and should not be interpreted as financial advice. It is advisable to consult a qualified financial advisor or conduct thorough research before making investment decisions.

Sarda Energy - Swing TradeNSE:SARDAEN today broke key levels with good levels, it again took support near the base where it is being accumulated and is trading in a Flat Channel which makes this a good swing to the upper edge of the Flat Channel if the Flat Channel is broken it can give a good Swing Up again so keep in watchlist and can buy again at lower level of the channel if retraced.
About:
Incorporated in 1973, NSE:SARDAEN is the flagship company of Sarda Group and is engaged in the production of steel, ferro alloys and power.
Trade Setup:
Good be a Good Typical Flat Channel Trade With RSI and MACD Trending Up with Good Volumes.
Target(Take Profit):
Short Swing towards 525 (ATH) and if Flat Channel is Broken Can Give Further Upswing.
Stop Loss:
Today's Candle Low i.e. 473 or Entry Candle Low if Trade Taken in Retracement.
📌Thank you for exploring my idea! I hope you found it valuable.
🙏FLLOW for more
👍BOOST if useful
✍️COMMENT Below your views.
Meanwhile, check out my other stock ideas on the right side until this trade is activated. I would love your feedback.
Disclaimer: "I am not SEBI REGISTERED RESEARCH ANALYST AND INVESTMENT ADVISER."
This analysis is intended solely for informational and educational purposes only and should not be interpreted as financial advice. It is advisable to consult a qualified financial advisor or conduct thorough research before making investment decisions.

BTC/USD Breakdown! Bearish Target: $78K🔍 BTC/USD 30-Minute Chart Analysis
📉 Market Structure:
The chart displays an ABCDE corrective pattern, likely a descending wedge or contracting triangle, which has now broken to the downside.
Price action shows a breakout below the wedge, leading to further bearish momentum.
The 200-period moving average (red line) is acting as resistance, reinforcing the downward trend.
📊 Current Price: ~$83,057
🔻 Bearish Target: $78,049 (marked as the potential support level)
🛑 Key Observations:
Rejection from wave E indicates a lack of bullish strength.
Lower highs and lower lows confirm a continuation of the bearish trend.
Potential retest of ~$85,000 before dropping further.
🚀 Trading Insights:
Bearish Bias: Short opportunities on pullbacks toward resistance.
Bullish Reversal? Look for price action near $78,049—if buyers step in, a potential bounce could occur.
⚠️ Watch out for:
Sudden Bitcoin volatility (news-driven moves).
A fake breakdown (if buyers reclaim above ~$85,000).
