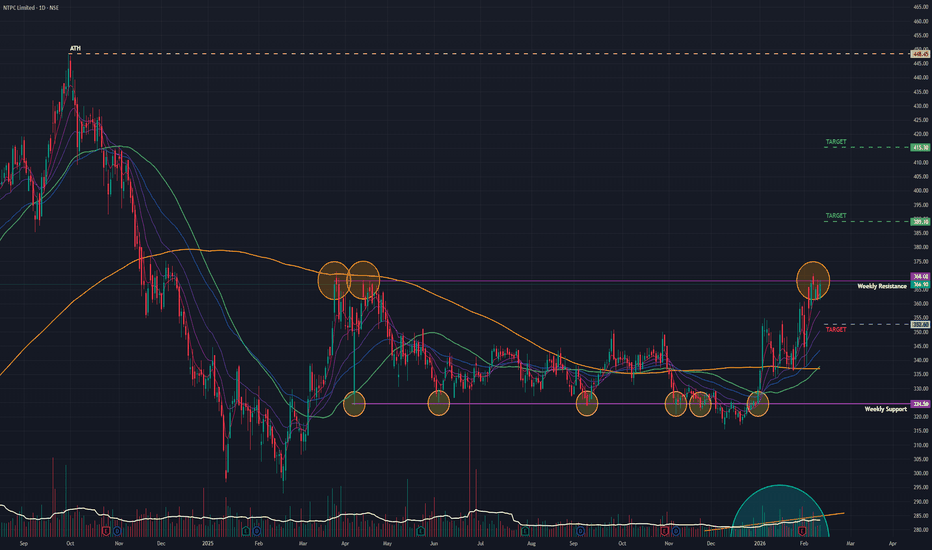
NTPC (D): Bullish (Golden Crossover + Base Breakout)(Timeframe: Daily | Scale: Linear)
The stock is on the verge of a major structural breakout from a 10-month consolidation base. The occurrence of a Golden Crossover (50 SMA > 200 SMA) confirms that the long-term trend has officially shifted from "Correction" to "Uptrend."
🚀 1. The Fundamental Catalyst (The "Why")
The technical strength is supported by solid numbers:
> Q3 Earnings Support: The recent Q3 FY26 results (Jan 30) showed stable operational performance with an 8% profit jump. This removed the "Event Risk," allowing institutions to re-enter.
> Valuation Comfort: Trading at a P/E of ~14.5x, NTPC remains attractive compared to private power peers. The dividend of ₹2.75 (Record Date: Feb 6) has also kept the stock supported.
> Monitorable (NGEL): Note that its subsidiary, NTPC Green Energy (NGEL) , is currently trading weak (around ₹89-90). A reversal in NGEL would act as an additional booster for NTPC.
📈 2. The Chart Structure (The Box)
> The Base: ₹315 – ₹370 range. The stock spent nearly a year in this zone.
> The Resistance: The ₹370 – ₹372 level is the "Lid." (This also aligns with the recent 52-week high in Mar 2025).
- Current Status: The stock is knocking on this door. A close above ₹372 will trigger a "Box Breakout."
📊 3. Volume & Indicators
> Golden Crossover: The 50-Day SMA crossing the 200-Day SMA is the headline signal. Historically, for PSU stocks, this signal often precedes a 15-20% rally over the next 3-6 months.
> RSI: Rising in all timeframes. It has room to run before hitting "Extreme Overbought" levels (80+).
🎯 4. Future Scenarios & Key Levels
The stock is primed for a new leg up.
🐂 Bullish Targets (The Breakout):
- Trigger: A decisive Daily Close above ₹372.
- Target 1: ₹390.
- Target 2: ₹415.
🛡️ Support (The "Must Hold"):
- Immediate Support: ₹352. this is a strong swing low.
- Stop Loss: A close below ₹345 (200-Day SMA) would invalidate the Golden Cross and signal a "Bull Trap."
Conclusion
This is a High-Reliability Setup.
> Refinement: The Golden Cross makes this a "Portfolio Grade" buy signal, not just a swing trade.
Trend Analysis
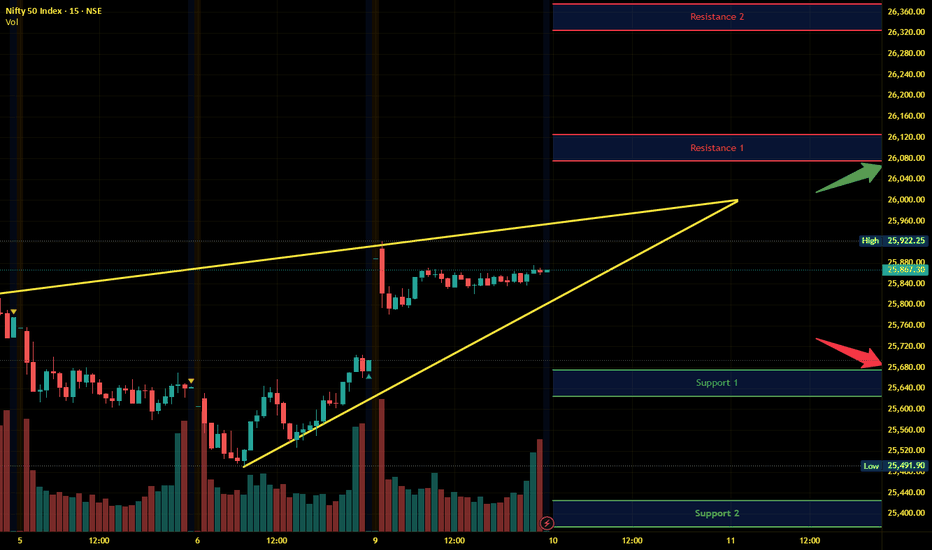
Nifty Intraday Analysis for 10th February 2026NSE:NIFTY
Index has resistance near 26075 – 26125 range and if index crosses and sustains above this level then may reach near 26325 – 26375 range.
Nifty has immediate support near 25675 – 25625 range and if this support is broken then index may tank near 25425 – 25375 range.
Expect a range-bound market as we monitor whether the small gap from 9th February gets filled or holds as support.
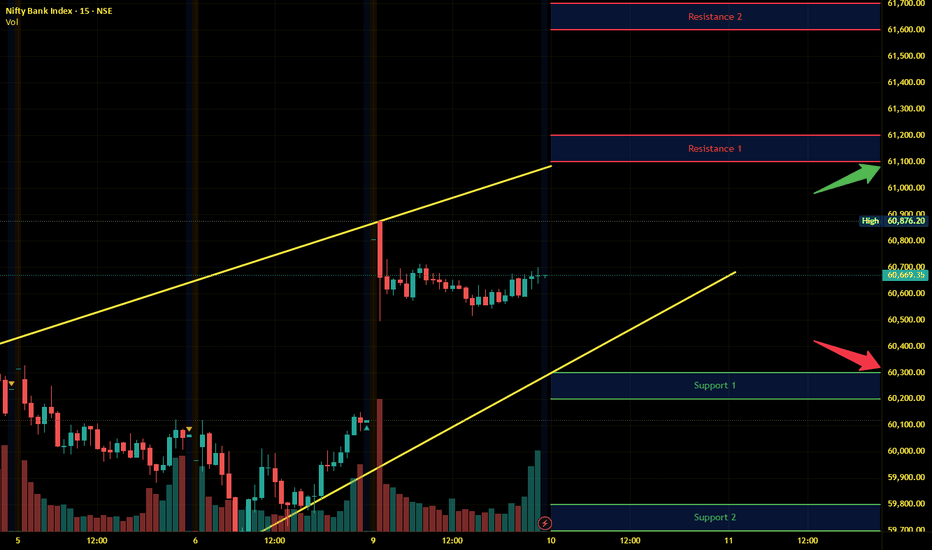
Banknifty Intraday Analysis for 10th February 2026NSE:BANKNIFTY
Index has resistance near 61100 – 61200 range and if index crosses and sustains above this level then may reach near 61600 – 61700 range.
Banknifty has immediate support near 60300 - 60200 range and if this support is broken then index may tank near 59800 - 59700 range.
Expect a range-bound market as we monitor whether the small gap from 9th February gets filled or holds as support.
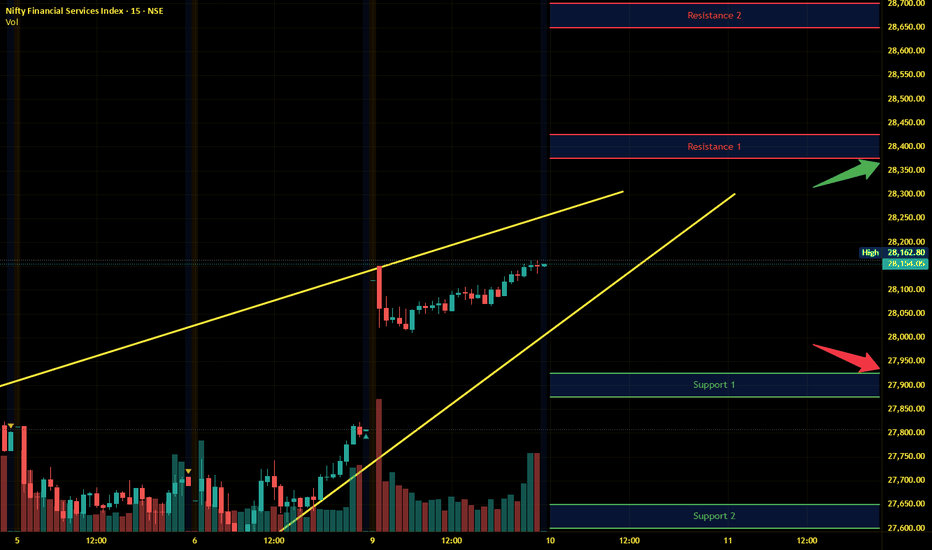
Finnifty Intraday Analysis for 10th February 2026 NSE:CNXFINANCE
Index has resistance near 28375 - 28425 range and if index crosses and sustains above this level then may reach near 28650 - 28700 range.
Finnifty has immediate support near 27925 – 27875 range and if this support is broken then index may tank near 26650 – 26600 range.
Expect a range-bound market as we monitor whether the small gap from 9th February gets filled or holds as support.
Midnifty Intraday Analysis for 10th February 2026NSE:NIFTY_MID_SELECT
Index has immediate resistance near 14000 – 14025 range and if index crosses and sustains above this level then may reach 14150 – 14175 range.
Midnifty has immediate support near 13750 – 13725 range and if this support is broken then index may tank near 13600 – 13575 range.
Expect a range-bound market as we monitor whether the small gap from 9th February gets filled or holds as support.
Nifty's Unbeatable Bullish Pattern on HTF Since 2011, the Nifty 50 ( NSE:NIFTY ) index has formed Ascending Triangle patterns on three different occasions.
During the 2011-2014 consolidation, 6350 levels offered resistance and formed an ascending triangle, eventually breaking out to rally by 40%.
During the 2015-2017 consolidation, 9000 levels offered resistance and formed an ascending triangle, eventually breaking out to rally by 35%.
During the 2021-2023 consolidation, 18600 levels offered resistance and formed an ascending triangle, eventually breaking out to rally by 25%.
Currently, for the last year or so, the 26200 level has repeatedly offered resistance and has started forming an ascending triangle pattern. I have a reason to believe that in Feb-Mar 2026, the level will be breached on the upside, which then will lead to a rally in Indian markets.
If it has to happen, we may see 32000 levels by Feb-Mar 2027.
Part 4 Institutional Trading VS. Technical AnalysisCall Option (CE) — The Simplest Explanation
A Call Option is a contract that gives you the right to buy at a fixed price.
You buy a CE when you expect:
✔ PRICE will go UP.
Profit Logic:
Price goes ABOVE strike price + premium.
Loss Logic:
Maximum loss is only the premium.
Pullback Into Resistance, Sell-the-Rally Setup
Market Structure
Overall structure is bearish-to-range after a strong selloff.
Price made a rounded bottom from the Feb lows, then transitioned into a corrective rally.
The rally is retracing into a prior supply / resistance zone, not breaking structure yet.
Key Zones
Major Resistance / Supply: ~5,100 – 5,213
Marked clearly on your chart.
Previous breakdown zone → now acting as resistance.
Minor Resistance (Entry Zone): ~5,050 – 5,105
Price is currently reacting here.
Prior support turned resistance (classic S/R flip).
Support: ~4,650 – 4,700
Strong demand zone.
Previous reaction + liquidity pool.
Intermediate Support: ~4,905
Likely first pause or bounce area if rejection starts.
Price Action Story
The white path shows a corrective ABC-style move into resistance.
Momentum on the way up is weaker compared to the selloff (bearish sign).
No clean bullish break-and-hold above the resistance zone yet.
This favors a rejection rather than continuation.
Trade Idea (As Illustrated)
Bias: Short
Entry: Into 5,050 – 5,100 resistance
Invalidation: Clean 1H close and acceptance above ~5,213
Targets:
~4,905 (partial / scale-out)
~4,650 (main target / demand zone)
What Would Flip This Bullish?
Strong impulsive break above 5,213
Followed by a successful retest and hold
Until then → rallies are suspect.
Summary
This is a sell-the-rally setup into a well-defined resistance zone, aiming for a move back into demand. The chart is structured, levels are respected, and the risk is clearly defined — exactly how you want it.
XAUUSD – Rejection From Major Supply, Bearish Continuation Setup
Chart Analysis:
This XAUUSD chart is telling a pretty clean story of range-to-distribution behavior.
Grey zone (top) → Clear supply / resistance area. Price has tapped this zone multiple times historically and is now reacting to it again.
The recent push up into this zone looks corrective, not impulsive — higher lows, but weakening momentum as it approaches resistance.
The curved white arrow highlights a previous drop from the same area, showing this level already caused a strong sell-off before. That adds confidence to the zone.
Current Structure:
Market is making a lower high relative to the major swing high.
Price is stalling right under supply → classic sign of sellers absorbing buys.
No strong bullish breakout candles above the grey zone.
Trade Idea Shown:
Entry: Short from the grey supply zone
Target: Blue support zone below (prior demand + liquidity pool)
Support zone: Strong base where price previously accumulated and bounced hard — logical take-profit area.
Bias:
Bearish while below the grey zone
Expectation: rejection → rotation down → liquidity grab into support
What Would Invalidate This Setup?
Strong bullish close and acceptance above the grey zone
Follow-through volume confirming breakout (not just a wick)
Summary:
This is a textbook sell-from-supply → target-demand setup. The market already showed respect for these levels in the past, and current price action suggests sellers are defending aggressively again.
AUDJPY Hourly 1:4 RRAs AUDJPY is in Uptrend
my idea to trade is mentioned in Chart
entry point OB rest at equilibrium of Dealing range
i will only enter after conformation of lower time frame (Upside Choch) in either one or five minutes
if it played well will get 1:4 RR Trade
#Forex #AUDJPY #FXtrade
We’re looking at Gold vs USD on the 1-hour chartPrice recently completed a deep pullback after a strong bullish leg.
That pullback formed a rounded / cyclical bottom (purple curve), which often signals trend continuation, not reversal.
🧠 Structure & Price Action
What stands out:
Higher low formed after the sell-off → bullish market structure
Strong impulsive bullish candles off the lows → buyers in control
Price reclaimed and is holding above a key mid-range level (~4960)
This tells us:
The correction phase is likely complete, and price is transitioning back into an impulse phase upward.
🎯 Trade Idea (Based on Your Chart)
✅ Entry
Buy around 4,960 – 4,970
This is a pullback entry inside bullish continuation
🛑 Stop Loss
Below the recent structure low
Around 4,840 – 4,860
If price breaks here, the bullish idea is invalidated
🎯 Target
5,050 – 5,100 zone
This aligns with:
Prior resistance
Projected impulse leg (measured move)
Liquidity resting above highs
Risk–Reward:
Roughly 1:2.5 to 1:3, which is solid for an intraday/swing setup.
🔍 Why This Setup Makes Sense
Bullish continuation after correction
Structure shift confirmed (higher low)
Strong momentum candles
Clear invalidation level (clean risk)
The blue projected path you drew fits perfectly with a pullback → continuation → expansion model.
⚠️ Invalidation Clue
If price:
Breaks and closes below the stop zone
Or starts printing lower highs + strong bearish momentum
→ bullish bias is off, and we reassess.
JMFINANCIL | Trendline & Resistance Broken Today🚀 JMFINANCIL | Trendline & Resistance Broken Today
📊 Breakout Context: Trendline + Resistance breakout with strong volume confirmed today.
TRADE PLAN
💰 Buy near CMP: 139.93
🎯 Target: 205 (+46.5%)
🛑 Stop Loss: 124.40 (-11.1%)
⚖️ Risk/Reward Ratio: ~1 : 4.2
🔑 Key Notes
- 📌 Strong volume breakout signals genuine momentum; watch for retests.
- 📍 Healthy retest zone: 135 – 139 (valid as long as price holds above stop loss).
- 🔒 Trail stop loss upward as price advances to lock in profits.
🔥 Discipline + Patience = Profits
Stay focused, respect your stop, and let the trend reward you.
WTI (Crude Oil) - Bullish SetupWTI has been trading under this trendline since March' 2022. Inflation adjusted oil is the cheapest commodity avaiable currently and the type of bull run we have seen in all other commodties since last year, i expect it is oils turn to shine now. Tracking this trendline closely, and once it is broken, i expect oil to run upwards pretty fast. Eyes Open!
XAGUSD - Parallel ChannelThe price of silver has already borken out from this parallel channel that it was trading inside for the past few days. If the Bullish momentum continues, expect to have quick pullback to approx $74-$75 before continuing the next leg up. Also the RSI has now returned to neutral territoriy, which would be a good sign for the bullish trend to continue. But if we do see a breakdwon in the momentum, expect the prices to retest $50-$54 before turning bullish again.
S&P 500 Analysis BullishS&P 500 Analysis (4H Chart)
- The primary trend of the SP500 remains bullish, although on a 4H chart, the index was trending within a bearish broadening wedge, which the prices have recently breached on the upper side and sustained higher.
- The prices have also given a bullish breakout above the inverse head & shoulder pattern.
- After a strong bullish pullback in the previous two trading sessions, the index is currently resting near the fib extension 1.0 (6963).
- The prices are also forming a bullish hidden divergence with RSI.
- Any breakout above recent highs of 6980, would drive the prices higher above 7000 near 7026 zone.
Crude Oil Analysis BearishCrude Oil Analysis (4H Chart)
- The primary trend in oil turned bullish.
- On the 4H chart, the prices have recently tested the upper trendline of the symmetrical triangle pattern and are showing signs of weakness.
- The prices have also recently tested the upper Bollinger band, with RSI turning flat, signaling moderate bearish retracement.
- Prices are now expected to retrace towards the fib level 0.50 (63.55) confluence with the middle Bollinger band, if breached lower support of 62.40 can be seen.
- Crude upside may be capped as diplomatic progress emerges, despite US warnings to avoid Iranian waters near Hormuz.
- Also, Venezuelan Oil exports surge to 800,000 bpd in January from 498,000 bpd in December.
Breakout with volume | PRAJINDPRAJIND: Major Reversal Underway After 70% Correction from all time high
Praj Industries is currently showing signs of a massive structural turnaround after being a significant underperformer in the capital goods sector, trading nearly 60% down from its all-time high. This deep correction led the stock into a high-value accumulation zone, where it recently established a rock-solid support base between ₹273 and ₹280. The technical landscape shifted dramatically today as the price delivered a powerful single-day breakout, surging over 14% and clearing its previous one-month high in a single move. This price spike was backed by exceptional volume, indicating that institutional buyers are likely stepping in at these beaten-down levels to absorb supply.
From a structural standpoint, the stock has finally breached a long-standing descending trendline that had suppressed price action for months, signaling an end to the "lower high, lower low" corrective cycle. While the price remains below the 200-day DMA, this move successfully reclaimed the 5, 20, and 50-day moving averages in one go, shifting the immediate momentum from bearish to strongly bullish. With the stock now sustaining above the trendline breakout point and showing high-volume absorption, the technical setup confirms that the bottom is likely in. Given this confluence of a strong support base and a momentum-backed breakout, the stock can be looked at for a significant upside move as it begins its long-term recovery phase.
GOLD BULLISH TRIANGLE PATTERN | BULLISH BREAKOUT Gold is currently consolidating within a tight symmetrical triangle following a corrective pullback, indicating a period of compression ahead of a potential expansion move. Price action continues to hold above the key demand zone around 5030, which remains a critical structural support.
Multiple rejections from the upper boundary of the consolidation suggest building bullish pressure. A decisive breakout and sustained acceptance above the 5045–5048 resistance zone would confirm bullish continuation and signal the next leg higher.
On confirmation, upside momentum is expected to target 5055, followed by an extension toward 5065, aligning with projected measured-move objectives from the triangle breakout.
A failure to hold above 5030 would invalidate the bullish bias and expose price to deeper downside correction, negating the current setup.
