NIFTY at a Turning Point? Monthly Chart SpeaksOn the monthly chart, NIFTY is showing a critical market structure shift.
Key observations:
Supply range has been swept
A clear M-pattern is forming on the higher timeframe
The last fake / trapping monthly fall setup (marked on the chart) is now complete
Price is trading at ~5.7 ATR away from the 100 EMA, signalling extension
From a risk–reward perspective, the structure offers a ~1:5 R:R setup on the monthly timeframe.
At this stage, confirmation matters more than bias.
If the February monthly candle starts turning red, it could activate a sell-side move and potentially shift NIFTY into a bearish regime, not just a short-term pullback.
This is not a prediction — it’s price action, market structure, and probability on a higher timeframe.
Trend Analysis

NIFTY 50 | Major Support Zone | Market at a Decision PointNIFTY has corrected into a high-confluence support area, aligning with key Fibonacci retracements, rising trendline support, and previous demand zones.
This region is technically very important — the next directional move is likely to emerge from here.
🔍 Why this zone matters:
• Confluence of 0.618–0.786 Fibonacci
• Price near rising trendline support
• Prior demand + structure support
• Risk–reward favorable for positional setups
📈 Possible Scenarios:
• Hold & bounce → Trend continuation towards highs
• Break & close below → Deeper correction / time correction
📌 Current Status: ⚖️ Deciding Zone
👉 Wait for confirmation, not prediction.
⚠️ Educational view only. Not a trading recommendation.
#NIFTY50 #MarketStructure #SupportZone #DecidingZone #TechnicalAnalysis #IndianStockMarket #PriceAction #RiskReward

Hindustan Copper | Big Move Done | Profit Booking ZoneHINDCOPPER has delivered a sharp, vertical rally after a long accumulation phase, breaking multiple higher-timeframe resistance levels with strong volume expansion.
At current levels, the stock is cooling off after an extended move, indicating profit booking and consolidation rather than fresh momentum entry.
🔍 Technical Highlights:
• Strong breakout above ₹400 (HTF resistance)
• Parabolic move → exhaustion signals visible
• Tight range near highs = supply vs demand battle
• Weekly structure remains bullish, but short-term stretched
📊 Current View:
• Ideal zone for partial / full profit booking
• Fresh longs only after healthy pullback or range breakout
• Expect time correction or shallow price correction
📌 Status: ✅ Profit Booked | Capital Protected
⚠️ Disclaimer: For educational purposes only. Not financial advice.
#HindustanCopper #HINDCOPPER #ProfitBooked #BreakoutStock #SwingTrading #IndianStocks #TechnicalAnalysis #RiskManagement

SBI | Target Achieved | Profit BookedState Bank of India has delivered a strong breakout and sustained rally, moving well beyond key Fibonacci and structure levels.
At current levels, the stock looks extended, making it an ideal zone for profit booking and capital protection.
🔍 What Worked Well:
• Breakout above declining trendline
• Strong higher-high, higher-low structure
• Fibonacci levels respected during the move
• Momentum expansion with volume support
📊 Current View:
• Near-term consolidation / pullback possible
• Fresh entries only after healthy retracement
• Trend remains bullish on higher timeframe
📌 Status: ✅ Profit Booked | Risk Managed
⚠️ Disclaimer: Educational purpose only. Not financial advice.
#SBIN #ProfitBooked #TargetAchieved #BankingStocks #StockMarketIndia #SwingTrading #TechnicalAnalysis #CapitalProtection

PCR TRADING STRATEGIESOption Trading in Index vs Stocks
Index Options
Cash-settled
Lower manipulation risk
Higher liquidity
Preferred by professionals
Stock Options
Physical settlement
Higher risk near expiry
Stock-specific events matter more

XAUUSD 1 D T/F ANALYSIS----
xauusd 1d t/f analysis---- previous marked demand will be completed on 5000 $ level after demand complete then we can expect marked consolidated are so we can expect consolidated here and we have also trending support help it to prove if consolidated period can be half then trending support again respect our level and it`s measured by previous marked demand which demand consume time around 81 day and 1082 point /
in may 2026 we can expect demand here and reach around 6000 $ let`s see---

INTRADAY INSTITUTIONAL TRADINGFactors Affecting Option Pricing
Options are priced using mathematical models (like Black-Scholes), but practically they depend on:
Underlying Price
Strike Price
Time to Expiry
Volatility
Interest Rates
Dividends
Among these, volatility and time play the biggest role.

NIFTY 50 1D T/F ANALYSIS----
nifty 50 1d t/f analysis----center portion is a double s curve which are bended both side now we can measure previous supply and also according to range analysis supply of timing will be half so we can expect demand can be fast here and wait for any bullish candle here on retesting area let`s see---

NIFTY Weekly Level Analysis: PRE- BUDGET from 27th-30th JAN 2026NIFTY Weekly Level Analysis: PRE- BUDGET from 27th-30th JAN 2026
🚀Follow & Compare NIFTY spot Daily Post for Taking Trade
👇🏼Screenshot of NIFTY Spot All-day(23rd Jan 2026) in 3 min TF.
🚀Follow GIFTNIFTY Post for NF levels
👇🏼Screenshot of GIFTNIFTY All-day(23rd Jan 2026) in 5 min TF..
💥Level Interpretation / description:
L#1: If the candle crossed & stays above the “Buy Gen”, it is treated / considered as Bullish bias.
L#2: Possibility / Probability of REVERSAL near RLB#1 & UBTgt
L#3: If the candle stays above “Sell Gen” but below “Buy Gen”, it is treated / considered as Sidewise. Aggressive Traders can take Long position near “Sell Gen” either retesting or crossed from Below & vice-versa i.e. can take Short position near “Buy Gen” either retesting or crossed downward from Above.
L#4: If the candle crossed & stays below the “Sell Gen”, it is treated / considered a Bearish bias.
L#5: Possibility / Probability of REVERSAL near RLS#1 & USTgt
HZB (Buy side) & HZS (Sell side) => Hurdle Zone,
*** Specialty of “HZB#1, HZB#2 HZS#1 & HZS#2” is Sidewise (behaviour in Nature)
Rest Plotted and Mentioned on Chart
Color code Used:
Green =. Positive bias.
Red =. Negative bias.
RED in Between Green means Trend Finder / Momentum Change
/ CYCLE Change and Vice Versa.
Notice One thing: HOW LEVELS are Working.
Use any Momentum Indicator / Oscillator or as you "USED to" to Take entry.
━━━━━━━━━━━━━━━━━━━━━━━━━━━━━━━━━━━━━━━━━━━
⚠️ DISCLAIMER:
The information, views, and ideas shared here are purely for educational and informational purposes only. They are not intended as investment advice or a recommendation to buy, sell, or hold any financial instruments. I am not a SEBI-registered financial adviser.
Trading and investing in the stock market involves risk, and you should do your own research and analysis. You are solely responsible for any decisions made based on this research.
"As HARD EARNED MONEY IS YOUR's, So DECISION SHOULD HAVE TO BE YOUR's".
━━━━━━━━━━━━━━━━━━━━━━━━━━━━━━━━━
❇️ Follow notification about periodical View
💥 Do Comment for Stock WEEKLY Level Analysis.🚀
📊 Do you agree with this view?
✈️ HIT THE PLANE ICON if this technical observation resonates with you. It will Motivate me.
━━━━━━━━━━━━━━━━━━━━━━━━━━━━━━━━━
💡 If You LOOKING any CHART & want for Level and ANALYZE?
Share your desired stock names in the comments below! I will try to analyze the chart Levels, patterns and share my technical view (so far my Knowledge).
If Viewers think It can identify meaningful setups. Looking forward to hearing from all of you — let's keep this discussion going and help each other make better trading decisions.

XAUUSD Gold BuyGold is very bullish, currently one should look to buy it, it is making its new ATH level every day, and currently we are seeing a zone from where buying can be done, definitely take LTF confirmation, with this you can reduce your risk to a great extent.

NIFTY Spot IntraSwing level Analysis for 27th JAN 2026Monthly Exp Day NIFTY Spot IntraSwing level Analysis for 27th JAN 2026
🚀Follow GIFTNIFTY EXP & Next Month Post for Roll-Over & NF levels
👇🏼Screenshot of NIFTY Spot All-day(23rd Jan 2026) in 3 min TF.
👇🏼Screenshot of GIFTNIFTY All-day(23rd Jan 2026) in 5 min TF.
━━━━━━━━━━━$$$$$$$$$$$━━━━━━━━━━━
💥Level Interpretation / description:
L#1: If the candle crossed & stays above the “Buy Gen”, it is treated / considered as Bullish bias.
L#2: Possibility / Probability of REVERSAL near RLB#1 & UBTgt
L#3: If the candle stays above “Sell Gen” but below “Buy Gen”, it is treated / considered as Sidewise. Aggressive Traders can take Long position near “Sell Gen” either retesting or crossed from Below & vice-versa i.e. can take Short position near “Buy Gen” either retesting or crossed downward from Above.
L#4: If the candle crossed & stays below the “Sell Gen”, it is treated / considered a Bearish bias.
L#5: Possibility / Probability of REVERSAL near RLS#1 & USTgt
HZB (Buy side) & HZS (Sell side) => Hurdle Zone,
*** Specialty of “HZB#1, HZB#2 HZS#1 & HZS#2” is Sidewise (behaviour in Nature)
Rest Plotted and Mentioned on Chart
Color code Used:
Green =. Positive bias.
Red =. Negative bias.
RED in Between Green means Trend Finder / Momentum Change
/ CYCLE Change and Vice Versa.
Notice One thing: HOW LEVELS are Working.
Use any Momentum Indicator / Oscillator or as you "USED to" to Take entry.
━━━━━━━━━━━━━━━━━━━━━━━━━━━━━━━━━━━━━━━━━━━
⚠️ DISCLAIMER:
The information, views, and ideas shared here are purely for educational and informational purposes only. They are not intended as investment advice or a recommendation to buy, sell, or hold any financial instruments. I am not a SEBI-registered financial adviser.
Trading and investing in the stock market involves risk, and you should do your own research and analysis. You are solely responsible for any decisions made based on this research.
"As HARD EARNED MONEY IS YOUR's, So DECISION SHOULD HAVE TO BE YOUR's".
━━━━━━━━━━━━━━━━━━━━━━━━━━━━━━━━━
❇️ Follow notification about periodical View
💥 Do Comment for Stock WEEKLY Level Analysis.🚀
📊 Do you agree with this view?
✈️ HIT THE PLANE ICON if this technical observation resonates with you. It will Motivate me.
━━━━━━━━━━━━━━━━━━━━━━━━━━━━━━━━━
💡 If You LOOKING any CHART & want for Level and ANALYZE?
Share your desired stock names in the comments below! I will try to analyze the chart Levels, patterns and share my technical view (so far my Knowledge).
If Viewers think It can identify meaningful setups. Looking forward to hearing from all of you — let's keep this discussion going and help each other make better trading decisions.

Dalal Street Shaken Ahead of Monthly Expiry — What’s Next?Indian equity markets witnessed a sharp corrective move last week, with the Nifty sliding nearly 2.5% to close around 25,050. The sell-off came at a sensitive juncture—just ahead of monthly expiry.
Adding to the nervousness, India VIX jumped sharply by 24.8% to 14.19, signaling a sudden rise in uncertainty and trader caution.
A combination of geopolitical tensions, pre-Union Budget 2026 jitters, and mixed Q3 earnings weighed heavily on market sentiment, prompting profit booking across sectors.
◉ Technical Setup
Nifty is currently testing the lower end of its rising channel, a technically important area. A mild relief bounce is possible from these levels.
However, a decisive breakdown below the channel support could trigger another leg of sharp selling in the coming sessions, making this zone extremely crucial for near-term direction.
◉ Key Levels to Watch
Support Zones
25,000 – 24,900: Immediate psychological and technical support
24,500 – 24,400: Strong base with heavy put writer concentration
Resistance Zones
25,400 – 25,500: Immediate hurdle with significant call writing
26,000 – 26,100: Major supply zone and strong resistance
◉ Near-Term View
Volatility is likely to remain elevated in the coming week. While the broader structure has weakened, a short-term bounce from the 25,000 zone cannot be ruled out, given oversold conditions and strong psychological support.
That said, any recovery should be viewed with caution and may face stiff resistance at higher levels.
◉ Suggested Strategy
A cautious, stock-specific strategy is preferred for the week ahead. Short-term oversold signals may support a bounce, but the broader trend has weakened. Avoid aggressive longs and focus on protecting gains.

Bank nifty Trades and Targets for - 27-1-26Hello Everyone. The market was in a bearish mode today. Sell on rise should be followed. If the market opens flat then we can see continuation of trend. If it opens gap up then we need to see the resistance level to break before looking for CE trades. If it opens gap down then look for PE trades after support zone is broken. Let the market settle in first 15 to 30 minutes then look for directional trades. Book profits every 30 points as we are getting very few trending moves.

Nifty Analysis for 27th Expiry Hello Everyone. The market was in a bearish mode previous day. If the market opens flat then we can see continuation of trend. If it opens gap up then we need to see the resistance level to break before looking for CE trades. If it opens gap down then look for PE trades after support zone is broken. Let the market settle in first 15 to 30 minutes as there needs to be premium adjustment and 3 days decay, then look for directional trades. Book profits every 30 points as we are getting very few trending moves. Its expiry day so do not increase your lot size as premiums are low and do not take trades against the trend at any cost.

XAUUSD – Monday Focus: Buy the Dip Toward 5,020–5,043 Market Context
Gold remains firmly supported by a bullish risk environment. The recent impulse leg confirms that buyers are still in control, while pullbacks are being absorbed rather than extended.
This is continuation behavior, not distribution.
The question for Monday is not if Gold is bullish —
but where the dip becomes opportunity.
Technical Structure (H1)
Market has already confirmed bullish BOS
Strong impulsive leg created multiple stacked FVGs below
Current price is consolidating above structure, not breaking it
Pullback is corrective in nature
This is a classic impulse → retracement → continuation setup.
Key Zones to Watch
Immediate resistance / BOS level: 4,969 – 4,970
Intraday BUY zone: 4,933 – 4,940
Upper FVG support: 4,920 – 4,899
Deeper demand (HTF): 4,860 – 4,880
As long as price holds above the upper FVG, bullish bias remains intact.
Scenarios (If – Then)
Scenario 1 – Bullish Continuation (Primary)
If price pulls back into 4,933 – 4,940 and holds
Buyers step in → continuation toward:
5,020
5,043 (1.618 extension)
Scenario 2 – Deeper Pullback (Alternative)
If price loses 4,933
Expect mitigation toward 4,920 – 4,899
Only a sustained H1 close below 4,899 would weaken the bullish structure
Summary
Gold is not overextended — it is rebalancing within a bullish trend.
The structure favors buying pullbacks, not chasing highs.
This is a dip-buying market until structure says otherwise.

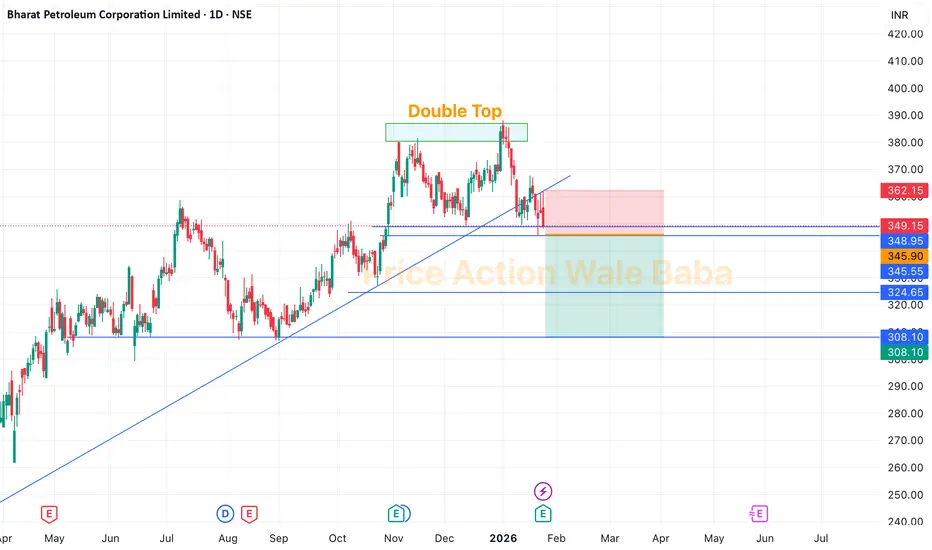
BPCL - Double TopBPCL is forming a Double Top which is has neckline of 345.
Delivery Based Selling Strategy:
Sell below 345,
Keep SL on high of 23rd Jan candle, which is 361.
Targets are 320-300.
Option Buying Strategy
So, for the option trading in this stock, you can choose any PUT option on BPCL, mark high of 21st Jan candle in option, once it breaks it just buy and keep SL below same day's low.
INTRADAY INSTITUTIONAL TRADING Moneyness
In-the-Money (ITM)
Call: Spot > Strike
Put: Spot < Strike
At-the-Money (ATM)
Spot ≈ Strike
Out-of-the-Money (OTM)
Call: Spot < Strike
Put: Spot > Strike

Part 5 Advance Option Trading Option Seller (Short Option)
Advantages:
Benefits from time decay
Higher probability of profit
Works well in sideways markets
Disadvantages:
Unlimited or very high risk
Requires margin
Risk increases sharply during volatility spikes

BUY MOVEMENT EXPECTED IN ATHER
Wait price once will be go for 600-597 then u-turn upside , if weekly close Between 621-625 or + , then enter for target 700+ in next 2-3 month

Nasdaqrisk to reward if good worth taking risk, looking at the geopolitical tension most likely to fall like water

Part 4 Institutional Trading Vs. Technical AnalysisOption Buyer (Long Option)
Advantages:
Limited risk
Unlimited profit potential (for calls)
High leverage
Clear risk-reward structure
Disadvantages:
Time decay works against buyer
Requires strong directional or volatility move
High probability of small losses

TitanTitan forming evening star pattern on weekly time frame.
No buy/sell suggestion only for education purpose.

BTC 1D UpdatePrice has been grinding lower since the early Jan peak near $95K, forming a clear descending wedge (yellow lines). Recent rejection at the upper trendline (~$92K) led to a pullback, with today's close at $88,720 (-0.52%). Support holding at $88K (bottom of wedge), but volume's thinning—watch for a breakdown targeting $84K (next fib level) or a bullish breakout above $90K aiming for $95K retest.
Key levels:
Resistance: $90K (horizontal), $92K (wedge top)
Support: $88K (wedge bottom), $84K (prior low)
Macro backdrop: BTC's lagging gold's surge amid inflation hedges, with ETF outflows pressuring the week (-4.89%). Bulls eye $92K-$98K if Jan closes green, but BoJ risks and global rallies aren't lifting it yet.
NFA, DYOR. What's your bias? Bullish reversal or more downside? #BTC #Bitcoin #CryptoTrading
