Why Nifty and Reliance Correct but Don’t Break the TrendThis chart compares Nifty (index) and Reliance (heavyweight stock) on a long-term view.
Both are moving inside a clear rising structure.
The purpose is to show something very important:
👉 Corrections happen in every trend.
👉 But trend continues as long as structure holds.
📈 What This Comparison Shows Clearly
• Nifty is in a long-term rising channel
• Reliance is also in a long-term rising channel
Both move up → both correct → both move up again.
This is how healthy markets behave.
📉 About the Current Fall
Right now:
• Nifty is moving toward its long-term support zone
• Reliance is also pulling back inside its trend
This does NOT mean the trend is broken.
It simply means:
👉 Market is taking a normal correction
Just like it did many times before.
🧠 Simple Market Truth
Markets don’t go up in a straight line.
They move like this:
Up → Pullback → Up → Pullback → Continue trend
People panic during pullbacks.
Smart money looks at structure.
📌 Big Lesson From This Chart
✔ Index and big stocks move together in trend
✔ Corrections are part of growth
✔ Trend changes only when structure breaks
Until then, pullbacks are normal.
🎯 Final Thought
Don’t confuse correction with crash.
Trend is still strong — price is just cooling down.
Let price decide.
Trend Analysis

Budget Fear vs Market Trend – Nifty’s 5 Year BehaviorThis idea is not about indicators.
It is about how people behave in the market during Budget time.
I marked every Budget period of the last five years and studied:
• What happens before the Budget
• What happens on Budget day
• What happens after the Budget
The goal is simple — to understand real market reactions, not panic.
📍 How Market Usually Moves Around Budget
👉 Before Budget
People feel unsure and scared of surprises.
So many traders:
• Reduce positions
• Book profits
• Wait on the side
That’s why price often moves sideways or slowly falls.
This is fear of uncertainty.
👉 On Budget Day
If Budget is normal (as expected) → small move
If Budget has surprise news → big move
Most of the time, the market reacts only when something unexpected happens.
👉 After Budget
Once confusion is over:
• Fear reduces
• Traders come back
• Trend usually continues
This is when the real move starts.
📅 What We Saw in Last 5 Years (Simple View)
🔹 2021
Market went up strongly.
Reason:
COVID recovery + lots of money flow + positive mood.
👉 Confidence = rally
🔹 2022
Market stayed bullish.
Reason:
Growth plans + stable global markets.
👉 No fear, so trend continued
🔹 2023
Market moved mixed.
Reason:
No big Budget surprise. People focused more on global news.
👉 Budget had less effect
🔹 2024
Market was very volatile.
Reason:
Two budgets created confusion.
👉 Confusion = up and down moves
🔴 2025
Small fall on Budget day, then market moved up later.
👉 Fear first, clarity later
🔴 2026
Sharp fall on Budget day.
Reason:
Trading cost increased (STT hike)
People got disappointed
👉 Short-term panic
But this does NOT always mean long-term downtrend.
📈 Big Lesson From This Chart
✔ Most fear comes before the Budget
✔ Budget day panic is usually short-term
✔ Long-term trend respects structure and money flow
That’s why price keeps respecting the long-term support trendline.
🧠 Simple Truth About Markets
Markets move because of:
• Fear
• Expectations
• Money flow
Not just because of one speech.
When fear ends, price becomes normal again.
📌 Current Situation (As Shown on Chart)
Nifty is moving toward its long-term multi-year support trendline.
There is still room for a 3% correction, but this is happening within a strong long-term trend.
Now the reaction at this zone will be important.
🎯 Final Message
Budget creates noise.
Trend shows direction.
If you understand this, you won’t panic during events.

How BankNifty Reacts to Every Budget: A 5-Year Market Behavior This idea is NOT about technical indicators — it’s about real market behavior, human psychology, history, and event sequencing.
I plotted vertical lines on every Budget period for the last five years and asked:
What actually happened and WHY?
Not “what do indicators say?” — but the real drivers of price action.
Below is a comprehensive explanation of each Budget event, its context, and how the market responded — with reasoning based on macro, liquidity, trader psychology, positioning, and news flow.
📍 What Markets Price Around Budget
Markets are forward-looking and reduce uncertainty.
Before Budget:
Price often ranges or compresses because traders are uncertain
Positions open and close based on expectation (fear of surprise)
On Budget Day:
The actual speech is often less important than the expectations priced in
If the speech matches expectations → quiet
If it surprises in a direction markets didn’t expect → volatility
After Budget:
Real moves usually occur after traders digest details AND macro context realigns
(liquidity, earnings, policy continuity, global trends)
This is the real reason why market reactions vary wildly year to year.
📅 YEAR-BY-YEAR ANALYSIS WITH EXPLANATION
🔹 BUDGET 2021
Behavior: Strong rebound and upward continuation
Why?
✔ Post-COVID recovery narrative was dominant
✔ Liquidity expansion and government spending expectations
✔ Growth bias outweighted short-term uncertainties
📌 Markets rallied after traders realized the budget supported growth.
Lesson: When economic recovery is the dominant narrative, Budgets act as confirmation catalysts.
🔹 BUDGET 2022
Behavior: Mostly bullish
Why?
✔ Continued fiscal support narrative
✔ Global markets stabilizing
✔ Growth and infrastructure focus retained investor confidence
Result: Technical breakout after digestion — not just immediate reaction.
🔹 BUDGET 2023
Behavior: Mixed but broadly resilient
Why?
✔ Budget was largely in line with expectations — fewer big surprises
✔ Investors were more focused on global macro + earnings
Outcome: Large moves came from macro trends, not the Budget itself.
🔹 BUDGET 2024
Behavior: Confusing — two budgets in one year
Why?
✔ Interim + Full Budget created narrative confusion
✔ Traders hesitated until clarity was restored
Outcome: Whipsaws, not sustained directional moves.
Real trading lesson: Confusion = Volatility, not breakout.
🔴 BUDGET 2025
Behavior: Mild negative on Budget day, then followed by trend continuation
Why?
✔ Many expectations were already priced in
✔ The speech didn’t have big surprises
✔ The real moves were in post-Budget positioning
Observation: Markets often wait before the Budget and act after it once the shock of uncertainty passes.
🔴 BUDGET 2026
Behavior: Negative reaction on Budget day
Why?
✔ STT increase on derivatives — futures/options now costlier
✔ This hits liquidity for big traders, prop desks, retail swing players
✔ Market expected more growth incentives — didn’t get them
Result: Immediate sell-off.
But here’s the key:
👉 This does not automatically mean a long-term downtrend.
It reflects short-term liquidity impact and positioning unwinding.
📈 Why the Panic Around Budget Is Often Wrong
Here’s something most people never understand:
🤯 1) Most Budget moves are anticipation moves
Markets move before the event because position managers don’t like uncertainty.
📌 2) Actual Budget day moves are often smaller than the noise
Longer-term trend doesn’t change unless economic fundamentals change.
3) Market moves after Budget are usually driven by:
✔ Corporate earnings
✔ Liquidity conditions
✔ Foreign fund flows
✔ Global macro trends
✘ Not just Budget speech words
💡 Macro & Behavioral Factors Traders Ignore
🎯 LIQUIDITY DRIVES PRICE
When money is easy → markets go up
When money tightens → markets correct
This matters more than budgets.
🧠 HUMAN FEAR & UNCERTAINTY
People confuse:
Fear of uncertainty → huge reactions
Reality of change → small price moves
Markets hate uncertainty — not facts.
📊 POSITIONING AND STOP-HUNTS
Before events like Budget, many traders tighten stops or close positions, creating volatility that’s not structural.
📌 HIGHLIGHTS YOU CAN ADD ON THE CHART
These are on-chart text ideas to reinforce learning:
🟦 On Vertical Lines:
“Pre-Budget Positioning Zone”
“Expectations Priced In Here”
“Actual Speech → Less Movement Than Anticipated”
“Liquidity Reaction > Budget Impact”
🟩 On Zones Where Price Rallied After Delay:
“Post-Budget Clarification Move”
“Trend Continuation After Noise Dies”
🟥 On 2026 Drop:
“Cost of Trading Changed (STT Impact)”
“Liquidity + Positioning Over Budget Words”

Part 2 Intraday Institutional TradingHedging with Options
Options are widely used for risk management.
Examples:
Buying put options to protect long equity portfolios
Using collars to limit upside and downside
Index puts for market crash protection
Hedging reduces returns slightly but protects capital, which is crucial for long-term survival.

Nifty 50 analysis for Monday (02-Feb-2026)Nifty 50 is near the support level of Daily support and made 24750 low today. Bullish Hammer at today's bottom the upsdie retracement is done. Now it is on almost 78% retracement from bottom, once any bullish candle is there, there is a buy signal and if 24750 low goes. then more downfall is expected. As per the Elliot wave, 5 wave seems complete and there is a bullish divergance in the RSI.
Keep learning, Happy learning!

Part 1 Intraday Institutional Trading Hedging with Options
Options are widely used for risk management.
Examples:
Buying put options to protect long equity portfolios
Using collars to limit upside and downside
Index puts for market crash protection
Hedging reduces returns slightly but protects capital, which is crucial for long-term survival.

Part 2 Technical Vs. InstitutionalVolatility and Its Role
Implied Volatility (IV)
Represents market expectation of future volatility.
High IV = Expensive options
Low IV = Cheap options
Traders often:
Buy options in low IV
Sell options in high IV

IT Sector in Focus Amid Rate Cut Hopes & Rupee WeaknessThis looks like a good time to shift focus towards the IT sector. If there are any rate cut expectations ahead, IT stocks generally benefit. Rupee depreciation also works in favor of IT companies since most of their revenues come from exports. Along with this, positive budget-related news could add further support to the IT index.

#ETH Risker than beforeWatch for these levels. ETH can head back to $900 to $1000 again.
This chart/indicator is provided for educational and informational purposes only.
It does not constitute financial advice, investment recommendations, or trade signals.
The creator and Systematic Traders Club are not responsible for any financial losses resulting from the use of this indicator.
Trading and investing involve risk. Always do your own analysis and use proper risk management.

Part 1 Technical Vs. Institutional Why Trade Options?
Option trading is preferred because it offers:
Leverage – Control large positions with small capital
Hedging – Protect portfolios against losses
Income Generation – Through option selling
Flexibility – Profit in bullish, bearish, and sideways markets
Defined Risk Strategies – With spreads and hedges

Divergence Secrets Option Buyers vs Option Sellers
Option Buyers
Pay premium
Limited risk
Unlimited or high reward
Affected negatively by time decay
Option Sellers (Writers)
Receive premium
Limited reward
Potentially unlimited risk
Benefit from time decay
This buyer–seller dynamic is the backbone of option trading.

BTC fx chartsWe are walking there, it might be now or later on... Let's go root 🌱.
What do you think???

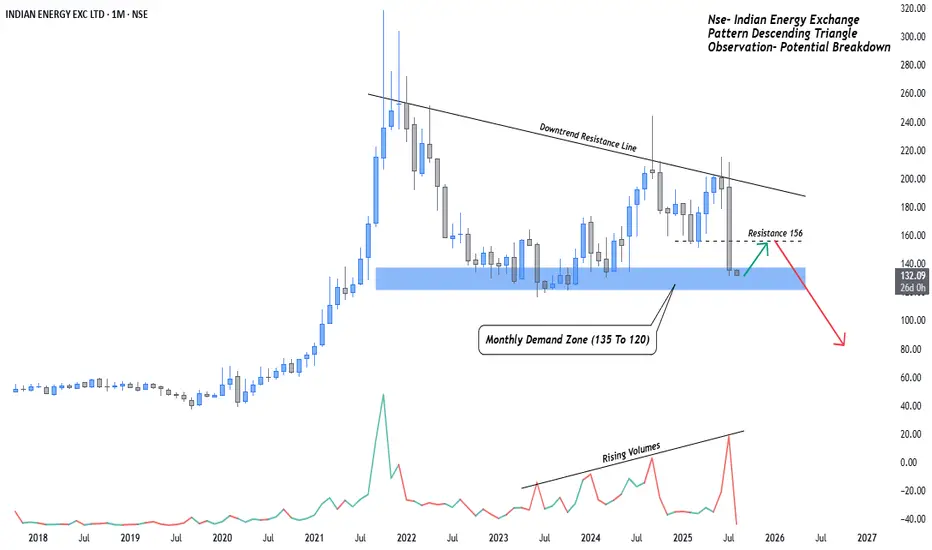
Energy Exhausted: Indian Energy Exchange Nears BreakdownGreetings Fellow Traders, Sharing a critical technical update on Indian Energy Exchange (IEX). The chart is flashing early warning signs of a potential breakdown. Key zones and price action indicate growing bearish momentum stay alert and trade with caution!
Indian Energy Exchange – Bearish Outlook Strengthens.
Indian Energy Exchange is showing clear signs of weakness as it continues to respect a long standing downtrend resistance line. The recent price action saw a sharp rejection near the 156 resistance, reinforcing bearish control.
Currently, the stock is testing a crucial Monthly Demand Zone (135–120) a level that has historically offered strong support. However, the structure now suggests increasing vulnerability.
Bearish Signals-:
Price consistently forming lower highs beneath the descending trendline.
Rising volume on red candles signals strengthening selling pressure.
Price nearing the lower boundary of demand, risking a breakdown.
Key Levels to Watch:
Breakdown below 120-: A close below this level, especially with volume confirmation, could trigger a deeper correction toward 70 or lower.
Rejection from 156 zone-: Any bounce back to this level may offer fresh shorting opportunities, unless a trend reversal is confirmed.
A decisive move below 120 would mark the beginning of a markdown phase, validating the broader bearish reversal pattern in play.
This publication I am sharing for learning purpose like price action, Support and resistance and trends ETC.
Regards- Amit
Nifty Wave Structure for long sideNifty trades around 25k If we consider Nifty structure wise, then it is on completion of wedge formation. The end point of the falling wave can be in the range of 25800-25600. A new high can be anticipated from this range. This is my view based on the structure.
Disclaimer
I do not have any buy or sell recommendation or I am not SEBI registered financial advisor.
Thanks
MKT Learner
XAGUSD/SILVER WEEKLY SELL PROJECTION 01.02.26XAGUSD Weekly Sell Projection – Script
This is the weekly technical analysis of XAGUSD, also known as Silver.
Price was previously moving inside a parallel uptrend channel.
Near the top of the channel, the market formed an Evening Star candlestick pattern, which indicates a potential bearish reversal.
After this pattern, price clearly broke the uptrend trendline, confirming weakness in bullish momentum.
Currently, price has made a strong bearish impulse.
Based on market structure, a retracement toward the broken trendline and resistance zone is expected.
This retracement zone acts as a potential selling area.
Trade Plan:
Entry: Sell near resistance and trendline retest
Stop Loss: Above the resistance zone
Target 1: Previous support level (S1)
Target 2: Major support level (S2)
As long as price remains below the broken trendline, the overall weekly bias stays bearish.
Always use proper risk management.
This analysis is for educational purposes only.

Part 1 Intraday Mater Class Introduction to Option Trading
Option trading is a derivative-based trading approach that allows traders and investors to profit from price movements, volatility, time decay, and even stagnant markets. Unlike equity trading—where profits depend largely on buying low and selling high—options provide multiple ways to make money, manage risk, and hedge portfolios.
An option is a contract that gives the buyer the right, but not the obligation, to buy or sell an underlying asset at a predetermined price within a specified time period. The seller (writer) of the option has the obligation to fulfill the contract if the buyer exercises it.
Options are widely traded in global markets and are extremely popular in India through NSE’s F&O segment, particularly in Index options (NIFTY, BANKNIFTY, FINNIFTY, SENSEX) and stock options.

Silver Weekly Outlook: Post-Exhaustion PhaseSilver has entered a high-volatility post-exhaustion phase after a sharp parabolic rise followed by an equally aggressive correction. The weekly chart clearly shows that price moved too far, too fast, and the recent sell-off is a classic example of mean reversion after euphoric buying. Such phases rarely resolve in a straight line and typically evolve into consolidation, base-building, or deeper corrective structures.
At current levels, Silver is hovering near an immediate demand zone around the 80–85 region, which now acts as a crucial decision area. This zone represents the first major area where buyers are expected to defend aggressively. The way price behaves here will define the next medium-term trend.
Scenario A – Range / Base Formation (High Probability):
The most probable outcome at this stage is sideways consolidation. After a vertical fall, markets often need time to absorb supply and rebuild demand. If Silver manages to hold above the immediate demand zone and starts forming higher lows on lower timeframes, it would indicate base formation rather than trend failure. This scenario favors range traders and patient positional participants, as price may oscillate between support and overhead resistance for several weeks or months.
Scenario B – Breakdown Continuation (Moderate Probability):
If the current support zone fails decisively with strong weekly closes below it, Silver could enter a deeper corrective phase. In such a case, price may gravitate toward the next major demand zone near 73–75, which aligns with prior consolidation and breakout structure. This move would likely be driven by broader risk-off sentiment or macro pressure rather than technical weakness alone. Traders should avoid aggressive longs if this breakdown structure develops.
Scenario C – Bullish Reclaim and Bounce (Low Probability, Needs Confirmation):
A less likely but still possible outcome is a bullish reclaim, where Silver holds current levels, absorbs selling pressure, and reclaims the 90+ zone with strong weekly confirmation. For this scenario to gain credibility, price must show acceptance above resistance with volume and structure. Until then, any bounce should be treated as reactive and corrective, not a confirmed trend reversal.
From a structural perspective, the major resistance remains far above near the 115–120 zone, which was the distribution area before the sharp reversal. This level will act as a long-term supply cap unless Silver builds a strong base over time.
In summary, Silver is no longer in a trending phase but in a transition zone. Patience is critical here. Traders should focus less on prediction and more on reaction to price behavior at key demand levels. Let structure, confirmation, and risk management guide decisions, as this phase can easily trap both early bulls and aggressive bears if approached without discipline.

Bitcoin Market Structure Shift: The "Kiss of Death" RetestThe current 1-hour chart for BTC/USD shows Bitcoin struggling to maintain upward momentum after a significant sell-off. Price action is currently respecting a descending trendline that has acted as a ceiling for several days.

BUDGET HOPES IONION Exchange
cmp 356
SL CLB 320
expected Tgt 375 to 440
💡 Liked the idea?
Then don’t forget to Boost 🚀 it!
For more insights & trade ideas,
📲 Visit my profile and hit Follow
Warm regards,
Naresh G
SEBI Registered Research Analyst
💬 Comment below if you want me to analyse any stock for you 🔍

Will it rhyme again?What do you think would happen?
This indicator is provided for educational and informational purposes only.
It does not constitute financial advice, investment recommendations, or trade signals.
The creator and Systematic Traders Club are not responsible for any financial losses resulting from the use of this indicator.
Trading and investing involve risk. Always do your own analysis and use proper risk management.

EURUSD - 4H - SHORTFOREXCOM:EURUSD
Hello traders , here is the full multi time frame analysis for this pair, let me know in the comment section below if you have any questions, the entry will be taken only if all rules of the strategies will be satisfied. wait for more Smart Money to develop before taking any position . I suggest you keep this pair on your watchlist and see if the rules of your strategy are satisfied...
Keep trading
Hustle hard
Markets can be Unpredictable, research before trading.
Disclaimer: This trade idea is based on Smart money concept and is for informational purposes only. Trading involves risks; seek professional advice before making any financial decisions. Informational only!!!

HDFCBANK Lead Turnover Stock Level analysis for 01st FEB 2026 HDFCBANK Lead Turnover Stock Level analysis for 01st FEB 2026
Can Lead the Post Budget Rally.
━━━━━━━━━₹₹₹₹₹₹₹₹₹₹₹₹━━━━━━━━
💥Level Interpretation / description:
L#1: If the candle crossed & stays above the “Buy Gen”, it is treated / considered as Bullish bias.
L#2: Possibility / Probability of REVERSAL near RLB#1 & UBTgt
L#3: If the candle stays above “Sell Gen” but below “Buy Gen”, it is treated / considered as Sidewise. Aggressive Traders can take Long position near “Sell Gen” either retesting or crossed from Below & vice-versa i.e. can take Short position near “Buy Gen” either retesting or crossed downward from Above.
L#4: If the candle crossed & stays below the “Sell Gen”, it is treated / considered a Bearish bias.
L#5: Possibility / Probability of REVERSAL near RLS#1 & USTgt
HZB (Buy side) & HZS (Sell side) => Hurdle Zone,
*** Specialty of “HZB#1, HZB#2 HZS#1 & HZS#2” is Sidewise (behaviour in Nature)
Rest Plotted and Mentioned on Chart
Color code Used:
Green =. Positive bias.
Red =. Negative bias.
RED in Between Green means Trend Finder / Momentum Change
/ CYCLE Change and Vice Versa.
Notice One thing: HOW LEVELS are Working.
Use any Momentum Indicator / Oscillator or as you "USED to" to Take entry.
━━━━━━━━━━━━━━━━━━━━━━━━━━━━━━━━━━━━━━━━━━━
⚠️ DISCLAIMER:
The information, views, and ideas shared here are purely for educational and informational purposes only. They are not intended as investment advice or a recommendation to buy, sell, or hold any financial instruments. I am not a SEBI-registered financial adviser.
Trading and investing in the stock market involves risk, and you should do your own research and analysis. You are solely responsible for any decisions made based on this research.
"As HARD EARNED MONEY IS YOUR's, So DECISION SHOULD HAVE TO BE YOUR's".

Option Buying Strategies (Beginner to Advanced) – Complete Guide1. Understanding Option Buying
An option is a contract that gives the buyer the right, but not the obligation, to buy or sell an underlying asset at a predetermined price (strike price) before or on expiry.
Types of Options
Call Option → Right to buy (bullish view)
Put Option → Right to sell (bearish view)
Why Traders Prefer Option Buying
Limited risk (loss = premium paid)
High leverage
Defined reward–risk ratio
Suitable for directional and event-based trades
2. Key Factors Affecting Option Buying
Before applying any strategy, understanding these factors is critical:
1. Direction (Price Movement)
Options need a strong move in the expected direction.
2. Time Decay (Theta)
Options lose value daily due to time decay.
Buyers should trade when fast movement is expected.
3. Volatility (Vega)
Rising volatility benefits option buyers.
Falling volatility hurts option buyers.
4. Liquidity
Always trade liquid options (NIFTY, BANKNIFTY, FINNIFTY, stock F&O).
3. Basic Option Buying Strategies
1. Long Call Strategy (Bullish)
Market View: Strongly Bullish
Instrument: Buy Call Option
Example:
NIFTY at 22,000
Buy 22,100 CE
Profit: Unlimited if price rises sharply
Loss: Limited to premium paid
Best Used When:
Breakout above resistance
Strong bullish candle
Positive news or earnings
2. Long Put Strategy (Bearish)
Market View: Strongly Bearish
Instrument: Buy Put Option
Example:
NIFTY at 22,000
Buy 21,900 PE
Profit: Increases as price falls
Loss: Limited to premium
Best Used When:
Breakdown below support
Weak market structure
Negative global cues
4. Neutral Option Buying Strategies
3. Long Straddle
Market View: High volatility, direction unknown
Structure: Buy ATM Call + Buy ATM Put
Example:
NIFTY 22,000
Buy 22,000 CE + Buy 22,000 PE
Profit: Big move in either direction
Loss: If market remains sideways
Best Used During:
Budget day
RBI policy
Election results
Major earnings
4. Long Strangle
Market View: Volatile but slightly directional
Structure: Buy OTM Call + Buy OTM Put
Example:
Buy 22,200 CE + 21,800 PE
Advantage: Lower cost than straddle
Disadvantage: Needs larger move
5. Advanced Option Buying Strategies
5. Directional Breakout Buying
Concept: Buy options when price breaks a key level.
Steps:
Identify strong support/resistance
Wait for candle close beyond level
Buy ATM or slightly ITM option
Keep strict stop-loss
Works Best In:
Trending markets
Opening range breakout
High-volume breakouts
6. Pullback Option Buying
Instead of buying at breakout, buy during a retracement.
Example:
NIFTY breaks resistance
Pulls back to retest
Buy Call at support
Advantage:
Lower premium
Better risk–reward
7. Trend-Following Option Buying
Rule: Trade only in the direction of trend.
Indicators Used:
20 & 50 EMA
VWAP
Supertrend
Strategy:
Buy Calls in uptrend
Buy Puts in downtrend
Exit when trend breaks
6. Intraday Option Buying Strategies
8. Opening Range Breakout (ORB)
Mark first 15 or 30 minutes high & low
Break above high → Buy Call
Break below low → Buy Put
Stop-Loss: Below breakout candle
Target: 1:2 or 1:3 RR
9. VWAP-Based Option Buying
Buy Call if price holds above VWAP
Buy Put if price stays below VWAP
Best during trending intraday sessions
7. Positional Option Buying Strategies
10. Event-Based Buying
Used before:
Earnings
Budget
RBI policy
Global data (US Fed)
Risk: IV crush after event
Solution: Exit before announcement or book partial profits.
8. Risk Management in Option Buying
Risk management decides success more than strategy.
Key Rules:
Risk only 1–2% of capital per trade
Always use stop-loss
Avoid overtrading
Trade only liquid strikes
Prefer ATM or ITM options
9. Common Mistakes in Option Buying
Buying far OTM options (lottery mindset)
Ignoring time decay
Trading in low volatility
No stop-loss
Emotional trading
10. Best Indicators for Option Buying
Support & Resistance
Volume
VWAP
RSI (momentum confirmation)
Moving Averages
11. Option Buying vs Option Selling
Factor Option Buying Option Selling
Risk Limited High
Reward Unlimited Limited
Skill Needed Timing Capital & patience
Volatility Needs high Needs low
12. Final Thoughts
Option buying is not gambling when done with discipline. It works best when:
Market is trending
Volatility is expanding
Entries are precise
Risk is controlled
Successful option buyers focus on quality trades, not quantity. One strong move can recover multiple small losses.
