APLAPOLLO : VCP Breakout with Fundamental ConfirmationInitiated a long position in APLAPOLLO following a high-conviction breakout from a multi-month Volatility Contraction Pattern (VCP). Although the price is currently extended from the 20- and 50-day EMAs, the structural strength of the breakout suggests the beginning of a fresh leg in the uptrend.
From a fundamentals perspective, the company continues to deliver strong and consistent sales and EPS growth, reinforcing its positioning as a proxy for India’s infrastructure-led growth cycle.
To manage the risk associated with being extended from the moving averages, I’ve opted for a wider stop-loss, allowing room for short-term volatility or a potential retest of the breakout zone. This approach gives the trade sufficient breathing space while the moving averages gradually catch up to price.
From a broader market standpoint, the recent ~10% correction in ITC following the government’s cigarette tax announcement has created temporary index-level pressure on the Nifty 50. However, this has triggered a clear sectoral rotation rather than broad-based weakness. Capital is rotating out of regulatory-impacted FMCG names and into high-growth industrial leaders like APL Apollo.
Given its insulation from regulatory shocks and its direct linkage to domestic capex growth, APL Apollo is exhibiting strong relative strength even as the broader market remains range-bound.
Initiated the position with 1% risk.
📢📢📢
If my perspective changes or if I gather additional fundamental data that influences my views, I will provide updates accordingly.
Thank you for following along with this journey, and I remain committed to sharing insights and updates as my trading strategy evolves. As always, please feel free to reach out with any questions or comments.
Other posts related to this particular position and scrip, if any, will be attached underneath. Do check those out too.
Disclaimer : The analysis shared here is for informational purposes only and should not be considered as financial advice. Trading in all markets carries inherent risks, and past performance is not indicative of future results. It’s essential to conduct your own research and assess your risk tolerance before making any investment decisions. The views expressed in this analysis are solely mine. It’s important to note that I am not a SEBI registered analyst, so the analysis provided does not constitute formal investment advice under SEBI regulations.
Trend Analysis

BTCUSD – Let the Structure DecidePrice is currently trading inside a well-defined rising channel, where both demand and supply are clearly respected.
This is not random volatility — it’s organized price movement.
After a strong impulsive move, Bitcoin has shifted into a controlled consolidation, allowing the market to absorb supply and reset sentiment. Such phases are essential for any sustainable trend.
At this stage, two scenarios matter:
If price holds the lower channel support, it keeps the structure intact and opens the door for a continuation toward the upper trendline.
If support fails decisively, the next logical area lies at the broader horizontal demand zone below, where higher-timeframe buyers previously stepped in.
This is a wait-and-watch zone, where price behavior near support will decide the next leg — not opinions, news, or emotions.

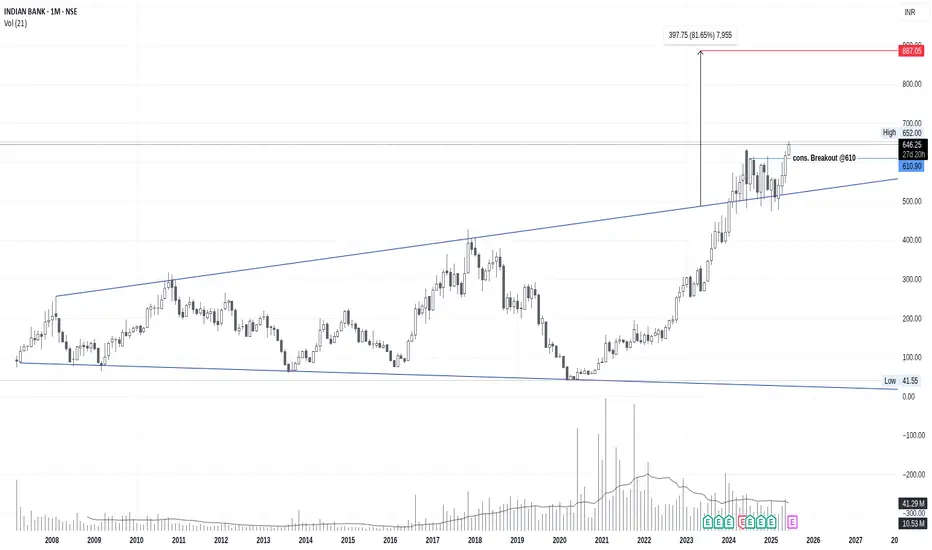
INDIANB : rear Broadening Wedge Pattern Breakout @ ATHIndian Bank stock is showing a very rear Broadening Wedge Pattern Breakout @ ATH good sign to the stock.. and the noted thing is it's happening on monthly chart ...
All data is available in public domain..
CMP : 646
TG : 890
SL : close Below 9 EMA
Stock's selection based on 5 Point Analysis:
1: Idea : Breakout.
2: Support : Volume, Delivery .
3: Technical : 21/55/200-EMA, Super trend up, RS>0 RSI.
4: Fundamental : PE, PAT, Industry & peer PE and sector performance.
5: Timing : Entry Timing on Daily chart.
Disclaimer : It is my personal view as a trader and for educational purpose only. Equity market involves risk .
Please consult your financial adviser before taking any decision.
SILVER - HEALTHY CONSOLIDATION LONGSSilver doing a healthy consolidation - momentum intact.
very strong support for momentum to continue is $90, belov that momentum vill be lost.
small resistance at $93.50
major resistance at $95.50 - $96
above $96 v should likely test 3digits - $100.
above that vill be a price discovery one can trail at ST 1.5 on 75m chart.

INDIANB (Indian Bank)INDIAN BANK is showing a strong and constructive setup.
The stock recently made a fresh all-time high near 894, followed by a healthy pullback, which is a positive sign and often helps in building a stronger base for the next move. Importantly, the pullback was well-controlled, indicating limited selling pressure.
Price has now resumed its upward move and is trading above all key EMAs, reflecting continued strength and bullish momentum. The overall structure remains intact with higher highs and higher lows.
A decisive breakout from the current consolidation zone could open the door for a fresh upside move in the coming sessions.
Keep it in your watchlist.
✅ If you like my analysis, please follow me here as a token of appreciation :) in.tradingview.com/u/SatpalS/
📌 For learning and educational purposes only, not a recommendation. Please consult your financial advisor before investing.

NIFTY – Intraday Structure | Breakout from Bullish ConsolidationOn 5m, 15m and 1H timeframes, NIFTY formed a bearish trendline breakout around 2 PM, followed by a pullback and formation of a bullish intraday consolidation channel.
Price is currently consolidating inside this bullish channel, and a decisive break on either side can define the next intraday move.
🔹 Intraday Plan
Upside Scenario:
Break above bullish channel
Targets:
T1: 25,500
T2: 25,550
T3: 25,650
Stop Loss: 25,300 – 25,280
Downside Scenario:
Break below bullish channel
Targets:
T1: 25,150
T2: 25,000
T3: 24,900 – 24,920
Stop Loss: 25,360 – 25,380
This is a pure intraday range-break setup based on post-breakout bullish consolidation.
⚠️ Disclaimer
I am not a SEBI registered advisor or trader.
This analysis is shared only for educational purposes.
Please consult a registered financial advisor before taking any trading decisions.

HDFCBANK 4HR T/F ANALYSIS----
hdfcbank 4hr t/f analysis----- the top whole structure are bended both side which called structure is elips and it`s also dual direction in cans breakdown of elips into downside so we can measure elips of previous demand can measure body to body measure only green holding volume and interchange into supply so now we have a reversal area in this reversal zone wait for any bullish candle it`s help to confirmation to go with trend ok let`s see---

XRPUSD — Wave 4 Completion in a Fibonacci Confluence ZoneXRP is currently developing a complex Wave 4 correction within a larger impulsive structure.
The internal structure of Wave 4 is unfolding as a W–X–Y correction, where the final leg (Y) is forming as an A–B–C pattern, and the C-wave is nearing completion.
Key Technical Observations
Fibonacci Cluster Confluence
The retracement of Wave 1 → Wave 3 aligns with the 61.8%–78.2% Fibonacci zone, which also matches:
The W–X–Y termination area
A–C extension levels
Higher timeframe liquidity support
This confluence creates a high-probability reaction zone.
Impulse Structure Validation
According to Elliott Wave guidelines:
Wave 4 is allowed to form complex corrections (WXY).
A single liquidity sweep below the WXY low is acceptable.
Sustained price acceptance below the Fibonacci cluster would invalidate the impulsive structure.
Critical Price Level
The $1.50 region is the key decision zone:
Above $1.50 → Wave 4 remains valid, and Wave 5 expansion becomes probable.
Below $1.50 (with strong acceptance) → Impulse failure scenario, signaling a larger corrective cycle.

XAUUSD – ATH now normal, $5,000 target.Market Context – When ATH Is No Longer a Spike
Gold has entered a phase where every pullback is being aggressively bought, signaling strong institutional acceptance of higher prices. The market is no longer reacting emotionally to new highs — instead, ATHs are forming within structure, not as exhaustion.
With:
Persistent safe-haven demand
A cautious Fed outlook
Ongoing geopolitical and macro uncertainty
➡️ $5,000 is evolving from a psychological level into a realistic technical target.
Structure & Price Action (H1)
Bullish structure remains intact with Higher Highs and Higher Lows.
Current declines are corrective pullbacks, not reversals — no bearish CHoCH confirmed.
Price continues to respect the ascending channel and demand zones, confirming trend continuation.
Key takeaway:
👉 No distribution signs at the top — ATHs are being defended by structure.
Trading Plan – MMF Style
Primary Scenario – Trend-Following BUY
Focus on buying pullbacks, not chasing ATH:
BUY Zone 1: 4,837 – 4,782 (Demand + trendline confluence)
BUY Zone 2: 4,713 (Deeper IP / demand zone)
➡️ Execute BUYs only after clear bullish reactions.
➡️ Avoid FOMO at extended levels.
Upside Targets (ATH Continuation):
TP1: 4,919
TP2: 5,027 (Extension zone approaching the $5,000 milestone)
Alternative Scenario
If price holds above 4,919 without a meaningful pullback, wait for a break & retest before looking for continuation BUYs.
Invalidation
H1 close below 4,713 invalidates the bullish structure and requires a full reassessment.
Summary
Gold remains in ATH continuation mode. The optimal strategy is not trying to top-pick, but patiently buying pullbacks in alignment with higher-timeframe flow. At this stage, $5,000 is no longer a question of “if” — only “when.”

GOLD SPOT VIEW GOLD POSSIBLE MOVES
RESISTANCE 5005 5225
SUPPORT 4880 4755
5005 ABOVE SUSTAIN INVALIDATION
View is for study purpose only , we are not recommend any kind of trade or investment
Always do your own analysis

BPCL : Trading the Confluence of Price Action & Macro TailwindsThe stock has been consolidating within a defined range over the past few weeks and has recently started forming a solid base. While the breakout volume isn’t a classic “God-candle,” price action continues to hold firmly above key moving averages, which is a constructive sign. That said, the price is somewhat extended from the EMAs, increasing the probability of a mean-reversion move. Hence, the stop loss needs to be placed wider rather than just below the basing structure.
The conviction behind this trade comes largely from the current Goldilocks macro environment we’re witnessing in early 2026. With global crude prices remaining comfortably low, BPCL is benefiting from strong marketing margins across petrol and diesel, supporting near-term earnings visibility.
On the fundamental side, a major catalyst is the Government’s LPG compensation package. BPCL is expected to receive a significant share of the ₹30,000 crore payout allocated to OMCs, which materially improves cash flows in H2 FY26. This inflow also acts as a strong deleveraging trigger, further strengthening an already improving balance sheet that has seen a steady decline in debt-equity levels over recent quarters.
So took this position with 1% risk on the net capital.
📢📢📢
If my perspective changes or if I gather additional fundamental data that influences my views, I will provide updates accordingly.
Thank you for following along with this journey, and I remain committed to sharing insights and updates as my trading strategy evolves. As always, please feel free to reach out with any questions or comments.
Other posts related to this particular position and scrip, if any, will be attached underneath. Do check those out too.
Disclaimer : The analysis shared here is for informational purposes only and should not be considered as financial advice. Trading in all markets carries inherent risks, and past performance is not indicative of future results. It’s essential to conduct your own research and assess your risk tolerance before making any investment decisions. The views expressed in this analysis are solely mine. It’s important to note that I am not a SEBI registered analyst, so the analysis provided does not constitute formal investment advice under SEBI regulations.

NIFTY – Multi-Timeframe Parallel Channel | Long-Term ViewOn Daily, 4H and 1H timeframes, NIFTY continues to trade inside a bullish parallel channel.
This consolidation has been active from April to December, with price repeatedly respecting both the lower and upper channel boundaries.
At the same time, the upper bullish trendline has been continuously extending from April till date, showing that the primary trend remains intact despite time-wise consolidation.
This reflects a time-based consolidation inside an ongoing uptrend, not a distribution structure.
🔹 Key Observations
Same parallel channel aligned on 1H, 4H and Daily
Consolidation range active from April to December
Upper bullish trendline continuing from April till date
Repeated rejections from both channel boundaries
RSI consistently rejects from oversold zones
Strong historical rejection zone near 24,900 – 24,500
🔹 Long-Term Plan (Positional)
Buy on Dips Zone: Around 25,000
Stop Loss (Invalidation): 24,700 – 24,600 (closing basis)
Targets:
T1: 26,000
T2: 26,400
T3: 26,500 – 26,700 (on trendline breakout)
🔹 Scenarios
Sustained breakout above 26,400 and above the upper channel can lead to further upside continuation.
Breakdown below 25,000 can turn the bias negative.
Historically, deep breakdowns have occurred only during extreme events.
Until any major impact news appears, channel continuation remains the higher-probability structure.
⚠️ Disclaimer
I am not a SEBI registered advisor or trader.
This analysis is shared only for educational purposes.
Please consult a registered financial advisor before taking any trading or investment decisions

Option Trading Strategies1. Covered Call – Best for Conservative Income Traders
Market view: Neutral to mildly bullish
Risk level: Low
Who it’s for: Long-term investors, swing traders, income seekers
A covered call involves owning the underlying stock and selling a call option against it. You earn option premium as income while holding the stock.
How it works:
Buy or hold shares
Sell an out-of-the-money (OTM) call
If price stays below strike → keep premium
If price rises above strike → shares get called away at a profit
Why it’s powerful:
Generates regular income
Lowers cost basis of stock
Works well in sideways markets
Risk: Limited upside if stock rallies strongly
Best use: Stable stocks, index ETFs (NIFTYBEES, BANKBEES)
2. Cash-Secured Put – Smart Way to Buy Stocks Lower
Market view: Neutral to bullish
Risk level: Low to moderate
Who it’s for: Investors who want to accumulate stocks
Here, you sell a put option while keeping enough cash to buy the stock if assigned.
How it works:
Sell OTM put
Collect premium
If price stays above strike → profit = premium
If price falls → you buy stock at lower effective price
Why traders love it:
You get paid to wait
Safer than blindly buying dips
Works best in high-IV markets
Risk: Downside if stock collapses
Best use: Quality stocks you actually want to own
3. Long Call – High Conviction Bullish Strategy
Market view: Strongly bullish
Risk level: Moderate
Who it’s for: Momentum traders, event traders
A long call gives you the right (not obligation) to buy at a fixed price.
How it works:
Buy call option
Risk limited to premium
Upside theoretically unlimited
Why it works:
Leverage with defined risk
Best during breakouts, earnings, trend reversals
Key risk: Time decay (theta)
Tip: Use when direction + timing are both strong
4. Long Put – Best for Market Crashes & Hedging
Market view: Strongly bearish
Risk level: Moderate
Who it’s for: Hedgers, short-term traders
A long put profits when prices fall.
Why it’s important:
Portfolio insurance during crashes
Explosive profits in sharp sell-offs
Risk: Option expires worthless if market doesn’t fall
Best use: Breakdowns, global risk-off events, earnings disappointments
5. Bull Call Spread – Controlled Bullish Strategy
Market view: Moderately bullish
Risk level: Lower than long call
Who it’s for: Risk-aware traders
This involves:
Buying one call
Selling a higher strike call
Why it’s smart:
Lower cost than buying naked call
Defined risk and reward
Less affected by time decay
Downside: Limited profit
Best use: When you expect a limited upward move
6. Bear Put Spread – Structured Bearish Play
Market view: Moderately bearish
Risk level: Controlled
Who it’s for: Traders expecting slow declines
Similar to bull spread but on the downside.
Advantages:
Cheaper than long put
Reduced volatility risk
Better probability of success
Best use: Gradual downtrends, resistance breakdowns
7. Iron Condor – Best Sideways Market Strategy
Market view: Range-bound
Risk level: Moderate (defined)
Who it’s for: Experienced income traders
Iron condor combines:
Bull put spread
Bear call spread
Goal: Profit from time decay and low volatility
Why it’s popular:
High probability
Works well in indices
Non-directional
Risk: Big moves beyond range
Best use: Low-IV environments before expiry
8. Short Straddle / Strangle – Volatility Selling Strategy
Market view: Low volatility expected
Risk level: High
Who it’s for: Advanced traders only
You sell:
Straddle → ATM call + put
Strangle → OTM call + put
Profit comes from:
Time decay
Volatility crush
Major risk: Unlimited losses if market explodes
Best use: Indices with strict risk management (hedges mandatory)
9. Calendar Spread – Time Decay Exploitation
Market view: Neutral to mildly directional
Risk level: Moderate
Who it’s for: Volatility traders
You sell a near-expiry option and buy a far-expiry option at same strike.
Why it works:
Front-month options decay faster
Gains from IV expansion
Best use: Pre-event, slow-moving stocks
10. Protective Put – Portfolio Insurance Strategy
Market view: Long-term bullish, short-term uncertain
Risk level: Low
Who it’s for: Investors protecting large portfolios
How it works:
Hold stock
Buy put option
Benefit:
Caps downside risk
Allows peace of mind during volatility
Cost: Insurance premium
Best use: Elections, Fed meetings, earnings seasons
Final Thoughts: Which Strategy Is “Best”?
There is no single best option strategy—only the right strategy for the right market condition.
Market Condition Best Strategies
Strong bullish Long Call, Bull Call Spread
Mild bullish Covered Call, Cash-Secured Put
Sideways Iron Condor, Calendar Spread
Bearish Long Put, Bear Put Spread
High volatility Debit spreads
Low volatility Credit spreads, Condors
Professional option traders focus on:
Probability
Risk control
Volatility, not just direction

Index Rebalancing Impact — A Deep Dive1. What Is Index Rebalancing?
Index rebalancing is the periodic process by which an index provider adjusts the constituents and weightings of an index to ensure it continues to represent its stated objective. Most indices follow predefined rules based on market capitalization, liquidity, free float, sector classification, or fundamental criteria. Over time, stock prices move, companies grow or shrink, and new firms emerge while others decline. Rebalancing realigns the index with its methodology.
For example:
A market-cap-weighted index increases the weight of stocks that have risen in value and reduces those that have fallen.
A factor index (value, momentum, quality) updates its holdings based on changes in factor scores.
A benchmark like Nifty 50 or S&P 500 may add or remove companies based on eligibility rules.
Rebalancing typically occurs quarterly, semi-annually, or annually, depending on the index.
2. Why Rebalancing Has Market Impact
The real impact comes not from the index itself, but from the trillions of dollars benchmarked to indices. Passive funds—ETFs, index mutual funds, pension mandates—are forced buyers and sellers. When an index changes, these funds must trade, regardless of valuation or fundamentals.
This creates:
Predictable flows
Temporary demand–supply imbalances
Short-term price distortions
In markets like India, where ETF penetration is growing rapidly, index rebalancing effects have become increasingly visible.
3. Types of Index Rebalancing Effects
a) Weight Adjustment Effect
Even if no stock is added or removed, weights change. A stock whose market cap has increased will see higher demand from index funds, while a laggard may face selling pressure. This often leads to price drift in the days leading up to the rebalance.
b) Addition Effect
When a stock is added to a major index:
Index funds must buy it
Liquidity improves
Analyst coverage often increases
Empirically, additions tend to experience short-term price jumps around the announcement and effective date. This is known as the index inclusion premium.
c) Deletion Effect
Stocks removed from indices face forced selling, often resulting in:
Short-term price drops
Higher volatility
Reduced liquidity
Over the long term, many deleted stocks stabilize, but the immediate impact can be sharp.
4. Announcement Date vs. Effective Date
Index rebalancing impact typically unfolds in two phases:
Announcement Date
Index provider announces changes
Active traders and arbitrage funds position early
Prices often react immediately
Effective Date (Rebalance Day)
Passive funds execute trades, often at the close
Spikes in volume and volatility
Temporary price pressure peaks
In highly liquid markets, much of the impact is front-run before the effective date. In less liquid stocks, the bulk of the move can happen on the rebalance day itself.
5. Liquidity and Market Structure Matter
The magnitude of index rebalancing impact depends heavily on liquidity.
Large-cap, liquid stocks: Impact is usually modest and short-lived.
Mid-cap and small-cap stocks: Effects can be dramatic, with multi-day price swings.
Free-float adjustments: Changes in free float can trigger large reweights even if fundamentals are unchanged.
In India, small-cap index rebalancing often leads to outsized moves, because passive AUM is large relative to daily traded volumes.
6. Sector and Factor Index Rebalancing
Rebalancing isn’t limited to broad market indices.
Sector indices rebalance when sector classifications change or relative sizes shift.
Factor indices (momentum, low volatility, value) rebalance more frequently and aggressively.
Factor rebalancing can create crowded trades:
Momentum indices buy recent winners and sell losers, reinforcing trends.
Low-volatility indices may dump stocks that become volatile during market stress, worsening drawdowns.
This mechanical behavior can amplify market cycles.
7. Short-Term Distortions vs. Long-Term Reality
A crucial point: index rebalancing does not change fundamentals. Revenue, earnings, and cash flows remain the same. The price impact is largely technical.
Short term:
Prices may overshoot
Volatility rises
Correlations increase
Long term:
Prices often mean-revert
Fundamental performance reasserts itself
This creates opportunities for disciplined investors who can distinguish between flow-driven moves and genuine fundamental changes.
8. Strategies Around Index Rebalancing
Professional investors actively design strategies to exploit these effects:
Index inclusion arbitrage: Buy stocks likely to be added before the announcement.
Event-driven trading: Trade the announcement-to-effective date window.
Contrarian strategies: Buy deleted stocks after forced selling exhausts.
Liquidity provision: Provide liquidity to index funds on rebalance day at favorable prices.
However, these strategies are competitive and require precise execution and cost control.
9. Risks and Unintended Consequences
Index rebalancing also introduces systemic risks:
Price inefficiency: Mechanical flows override price discovery.
Crowding: Too much capital chasing the same index names.
Volatility spikes: Especially near market closes on rebalance days.
Feedback loops: Rising prices lead to higher weights, attracting more inflows.
In extreme cases, this can lead to index bubbles, where valuation becomes secondary to index membership.
10. Growing Importance in Modern Markets
As passive investing grows, index rebalancing impact is becoming more powerful. Markets are increasingly shaped not just by fundamentals, but by rules, calendars, and flows. For long-term investors, understanding rebalancing helps avoid emotional reactions to short-term noise. For active traders, it provides a repeatable, data-driven edge.
Conclusion
Index rebalancing is a mechanical process with very real market consequences. It drives predictable buying and selling, creates short-term distortions, and occasionally offers attractive trading opportunities. While the impact is usually temporary, its influence on liquidity, volatility, and price behavior is undeniable. In today’s markets, ignoring index rebalancing means missing a key piece of the puzzle that explains why prices sometimes move without any obvious fundamental reason.

How AI Predicts Market Moves1. Data: The Foundation of AI Market Prediction
AI does not “guess” market direction. It learns from data.
Types of Data Used
Price data: Open, high, low, close (OHLC), volume
Order-book data: Bid–ask spreads, depth, liquidity shifts
Technical indicators: RSI, MACD, moving averages, volatility
Fundamental data: Earnings, balance sheets, macro indicators
Alternative data: News, social media sentiment, Google trends
Cross-asset data: Bonds, commodities, currencies, crypto
AI models look at how these datasets interact across timeframes. For example, a sudden rise in bond yields combined with declining liquidity may historically precede equity sell-offs.
2. Pattern Recognition Beyond Human Ability
Traditional technical analysis relies on visual patterns like head-and-shoulders or support and resistance. AI goes much deeper.
What AI Finds
Micro-patterns invisible to the naked eye
Non-linear relationships (A affects B only when C is present)
Regime changes (bull, bear, sideways markets)
Probabilistic outcomes, not certainties
For example, AI might learn that when volatility compresses for 14–18 sessions and volume drops below a threshold, the probability of a sharp breakout increases by 62%.
3. Machine Learning Models Used in Markets
Different AI models specialize in different tasks.
a) Supervised Learning
Used when historical outcomes are known.
Predict next-day return
Classify market as bullish/bearish
Forecast volatility or drawdown risk
Common models:
Linear & Logistic Regression
Random Forests
Gradient Boosting (XGBoost, LightGBM)
These models are popular in swing trading and factor investing.
b) Unsupervised Learning
Used when patterns are unknown.
Market regime detection
Asset clustering
Correlation breakdown analysis
Examples:
K-Means Clustering
Principal Component Analysis (PCA)
This helps funds rotate strategies when market behavior changes.
c) Deep Learning
Used for complex, sequential data.
LSTM / GRU networks: Learn long-term price memory
CNNs: Treat charts like images
Transformers: Capture multi-timeframe dependencies
Deep learning excels in high-frequency trading and multi-asset forecasting.
d) Reinforcement Learning
AI learns by trial and error, similar to how a trader adapts.
Chooses actions: buy, sell, hold
Receives rewards or penalties
Optimizes trading policy over time
This is widely used in algorithmic execution and portfolio allocation.
4. Sentiment Analysis: Reading Market Psychology
Markets are driven by emotion as much as fundamentals.
AI processes:
News headlines
Earnings call transcripts
Social media posts
Analyst reports
Using Natural Language Processing (NLP), AI converts text into numerical sentiment scores:
Positive
Neutral
Negative
Fear vs greed intensity
For example, if sentiment turns sharply negative while prices hold support, AI may detect a potential contrarian bounce.
5. Timeframe Intelligence
AI does not rely on a single timeframe.
Short-term: milliseconds to minutes (HFT)
Medium-term: days to weeks (swing trading)
Long-term: months to years (asset allocation)
By stacking timeframes, AI avoids false signals. A short-term sell signal may be ignored if the long-term trend remains strongly positive.
6. Probability-Based Forecasting (Not Certainty)
AI does not predict exact prices. It predicts probabilities.
Example output:
65% probability market closes higher tomorrow
20% probability of range-bound movement
15% probability of sharp downside move
Professional traders use this to:
Size positions
Adjust stop-losses
Hedge tail risk
This probabilistic thinking is why AI performs better during volatile markets.
7. Risk Management and Drawdown Control
AI models focus as much on risk as on returns.
They monitor:
Volatility expansion
Correlation spikes
Liquidity stress
Tail-risk events
When risk rises, AI may:
Reduce exposure
Shift to defensive assets
Increase cash allocation
Trigger hedging strategies
This is a key reason AI funds often survive crashes better than discretionary traders.
8. Continuous Learning and Adaptation
Markets evolve. Strategies decay.
AI systems:
Retrain on new data
Detect performance degradation
Retire failing models
Combine multiple models into ensembles
This adaptability is crucial because patterns that worked last year may fail today.
9. Why AI Still Fails Sometimes
AI is powerful—but not magical.
Limitations include:
Black swan events (wars, pandemics)
Data bias or overfitting
Sudden regulatory changes
Market manipulation
That’s why the best systems combine AI + human oversight.
10. The Future of AI in Market Prediction
AI is moving toward:
Real-time macro interpretation
Cross-market reflexivity models
AI-driven portfolio construction
Personalized trading assistants
In the future, AI won’t just predict markets—it will design strategies dynamically based on each investor’s risk profile.
Conclusion
AI predicts market moves by learning from massive datasets, recognizing complex patterns, analyzing sentiment, and adapting to changing conditions. It does not replace human judgment but enhances it by removing emotion, bias, and speed limitations. In modern markets, AI is no longer optional—it is becoming the core engine behind trading, investing, and risk management.

Data Centre & Semiconductor Theme Trading A Deep-Dive for Market Participants
The data centre and semiconductor theme has emerged as one of the most powerful structural trades of the decade. It sits at the intersection of AI, cloud computing, digitalization, electrification, and geopolitics, making it a multi-year secular opportunity rather than a short-term cyclical play. For traders and investors, this theme offers momentum bursts, relative-value trades, and long-term compounding stories—if approached with the right framework.
1. Why This Theme Matters
At its core, every digital action—AI inference, cloud storage, video streaming, fintech transactions, autonomous driving—ultimately ends up in data centres powered by semiconductors.
Think of the chain as:
AI / Cloud Demand → Data Centres → Chips → Equipment → Power & Cooling
This creates a stacked value chain where multiple listed companies benefit simultaneously, but at different points in the cycle. Theme trading is about identifying which layer is leading and which is lagging.
2. Structural Demand Drivers
a) Artificial Intelligence Explosion
Generative AI, LLMs, and enterprise AI workloads are orders of magnitude more compute-intensive than traditional applications.
Training AI models requires high-end GPUs / accelerators
Inference workloads demand low latency, high bandwidth memory
AI data centres consume 2–4× more power than traditional centres
This directly fuels demand for:
Advanced semiconductors
Memory (HBM, DRAM)
Networking chips
Power management ICs
b) Cloud & Hyperscale Capex Cycles
Hyperscalers (AWS, Azure, Google, Meta) invest in multi-year capex waves. When capex accelerates:
Semiconductor orders surge first
Data centre construction follows
Cooling, power, and networking companies benefit later
Traders track capex guidance as a leading indicator.
c) Digital Sovereignty & Geopolitics
Governments want domestic chip manufacturing for security reasons:
US CHIPS Act
EU Chips Act
India Semiconductor Mission
This adds a policy-driven floor to semiconductor demand, even during economic slowdowns.
3. Key Segments Within the Theme
a) Semiconductor Designers (High Beta Leaders)
These companies design chips but outsource manufacturing.
Traits
Highest operating leverage
Strong momentum during AI upcycles
Sharp drawdowns during corrections
Trading View
Best for momentum and breakout strategies
Sensitive to earnings surprises and guidance
b) Foundries & Manufacturers
Companies that actually fabricate chips.
Traits
Capital intensive
Long-term contracts
Less volatile than designers
Trading View
Suitable for swing trades around utilization rates
React strongly to capex and yield improvement news
c) Semiconductor Equipment & Materials
They supply lithography, etching, deposition, chemicals, and wafers.
Traits
Benefit before chips are sold
Orders lead end-market demand by 2–4 quarters
Trading View
Ideal for early-cycle positioning
Strong relative performance when capex cycles turn up
d) Data Centre Infrastructure & REITs
Includes:
Data centre builders
Power distribution
Cooling systems
Data centre REITs
Traits
More stable cash flows
Yield + growth combination
Trading View
Better for positional and defensive thematic trades
Outperform during rate cuts or stable macro environments
4. How Theme Trading Actually Works
a) Momentum Phase Trading
When AI or cloud narratives dominate headlines:
Leaders break out of long consolidations
Volume expansion confirms institutional participation
Indicators used
Relative strength vs index
20/50-DMA trend alignment
Sectoral ETF flows
b) Rotation Trades Inside the Theme
Not all sub-segments lead together.
Typical rotation:
Chip designers lead
Equipment stocks catch up
Data centre infra plays follow
Power & cooling benefit last
Advanced traders rotate capital within the theme, not out of it.
c) Mean Reversion & Pullback Buying
Even strong secular themes correct 20–30%.
High-probability setups:
Pullbacks to rising 50-DMA
RSI reset without trend break
Volume contraction during corrections
5. Valuation vs Growth: The Constant Debate
Semiconductor and data centre stocks often look expensive on traditional metrics.
Key point:
In secular tech cycles, earnings catch up to price, not the other way around.
Smart traders:
Focus on forward earnings revisions
Track order backlog growth
Watch capex-to-revenue ratios
Overvaluation becomes a risk only when growth decelerates.
6. Macro Risks to Watch
a) Interest Rates
Data centres are capital-intensive
Higher rates compress valuations, especially REITs
b) Cyclical Slowdowns
Consumer electronics downturns affect legacy chip demand
AI demand may offset but not fully eliminate cyclicality
c) Supply Chain Bottlenecks
Advanced nodes depend on few suppliers
Delays can cause earnings volatility
7. India Angle in This Theme
India is becoming relevant in:
Data centre construction (cloud, fintech, OTT demand)
Semiconductor assembly, testing, and packaging (ATMP)
Power infrastructure and cooling solutions
Indian traders often use:
Global semiconductor indices as trend indicators
Domestic infra & power plays as satellite trades
This creates cross-market correlation opportunities.
8. Portfolio Construction for Theme Traders
A balanced approach:
40% Momentum Leaders – High beta semiconductor names
30% Enablers – Equipment, power, cooling
20% Stability – Data centre REITs / infra
10% Tactical Cash – For sharp corrections
Risk management is critical because these stocks move together during risk-off phases.
9. Why This Is a Multi-Year Trade
Unlike past tech cycles, this theme is supported by:
AI workload explosion
Government policy support
Long-duration capex visibility
Structural digital dependency
This makes the data centre & semiconductor trade closer to an “infrastructure cycle” than a traditional tech boom.
10. Final Takeaway
Data centre and semiconductor theme trading is not about picking one stock—it’s about understanding the ecosystem and riding capital flows. The biggest edge comes from:
Identifying which layer is leading
Entering during healthy pullbacks
Rotating within the theme rather than abandoning it
For traders who respect trend structure and manage risk, this theme remains one of the cleanest, most powerful opportunities of the current decade.
Renewable Energy Certificates (RECs) and Carbon Credits1. Introduction: Why RECs and Carbon Credits Matter
As countries, corporations, and investors push toward net-zero emissions, two market-based instruments have become central to climate policy and sustainable finance: Renewable Energy Certificates (RECs) and Carbon Credits.
Both aim to reduce greenhouse gas (GHG) emissions, but they operate in different markets, address different problems, and serve different compliance and voluntary needs. Understanding their structure, pricing, and role is critical for policymakers, power producers, corporates, and traders—especially in fast-growing markets like India.
2. Renewable Energy Certificates (RECs): Core Concept
A Renewable Energy Certificate (REC) represents proof that 1 megawatt-hour (MWh) of electricity has been generated from a renewable energy source such as solar, wind, hydro, biomass, or geothermal.
When a renewable power producer generates electricity:
The physical electricity flows into the grid
The environmental attribute is unbundled and issued as a REC
This separation allows electricity consumers to claim renewable usage even if the physical power they consume is from the conventional grid mix.
3. Purpose of RECs
The primary objectives of RECs are:
Regulatory Compliance
In many countries, utilities and large power consumers must meet Renewable Purchase Obligations (RPOs). RECs allow entities that cannot physically procure green power to meet these obligations financially.
Market-Based Incentives
RECs provide additional revenue to renewable generators, improving project viability without direct subsidies.
Corporate Sustainability Claims
Corporates use RECs to meet ESG targets, claim renewable sourcing, and comply with Scope 2 emission accounting under GHG Protocols.
4. REC Markets: Compliance vs Voluntary
Compliance REC Markets
Mandated by government regulation
Prices often volatile and policy-driven
Examples:
India (Solar & Non-Solar RECs)
US state-level Renewable Portfolio Standards (RPS)
Voluntary REC Markets
Purchased by corporates or individuals
Focus on brand value, ESG disclosure, and carbon neutrality
Examples:
International Renewable Energy Certificates (I-RECs)
Guarantees of Origin (EU)
5. India’s REC Framework
India’s REC mechanism is overseen by CERC and operated via power exchanges like IEX and PXIL.
Key features:
Solar RECs and Non-Solar RECs
Issued by the National Load Despatch Centre (NLDC)
Traded through exchange-based auctions
Used for RPO compliance by DISCOMs, open-access consumers, and captive users
India’s REC prices have historically been:
Highly cyclical
Influenced by RPO enforcement
Sensitive to supply-demand mismatches
6. Carbon Credits: Core Concept
A Carbon Credit represents the reduction or removal of 1 metric tonne of CO₂ equivalent (tCO₂e) from the atmosphere.
Unlike RECs (which are linked to energy generation), carbon credits are linked directly to emission reductions, regardless of the sector.
Carbon credits are generated through projects such as:
Renewable energy installations
Afforestation and reforestation
Methane capture
Energy efficiency upgrades
Industrial process improvements
7. Carbon Markets: Compliance vs Voluntary
Compliance Carbon Markets
Created under international or national regulation.
Examples:
EU Emissions Trading System (EU ETS)
China National ETS
California Cap-and-Trade
Key traits:
Mandatory caps on emissions
Allowances traded among regulated entities
Prices often reflect marginal abatement cost
Voluntary Carbon Markets (VCM)
Used by corporates to offset emissions beyond regulatory requirements.
Standards include:
Verra (VCS)
Gold Standard
American Carbon Registry (ACR)
VCM prices vary widely depending on:
Project type
Vintage year
Verification quality
Co-benefits (biodiversity, social impact)
8. Key Differences: RECs vs Carbon Credits
Aspect RECs Carbon Credits
Unit 1 MWh renewable power 1 tonne CO₂e
Purpose Renewable sourcing Emission offset
Scope Electricity only Multi-sector
Accounting Scope 2 Scope 1, 2, or 3
Market Power & ESG Climate finance
Permanence Linked to generation Linked to reduction/removal
9. Corporate Use Cases
Corporates often use both instruments together:
RECs → Claim renewable electricity usage
Carbon credits → Offset residual emissions
For example:
A data center uses RECs to claim 100% renewable power
It then purchases carbon credits to offset diesel backup, logistics, and Scope 3 emissions
10. Price Dynamics and Risks
REC Price Drivers
RPO targets and enforcement
Renewable capacity additions
Regulatory changes
DISCOM financial health
Carbon Credit Price Drivers
Climate policy ambition
Corporate net-zero commitments
Quality and credibility of credits
Supply constraints for nature-based projects
Key Risks
Double counting
Greenwashing
Policy reversals
Low-quality offsets undermining credibility
11. Emerging Trends
Article 6 of Paris Agreement
Enables cross-border carbon trading and international credit transfers.
High-Integrity Carbon Credits
Shift toward removal-based credits (DAC, biochar).
India’s Carbon Market (ICM)
India is transitioning from PAT & REC mechanisms toward a unified Indian Carbon Credit Trading Scheme (CCTS).
Tokenization & Digital MRV
Blockchain-based tracking for transparency and trust.
12. Investment and Trading Perspective
For investors and traders:
RECs offer policy-driven cyclical trades
Carbon credits represent a long-term structural decarbonization play
Quality differentiation will drive price dispersion
Carbon markets may become a new asset class, similar to power and gas
13. Conclusion
Renewable Energy Certificates and Carbon Credits are cornerstones of market-based climate action. RECs accelerate renewable adoption by monetizing clean energy attributes, while carbon credits provide flexibility in achieving emission reduction targets across the economy.
As climate regulation tightens and ESG scrutiny deepens, these instruments will evolve from niche compliance tools into strategic financial assets, shaping energy markets, corporate strategy, and global capital flows.

GIFTNIFTY Feb 2026 Fut Roll-Over Swing Levels For 23rd JAN 2026Roll-Over: GIFTNIFTY Feb 2026 Fut ntraSwing Levels For 23rd JAN 2026
🚀Follow & Compare NIFTY spot Post for Taking Trade
🚀Follow GIFTNIFTY Post for NF levels
Sometime Opposite Direction Found in NIFTY Spot, NIFTY Jan EXO & NIFTY FEB Exp. better tp long at that juncture.
^^^^^^^^^^^^_______________^^^^^^^^^^^^^^
💥Level Interpretation / description:
L#1: If the candle crossed & stays above the “Buy Gen”, it is treated / considered as Bullish bias.
L#2: Possibility / Probability of REVERSAL near RLB#1 & UBTgt
L#3: If the candle stays above “Sell Gen” but below “Buy Gen”, it is treated / considered as Sidewise. Aggressive Traders can take Long position near “Sell Gen” either retesting or crossed from Below & vice-versa i.e. can take Short position near “Buy Gen” either retesting or crossed downward from Above.
L#4: If the candle crossed & stays below the “Sell Gen”, it is treated / considered a Bearish bias.
L#5: Possibility / Probability of REVERSAL near RLS#1 & USTgt
HZB (Buy side) & HZS (Sell side) => Hurdle Zone,
*** Specialty of “HZB#1, HZB#2 HZS#1 & HZS#2” is Sidewise (behaviour in Nature)
Rest Plotted and Mentioned on Chart
Color code Used:
Green =. Positive bias.
Red =. Negative bias.
RED in Between Green means Trend Finder / Momentum Change
/ CYCLE Change and Vice Versa.
Notice One thing: HOW LEVELS are Working.
Use any Momentum Indicator / Oscillator or as you "USED to" to Take entry.
━━━━━━━━━━━━━━━━━━━━━━━━━━━━━━━━━━━━━━━━━━━
⚠️ DISCLAIMER:
The information, views, and ideas shared here are purely for educational and informational purposes only. They are not intended as investment advice or a recommendation to buy, sell, or hold any financial instruments. I am not a SEBI-registered financial adviser.
Trading and investing in the stock market involves risk, and you should do your own research and analysis. You are solely responsible for any decisions made based on this research.
"As HARD EARNED MONEY IS YOUR's, So DECISION SHOULD HAVE TO BE YOUR's".
━━━━━━━━━━━━━━━━━━━━━━━━━━━━━━━━━
❇️ Follow notification about periodical View
💥 Do Comment for Stock WEEKLY Level Analysis.🚀
📊 Do you agree with this view?
✈️ HIT THE PLANE ICON if this technical observation resonates with you. It will Motivate me.
━━━━━━━━━━━━━━━━━━━━━━━━━━━━━━━━━
💡 If You LOOKING any CHART & want for Level and ANALYZE?
Share your desired stock names in the comments below! I will try to analyze the chart Levels, patterns and share my technical view (so far my Knowledge).
If Viewers think It can identify meaningful setups. Looking forward to hearing from all of you — let's keep this discussion going and help each other make better trading decisions.

SILVER (XAGUSD) 1HRsWING TRADE
- EARN WITH ME DAILY 10K-20K –
SILVER (XAGUSD) Looking good for upside..
When it break level 93053 and sustain.. it will go upside...
BUY@ 93053
Target
1st 96004
2nd 98886
Enjoy trading traders.. Keep add this STOCK in your watch list..
Big Investor are welcome to join the ride ..
Like this Post??? Hit like button..!!!
Follow me for FREE Educational Post and Alert..

Bullish Ascending Triangle Spotted in Coforge LimitedCoforge Limited, formerly known as NIIT Technologies, is a promising stock in the future segment and is currently forming a bullish ascending triangle on the charts. Since May 2024, the stock has remained range-bound, characterized by higher lows and a flat resistance zone, which is a classic bullish continuation structure.
A key positive visible on the chart is the presence of a Law Of Polarity zone coinciding with the support area. This confluence significantly increases the probability of a valid and strong support, reinforcing the bullish bias. Additionally, clear volume spikes near each higher low indicate healthy accumulation and confirm the strength of the reversals at support levels.
From this structure, the stock has the potential to move upward, and upon a decisive breakout, it may deliver three upside targets:
First target: around 2400
Second target: around 3150
Final target: around 4500
However, it is important to note that the entire bullish setup will be invalidated if the price breaks and closes decisively below 1520.
Stock will take time to complete targets, all the patterns look awesome on chart but there are 100 of other possibilities, always give priority to capital protection and apply logical stoploss.

Understanding Long-Term Breakouts: Lessons from JINDALSTEL📈 Understanding Long-Term Breakouts: Lessons from JINDALSTEL
1. Long-Term Breakout: Why It Matters
A long-term breakout occurs when a stock surpasses a major resistance level that has held for years.
In JINDALSTEL’s case, the August 2010 high of ₹796 was finally breached in March 2024, after nearly 14 years.
Such breakouts are significant because they often mark a shift in market perception—investors are willing to pay higher prices than ever before, signaling confidence in the company’s future.
Key Insight: The longer the resistance holds, the more powerful the breakout tends to be, as it represents years of accumulated supply being absorbed.
2. Resistance Turned Support: The Golden Rule
Once a resistance level is broken, it often becomes a new support level.
JINDALSTEL pulled back to this zone (around ₹796–₹800), tested it, and then reversed upward.
This behavior shows that buyers defended the level, confirming its importance.
Why It Matters:
Respecting resistance-turned-support validates the breakout.
It reassures traders that the move wasn’t a false breakout but a genuine shift in demand.
3. Latest High Breakout: Continuation of Buying Interest
After the pullback, the stock began breaching its latest weekly highs.
This indicates follow-up buying—new participants are entering, and existing holders are adding positions.
A breakout after a successful retest of support is often seen as a high-probability continuation pattern.
Takeaway:
Breakouts after pullbacks are stronger than straight-line moves because they show healthy consolidation and renewed demand.
4. Risk Management: The Unsung Hero
Even the strongest chart setups require disciplined risk management:
Stop-loss placement: Below the new support (₹796–₹800 zone in this case).
Position sizing: Avoid overexposure; allocate capital wisely.
Trend awareness: Long-term breakouts can be powerful, but corrections are inevitable.
Avoid chasing: Enter near support or on confirmed breakouts, not in the middle of volatile moves.
5. Investor & Trader Takeaways
For Investors:
Long-term breakouts often signal a new growth phase.
Sustaining above old highs shows structural strength in the company.
For Traders:
Respect resistance-turned-support zones—they are ideal entry points.
Breakouts after pullbacks are high conviction trades.
Always pair technical setups with risk management discipline.
✨ Final Thoughts
JINDALSTEL’s chart is a textbook example of how markets reward patience.
A 14-year breakout signals a major shift.
The pullback to support and reversal confirms strength.
The latest high breakout shows continued buying interest.
For both investors and traders, this case highlights the importance of respecting technical levels, waiting for confirmation, and managing risk effectively.

Biocon: Range to Trend Expansion in ProgressBiocon’s weekly chart highlights a well-structured range-bound consolidation transitioning into a rising trend. Over the past several quarters, the stock has repeatedly faced supply near the upper resistance zone around 400–420, as marked by multiple rejections. This clearly establishes a strong overhead resistance where sellers have historically dominated.
On the downside, price action has respected a rising support trendline, forming higher lows over time. Each dip toward this support zone has attracted fresh buying interest, indicating accumulation at lower levels. This combination of flat-to-rising resistance and rising support reflects improving demand strength and a gradual tightening of price structure.
The recent pullback toward the support area near 360–370 is technically healthy rather than bearish. Such retracements often act as retest phases, allowing the market to absorb supply before attempting the next directional move. As long as Biocon holds above this rising support, the broader bullish structure remains intact.
A decisive weekly close above the resistance band (420+) would confirm a breakout from this prolonged consolidation. Post-breakout, the chart opens room for a strong upside expansion, with projected targets gradually extending toward the 460–500 zone based on the height of the prior range and trend continuation principles.
From a risk perspective, the setup stays valid while price sustains above the rising trendline. A breakdown below this support would delay the bullish thesis and could push the stock back into consolidation. Until then, Biocon remains in a favorable positional structure, where patience around support and confirmation near resistance can offer high-quality risk–reward opportunities for medium- to long-term traders and investors.

XAUUSD 4HR T/F ----- FORMATION OF ARC ---
xauusd 4hr t/f analysis------
formation of arc and it`s dual direction structure bow current situation we can expect breakdown of down side then we can see previous demand interchange into supply like structure mapping let`s see
