USDCHF – Liquidity Sweep at Weak Low + Discount Rejection📌 Trade Idea
USDCHF has tapped into a deep discount zone, swept the weak low, and reacted sharply from a higher-timeframe demand region. After the downside sweep, price formed multiple rejection wicks, indicating that sellers are exhausting and buyers are defending this level.
Market structure shows a strong bearish leg, but we have now reached the extreme end of the move, offering potential for a corrective long retracement back into premium levels.
🔍 Key Confluences
Weak Low Taken: Liquidity sweep below 0.7880–0.7870
Price in Discount Zone: Massive inefficiency + HTF demand area
Rejection Wicks: Clear signs of absorption and buy-side willingness
Potential CHoCH Forming: Early structure shift underway
Imbalances Above: Clean FVGs acting as magnets toward 0.7940–0.7960
Entry Zone: 0.7885 – 0.7892
Stop Loss: Below the sweep → 0.7861
Take Profit 1: 0.7924 (first imbalance)
Take Profit 2: 0.7945 (mid-structure FVG)
Take Profit 3: 0.7960 (equilibrium area / bearish order block)
Risk-Reward: 1:2.0 – 1:3depending on execution
Bias: Short-term bullish pullback inside a larger bearish trend
Disclaimer: For educational purpose only.
Trend Analysis

US100 📌 Trade Idea
US100 has tapped into the discount zone and swept a weak low, reacting strongly from a higher-timeframe demand region. The price is consolidating inside a falling wedge, and each downside push is being aggressively rejected, showing exhaustion of sellers.
A clear CHoCH attempt is visible, and with multiple imbalances above along with a clean supply zone, the index is setting up for a corrective bullish move toward premium pricing.
🔍 Key Confluences
Weak Low Taken: Liquidity sweep below 25,000
Price in HTF Discount: Strong demand zone + imbalance
Falling Wedge Pattern: Typical reversal structure
Multiple Rejection Wicks: Buyers defending the same level repeatedly
FVG/Open Imbalance Above: Large inefficiency toward 25,300–25,450
EQ + Supply Zone: Clean target region where sellers previously initiated moves
📈 Long Setup
Entry Zone: 25,000 – 25,050
Stop Loss: Below discount zone → 24,840
Take Profit 1: 25,250 (first FVG fill)
Take Profit 2: 25,380 (mid-structure inefficiency)
Take Profit 3: 25,460–25,580 (major supply & EQ zone)
Risk-Reward: 1:2 to 1:3 depending on entry
Bias: Short-term bullish retracement inside a larger downtrend
Disclaimer: Educational Purpose Only

USD/CAD: Elliott Wave Bearish BiasUSD/CAD is showing a bearish Elliott Wave structure on the 4H chart. Price appears to have completed a corrective Wave 2 near the 0.5–0.618 Fibonacci retracement zone, which is a common area for corrections to end. From there, the market has started to turn lower, suggesting the beginning of a new impulsive Wave 3 to the downside, which is usually the strongest bearish wave. As long as price stays below the recent swing high near the retracement zone, the bias remains bearish, with downside targets toward the 1.365–1.360 area. A move above the Wave 2 high would invalidate this count and delay the bearish scenario.
Stay tuned!
@Money_Dictators
Thank you :)

EXE - Institutional Demand at Work: High-Probability Trade Setup🧭 Overall Market Context 🧭
Price is currently trading inside an overlapping demand zone , and the quality of this zone is GOOD . What makes this setup stand out is the very strong follow-through seen when price previously left this area. Such impulsive exits are a clear footprint of institutional participation , where large players are unable to fill all their buy orders at once, leaving pending demand behind.
This return into the same zone gives the market a second chance to react — and these are often the areas where smart money steps in again.
🔍 Zone Quality & Structure 🔍
The structure of the current demand zone adds further confidence to the setup:
The demand zone is fresh and unviolated , meaning price has not yet consumed the pending buy orders.
The leg-out from the zone was impulsive , showing urgency and imbalance in favor of buyers.
Overlapping demand zones are present, which increases the probability of a strong reaction.
Price has now returned deep into the demand zone , which is an ideal location for planning long trades.
From a supply–demand perspective, this is exactly where we want price to be — low risk, high potential.
📈 Trend & Higher Timeframe Alignment 📈
Trend plays a crucial role in probability, and here the bigger picture is clearly supportive:
The weekly timeframe trend is UP , favoring buying opportunities from demand.
There is no higher-timeframe or daily supply zone overhead until the projected target area.
This creates clean upside space , reducing the risk of early rejection.
When demand aligns with the higher-timeframe trend and there is no nearby supply, the odds naturally tilt in favor of continuation.
🎯 Trade Plan & Risk Structure 🎯
A structured plan keeps emotions out of the equation:
Entry : From the current price area inside the demand zone.
Stop Loss : Below the distal line of the lower demand zone.
Target 1 : Minimum 1:2 risk–reward .
Risk here is clearly defined — a key characteristic of professional trade planning.
🧠 Market Logic Behind the Setup 🧠
Strong follow-through confirms institutional interest.
Higher-timeframe uptrend supports continuation.
Clean upside structure reduces friction for price movement.
This is a trend-aligned demand trade , not a counter-trend gamble.
When strong zones meet the right trend and location, probability quietly stacks in your favor.
🚀 Final Thoughts 🚀
This setup reflects the essence of demand and supply trading — clarity, structure, and patience . Trades like these don’t require prediction; they require discipline and alignment.
📉➡️📈 Trade with logic, manage risk with respect, and let probability do the heavy lifting. 💡🔥
Lastly, Thank you for your support, your likes & comments. Feel free to ask if you have questions.
This analysis is purely for educational purposes only and should not be considered as trading or investment advice..

USOIL DOWN SOME PIONTSShort oil at resistance** with low risk and high reward. **If it goes against me, the loss is small and managed, then I’ll buy at support.
Guys what do you think of it.

XAUUSD 1D T/F ANALYSIS----
xauusd 1d t/f analysis-----previous whole demand will be completes so wait for making a red candle on reversal area then we can se marked supply 50 and full zone from trending support area let`s see---

REVERSAL from our demand zone but stilll weak!As we can see NIFTY got rejected and did tried reversing but failed at now NIFTY isn trading at a no trade zone as supply and demand zones are closer that could lead to immense volatility hence one can scalp if appears on demand or supply zones and should not look for any positional trades for here.

Nifty 50The price has been moving in assending channel for many years . Currently the price is near the bottom support of this ascending channel. There is a horizontal resistance which , if it crosses we could expect a parabolic move in prices towards the upward side of the channel. Let's see how it moves.

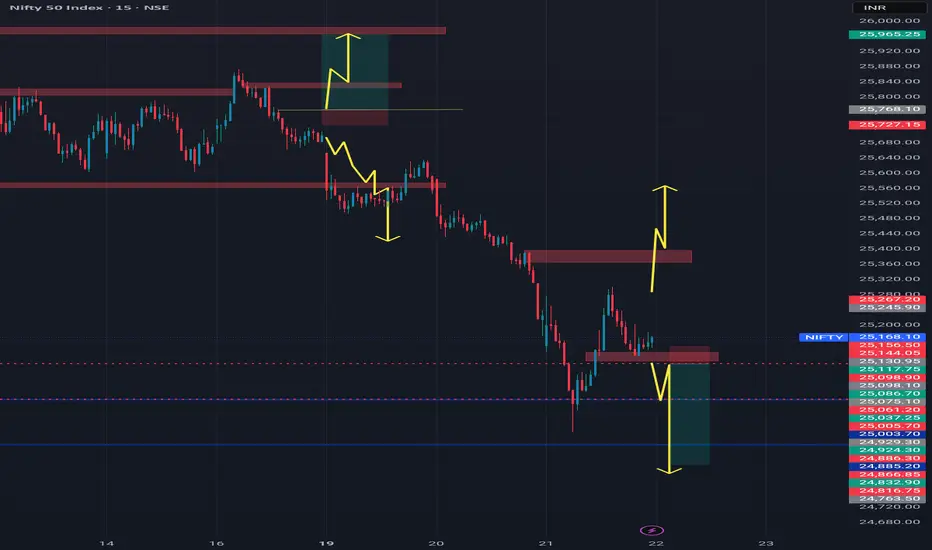
NIFTY : Trading levels and Plan for 22-Jan-2026
Timeframe: 15-minute
Gap Considered: 100+ points
Market Context: Sharp sell-off followed by a relief bounce; index is still below key resistance, indicating pullback within a broader corrective structure.
🔼 SCENARIO 1: GAP UP OPENING (100+ points) 🚀
If NIFTY opens above 25,316, it signals continuation of short-covering from lower levels.
The 25,316–25,370 zone will act as the first supply area.
Sustained 15-min close above 25,370 can open upside toward:
• 25,499 – 25,537 (Last Intraday Resistance zone)
Above 25,537, momentum extension toward 25,600+ is possible, but only with strong volume.
Failure to sustain above 25,316 = trap zone → expect pullback.
📌 Educational Note:
Gap-up markets after a fall often face supply. Prefer buy-on-dips rather than chasing green candles.
📌 Options Thought:
• Bull Call Spread (risk-defined)
• Avoid naked CE buying at resistance
• Book partial profits early 📈
➡️ SCENARIO 2: FLAT / RANGE OPENING ⚖️
If NIFTY opens inside 25,228 – 25,316, the market is likely to stay balanced and choppy initially.
This zone acts as Opening Support / Resistance + No-Trade Zone.
False breakouts are highly probable.
Upside confirmation only above 25,370.
Downside weakness resumes below 25,228.
Wait for a 15-min close outside the zone before acting.
📌 Educational Note:
Flat opens after volatile sessions usually mean time correction, not price correction.
📌 Options Thought:
• Theta strategies (Iron Fly / Short Strangle) only with SL
• Avoid aggressive directional bets
• Reduce quantity ⏳
🔽 SCENARIO 3: GAP DOWN OPENING (100+ points) 📉
If NIFTY opens below 25,228, sellers remain in control.
Immediate support lies near 25,109.
Breakdown below 25,109 exposes:
• 25,000 (Last Intraday Support – psychological level)
Below 25,000, selling pressure can accelerate.
Any bounce toward 25,228–25,316 should be treated as sell-on-rise.
📌 Educational Note:
In gap-down scenarios, capital protection is priority — trend is your friend.
📌 Options Thought:
• Bear Put Spread preferred over naked PE
• Avoid PE selling in trending markets
• Trail SL aggressively 📉
🧠 Risk Management Tips for Options Trading 🛡️
Risk only 1–2% of capital per trade.
Expiry proximity = faster premium decay.
Use spreads to manage volatility risk.
No confirmation candle = no trade.
Avoid overtrading in no-trade zones.
📌 Summary & Conclusion ✨
NIFTY is in a pullback phase within a broader corrective structure.
📍 25,228–25,316 remains the key decision zone.
📍 Strength only above 25,370 → 25,537.
📍 Weakness continues below 25,228 → 25,000.
Patience and level-based trading will be crucial today.
⚠️ Disclaimer
This analysis is for educational purposes only.
I am not a SEBI registered analyst.
Markets are uncertain and I may be wrong.
Please consult your financial advisor before trading.

Btcusdt bybitObserving this unpredictable market via trend lines and fib Retracement,ent - just to see what happens :)

BTC Cup and handle inside big BearFlag Risng wageUpdate
BTC reached a major rise around
1. Shows cup and handle where the handle is completed, short-term pullback might breakout today or tomorrow
2. Next Leg up around 97k - Porbablity 60%
3. Major Pull Back around 100k

PGIL - STWP Equity Snapshot
📊 STWP Equity Snapshot – PGIL (Pearl Global Industries Ltd)
(Educational | Chart-Based Interpretation)
Market Structure:
Price fell sharply from the recent high and moved into a known demand zone where buyers usually step in. From this area, buying interest appeared, highlighted by a bullish engulfing candle. This shows that buyers are active and willing to defend this level. However, price is still moving inside a broader range, so the overall trend has not yet changed. Strength is visible from support, but clear trend confirmation is still awaited.
Demand–Supply Structure:
Price declined strongly into a previous demand zone, where buyers reacted immediately and pushed prices higher. The bullish engulfing candle reflects short-term buying interest from this support area. However, price is still facing resistance at higher levels, which limits upside for now. This move should be seen as a reaction from demand rather than a confirmed breakout.
Key Levels – Daily Timeframe:
The support zones around 1398, 1349, and 1321 are areas where buyers have previously stepped in and defended price. The resistance zones near 1475, 1502, and 1552 are levels where selling pressure has appeared in the past. These levels are important because price has reacted here earlier and may do so again.
What the Chart is Saying:
The overall trend is still range-bound, meaning price is moving sideways rather than trending clearly. Momentum is slowly recovering from oversold levels, showing some improvement in buying interest. Buyers have successfully defended the demand zone, which has helped stop the recent fall. However, price may now spend some time consolidating before it decides the next clear direction.
CPR Impact:
PGIL is trading below a wide CPR, which shows that the market lacks strong directional confidence. Earlier attempts to move above the CPR did not hold, and this zone is now acting as resistance. A wide CPR usually leads to range-bound or corrective price action, which fits well with the current chart structure. As long as price remains below the CPR pivot, upside moves may face selling pressure. A sustained move and acceptance above CPR would be needed to signal any meaningful bullish shift.
Intraday Reference Levels (Structure-based):
The reference price zone near 1453 acts as the key area to watch in the short term. If support weakens, the risk area lies around 1356, where the structure may start failing. On the upside, zones between 1570 and 1648 are areas where price may react or pause. These levels indicate possible reactions, not predictions.
Swing Reference Levels (Hybrid Model | 2–5 days):
For the short swing view, the reference price zone remains around 1453. If demand fails, risk increases below 1353. If strength continues, higher zones between 1654 and 1805 come into focus as possible range expansion areas. These zones reflect potential movement within the range, not certainty.
Final Outlook (Condition-Based):
Momentum is moderate, showing some recovery but not strong acceleration. The trend remains range-bound, with no clear directional control yet. Risk is high because the move is a counter-trend recovery and price is also facing resistance from the CPR zone. Volume is moderate, supporting the move but not strong enough to confirm a trend change.
💡 STWP Learning Note
A strong candle at support shows interest, not confirmation.
Let price accept above resistance and CPR before assuming a trend change.
📘 STWP Approach
Observe price. Respect risk.
Let structure guide decisions — not emotions.
🚀 Stay Calm. Stay Clean. Trade With Patience.
⚠️ Disclaimer
This post is shared only for educational and informational purposes.
It is not investment advice or a recommendation.
Please consult a SEBI-registered financial advisor before making any financial decision.

Gold Analysis & Trading Strategy | January 21-22✅ 4-Hour Chart (H4) Analysis:
Gold has maintained a strong upward structure since launching from the 4537 area, with both highs and lows continuing to rise, confirming that the overall bullish trend remains intact. After reaching the 4888 area, upside momentum has started to slow, and price has entered a phase of high-level consolidation and technical correction. Although the moving average system (MA5 / MA10 / MA20) remains in a bullish alignment, the market clearly needs to digest the previous rapid advance. As a result, this is no longer an ideal stage to chase longs; a more reasonable approach is to wait for pullbacks before reassessing new trend-following opportunities.
✅ 1-Hour Chart (H1) Analysis:
On the short-term timeframe, price formed a temporary top near 4888 and has since entered a corrective phase, gradually pulling back toward short-term moving averages and the rising trendline. This movement is considered a normal correction within a broader bullish trend. As long as price holds above the 4800–4790 zone, the overall structure remains strong and the pullback can be viewed as a consolidation phase. However, a decisive break below this support area would increase the risk of a deeper correction and require tighter risk management.
🔴 Resistance Levels: 4850–4865 / 4888–4906
🟢 Support Levels: 4820–4800 / 4790–4775 / 4695–4700
✅ Trading Strategy Reference:
🔰 Trend-Following Approach (Primary Strategy)
📍 Wait for price to pull back into the 4820–4800 / 4790 zones
📍 After stabilization signals appear, attempt light, staggered long positions
Condition: The H1 structure remains intact
🔰 Defensive Approach (Risk Control)
📍 If price breaks below 4790 and fails to recover quickly
📍 Decisively reduce exposure or exit positions and wait for new structural confirmation
✅ Trend Summary:
👉 Medium-term trend (H4): Bullish trend remains intact, but price has entered a high-level consolidation phase
👉 Short-term condition (H1): Corrective pullback + cooling momentum
👉 Core strategy: Do not chase highs; focus only on pullback structures
👉 Key defense zone: 4800–4790 — a clear break below requires heightened caution

In BNTUSDT.P bulls are almost losing controlBINANCE:BNTUSDT.P
The chart structure appears weak, suggesting that the current pullback could lead to a significant dip. In this scenario, a high‑risk short position may offer better potential than a low‑risk long, which could turn into a trap.
Disclaimer ⚠️: This is not financial advice. Please conduct your own research before making any investment decisions. #Binance #BNTUSDT.P #Bancor #BNT

#NIFTY reversed from 24920 levels - Nextt 25500/25650/25760++As we see today, nifty went down further as predicted near 24960 levels as next downside , it went upto 24920 and recovered sharply.
Tomorrow again buy on dips until 24920 is holded.
On any up move above 25300-25330 , sharp short covering rally possible
next targets are 25500/25650/25760++ in 2-3 sessions only.

NIFTY (22-01-2026)Please note this levels are for intraday trading only.
Soch Samajh ke 🐉
Technical Analysis of Nifty
[This is for educational purposes only

A Completed Impulse Now Gives Way to Correction in VoltasFrom its inception low near ₹2.60 , Voltas has unfolded a clear long-term 5-wave impulsive advance on the monthly timeframe , culminating near ₹1,994.90 . The structure of this move aligns well with classical Elliott Wave principles, suggesting that a larger-degree impulse cycle has likely concluded .
Following this structural completion, price action has transitioned into a corrective phase . The initial decline fits well as Wave W , unfolding in a zigzag structure . This has been followed by a rebound that appears corrective in nature and can be interpreted as the connector Wave X .
If this interpretation holds, the broader correction may continue with one more leg lower in Wave Y , potentially drawing price toward the 50% Fibonacci retracement zone of the entire impulse. Such behavior would be consistent with a higher-degree corrective process , rather than a trend reversal.
Until the corrective structure is fully resolved, any interim rallies are more likely to be corrective in nature and may be viewed as potential selling opportunities , rather than the start of a new impulsive advance.
At this stage, the focus remains on structure and price behavior , as corrective phases tend to be overlapping and time-consuming . The larger trend remains intact, but patience is required before expecting trend resumption.
Disclaimer: This analysis is for educational purposes only and does not constitute investment advice. Please do your own research (DYOR) before making any trading decisions.

Bitcoin Investment strategyTime-Based Accumulation & Distribution Idea
Bitcoin has historically respected long-term time cycles. Rather than focusing on short-term price noise, this idea explores a time-window approach that aligns with structural supply shocks and market psychology.
The concept is simple but powerful:
identify a accumulation phase well before the event, and a distribution window once the cycle matures. These windows are not about exact tops or bottoms, but about positioning within a broader asymmetric opportunity.
This approach assumes volatility, drawdowns, and false signals along the way — but the edge lies in time in the market, not timing the market.
With the next accumulation already on the clock, the question isn’t if the cycle repeats — but how it expresses itself this time.
More insights as we get the next signal

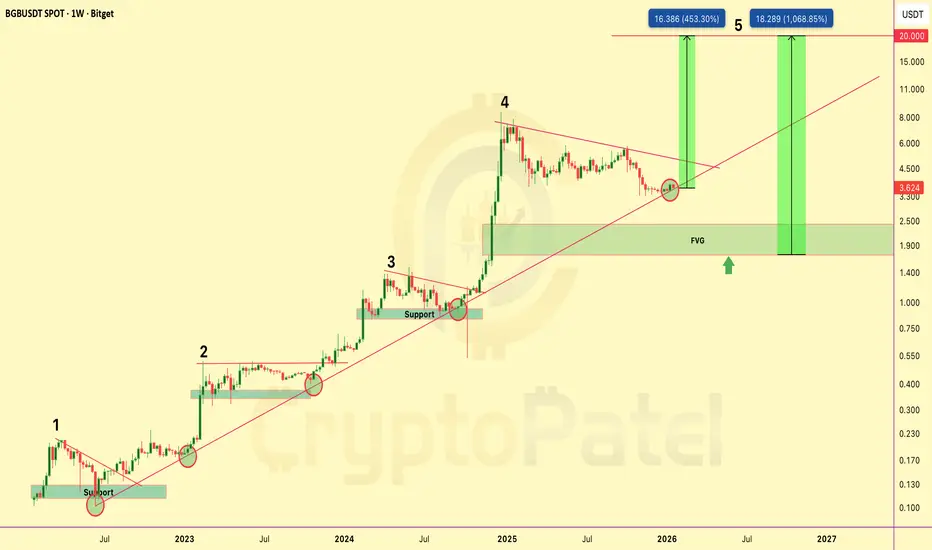
$BGB PRICE PREDICTION | 450%–1000% POTENTIALBGB is trading inside a well-defined long-term rising channel on the weekly timeframe, respecting bullish market structure since 2022.
Price has completed a full accumulation → expansion cycle and is currently undergoing a healthy corrective phase before the next impulsive move.
Technical Structure
Long-term ascending trendline remains intact
Clear 5-wave Elliott structure on HTF
Wave 4 correction following a strong impulsive expansion
Price reacting from dynamic channel support
HTF Fair Value Gap (FVG): $2.40 – $1.70
Bullish structure maintained above $3.40
Upside Targets (Wave 5 Extension)
$10
$15
$20
Alternative Scenario
If price breaks below $3.40 and an HTF candle closes below this level, there is a high probability of a move toward the $2.00 support and HTF FVG zone, which would represent a strong long-term accumulation area rather than trend invalidation.
Bias & Invalidation
As long as BGB/USDT holds above the rising channel support, the macro bullish bias remains intact.
Invalidation: Weekly close below the rising channel.
Technical analysis only. Not financial advice. DYOR.
NiftyNifty has attempted multiple recoveries after the fall, consistently taking support near the 25100 level. If the index opens with a gap down below 25100 and forms a strong bearish candle, a further downside move towards 24750 can be expected. A bullish move is likely only after a decisive break above 25400. Until then price action remain sideways within the 25300-25100 range.
Bajaj Finance: When Structure, Liquidity & Catalysts Line UpStructure
The rally from ₹849 to ₹1,102.50 unfolded as a clean 5-wave impulse , clearly establishing the move as directional and non-corrective .
Post the impulse high, price transitioned into a corrective phase , drifting lower within a well-defined descending channel . From an Elliott Wave perspective, the decline fits well into a W–X–Y double zigzag structure, with the current leg likely unfolding as Wave Y — suggesting a mature correction rather than trend damage.
Liquidity
Crucially, Wave Y is now approaching an unfilled gap that aligns closely with the 0.786 Fibonacci retracement of the prior impulse. This convergence marks a potential liquidity zone , where downside momentum may begin to exhaust and responsive buying interest could emerge.
This area warrants close observation for bullish reversal candlestick patterns and/or bullish divergence on RSI , which would strengthen the case for a constructive reaction from this zone.
Catalysts
Adding further context, earnings are scheduled for Feb 3rd , with the Union Budget on Feb 1st — two near-term events that could act as timing catalysts. A positive price response around this liquidity pocket could help transition the structure from corrective to impulsive, setting up a high-quality trade opportunity with a favorable reward-to-risk profile .
Risk Management
Importantly, bullish invalidation lies below ₹849 . As long as this level holds, the impulsive base remains intact, keeping risk clearly defined and asymmetric.
Conclusion
This is a high-context, high-clarity zone where structure is mature, liquidity is in focus, and catalysts are lined up . Upside confirmation from here could unlock a meaningful move, making patience and disciplined observation key.
Disclaimer: This analysis is for educational purposes only and does not constitute investment advice. Please do your own research (DYOR) before making any trading decisions.

$ASTER PRICE PREDICTION | HTF ACCUMULATION | 2400% MACRO POTENT?SEED_WANDERIN_JIMZIP900:ASTER is currently trading inside a high-timeframe accumulation base after a prolonged downtrend.
Price compression near major demand suggests trend exhaustion and a potential volatility expansion ahead.
Market Structure Overview
✅ Prolonged downtrend → exhaustion phase
✅ HTF accumulation forming
✅ Descending trendline pressure building
✅ Volatility compression → expansion setup
SEED_WANDERIN_JIMZIP900:ASTER is already ~78% down from its September 2025 ATH, significantly improving risk–reward for long-term positioning.
Key Accumulation Zones
Zone 1: $0.70 – $0.60 ✅ (Filled – bounce expected)
Zone 2 (Macro flush scenario): $0.45 – $0.35
→ Strong long-term accumulation zone if broader market weakness persists
Upside Targets (CryptoPatel View)
$1.50 → $2.00 → $5.00 → $10.00 → $20.00
Macro extension: $20 – $30 (long-term, high-risk / high-reward)
Invalidation: Loss of HTF demand structure → High-risk hold
Market Talk
As per public disclosures circulating on 2 Nov 2025, CZ was reportedly exposed to SEED_WANDERIN_JIMZIP900:ASTER below ~$0.91, holding approximately 2.09M ASTER.
While not a signal, this adds sentiment confidence to the long-term accumulation narrative.
Long-Term Thesis
This phase appears to be early accumulation, not confirmation.
If HTF demand holds and structure flips bullish, $5–$10 becomes realistic, with $20+ as a full-cycle expansion scenario.
Disclaimer:
This is technical analysis & market discussion only — not financial advice.
Always manage risk and do your own research.

5PAISA for 35% gain in 12-18 Month5Paisa capital will be able to give 35% gain in 1-2 year time Frame , it may go down 10% more down from current level but having potential to give 35% gain soon.
